




Cardano Price Forecast: Rally pauses as mixed metrics flag caution
- Cardano trades below $0.260 on Monday after rallying more than 11% the previous week.
- Mixed derivatives metrics and bearish on-chain metrics support a cautious outlook for ADA.
- The technical outlook suggests ADA could take a breather before potentially resuming its broader upside move.
Cardano (ADA) shows signs of consolidation, trading below $0.260 on Monday after an 11% gain the previous week. Mixed derivatives and on-chain metrics point to caution among traders. Meanwhile, the technical outlook suggests bullish sentiment remains, but ADA’s near-term direction remains uncertain.
Mixed derivatives outlook
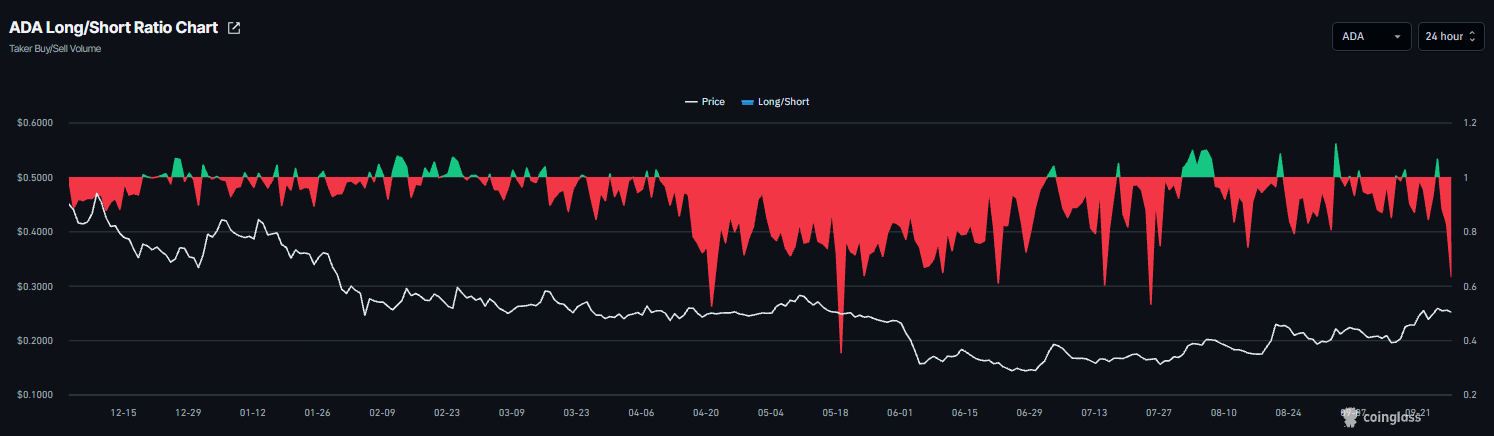
Derivatives data shows a mixed and cautious outlook among Cardano traders. CoinGlass’ long-to-short ratio for ADA read 0.63 on Monday, nearing the lowest level over a month. A ratio below one indicates bearish sentiment, as traders bet that asset prices will fall.
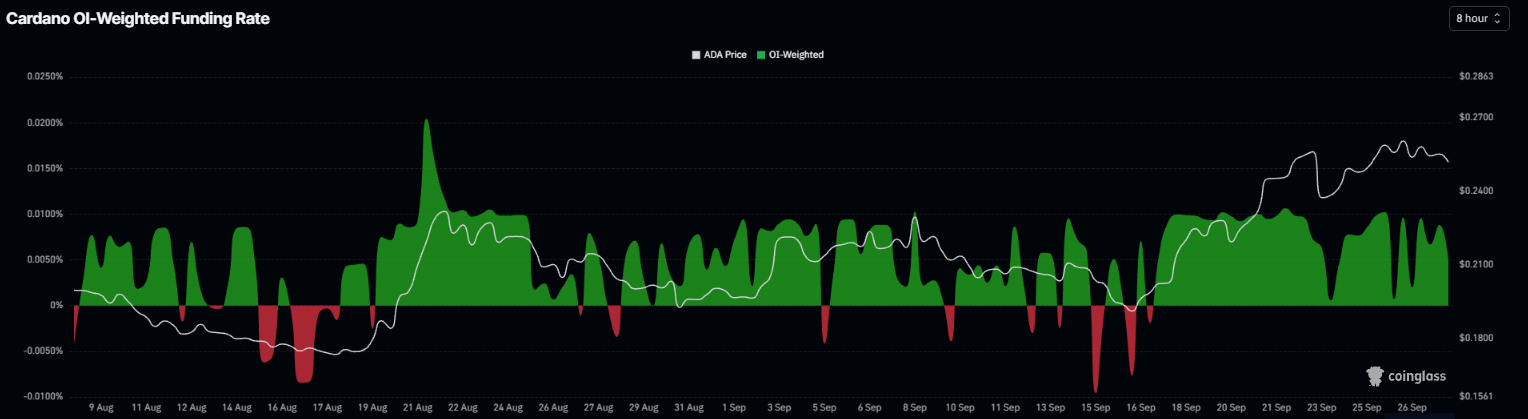
Meanwhile, Cardano’s funding rate flipped positive on September 17, reading 0.0050% on Monday. This indicates longs are paying shorts, reflecting a bullish outlook for Cardano.
This divergence suggests mixed sentiment among derivatives traders, with no clear directional conviction.
On-chain metrics show cautious sentiment
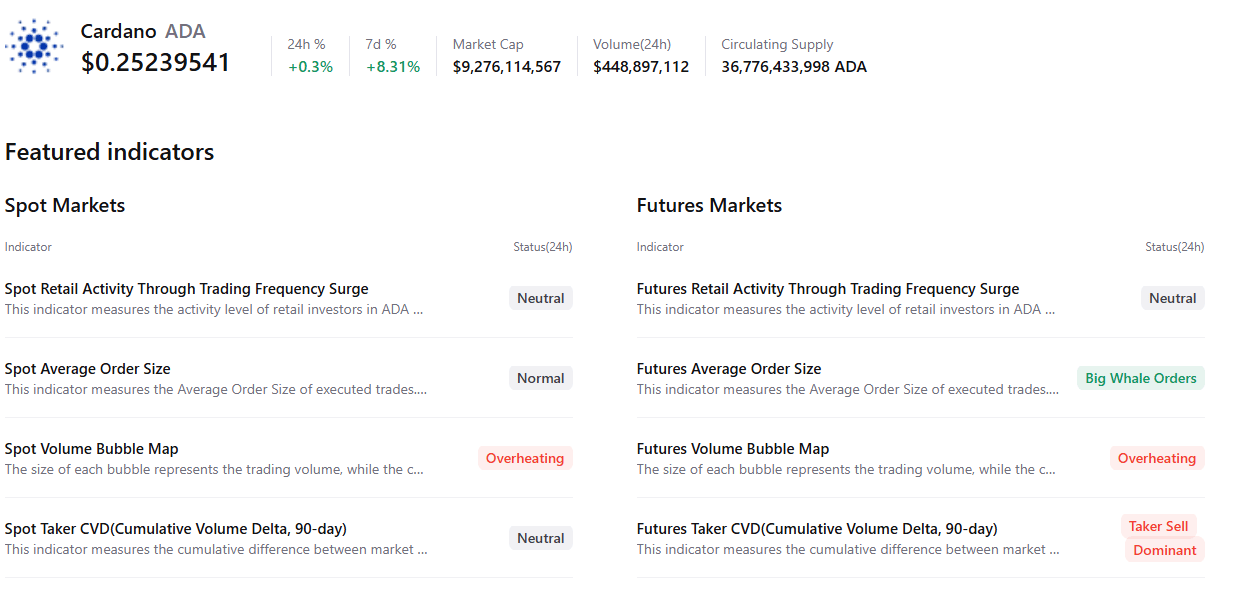
CryptoQuant’s summary data shows some signs of concern. ADA’s futures markets show large whale orders; however, they also show sell-side dominance and overheating conditions following its recent gains. In addition, spot markets show overheating conditions while other metrics remain neutral, highlighting a mildly bearish, cautious sentiment bias among Cardano traders.
Cardano technical outlook: Pauses its gains
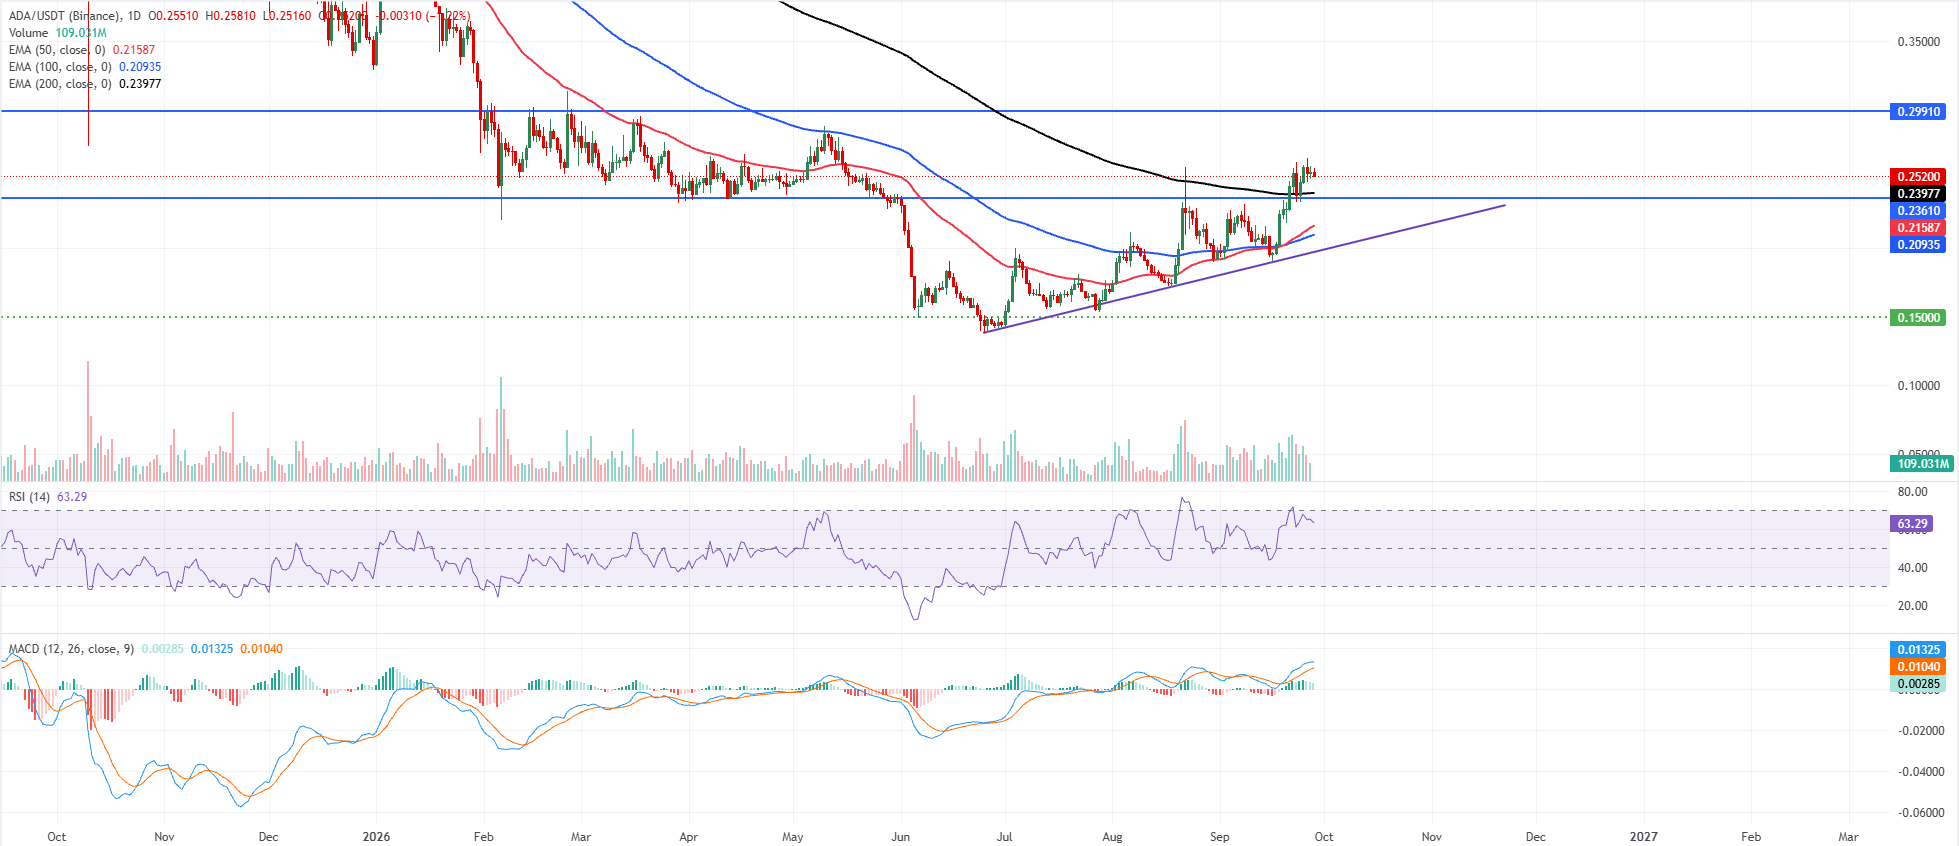
Cardano price trades at $0.252 on Monday after surging over 11% in the previous week. Despite the recent pullback, ADA holds above the Exponential Moving Averages (EMAs), with the 50-day EMA at $0.215, the 100-day EMA at $0.209, and the 200-day EMA at $0.239, all underpinning a constructive bullish bias.
ADA also holds above the horizontal support at $0.236. At the same time, momentum stays positive as the Relative Strength Index (RSI) hovers around 63 and the Moving Average Convergence Divergence (MACD) line remains in positive territory, suggesting buyers retain control in the near term.
On the downside, initial demand appears at the $0.236 horizontal floor, followed by the 200-day EMA at $0.239 as layered trend support, with deeper cushions at the 50-day EMA near $0.215 and the 100-day EMA at $0.209, ahead of the former trendline support zone around $0.197 and the more distant $0.150 level.
On the topside, the next significant barrier emerges at the horizontal resistance near $0.299, where fresh selling pressure could appear if the current bullish leg extends.
(The technical analysis of this story was written with the help of an AI tool. Know more.)
Recommended Articles


