


Why XRP Must Resist an 8% Drop to Keep Its Breakout Structure Alive
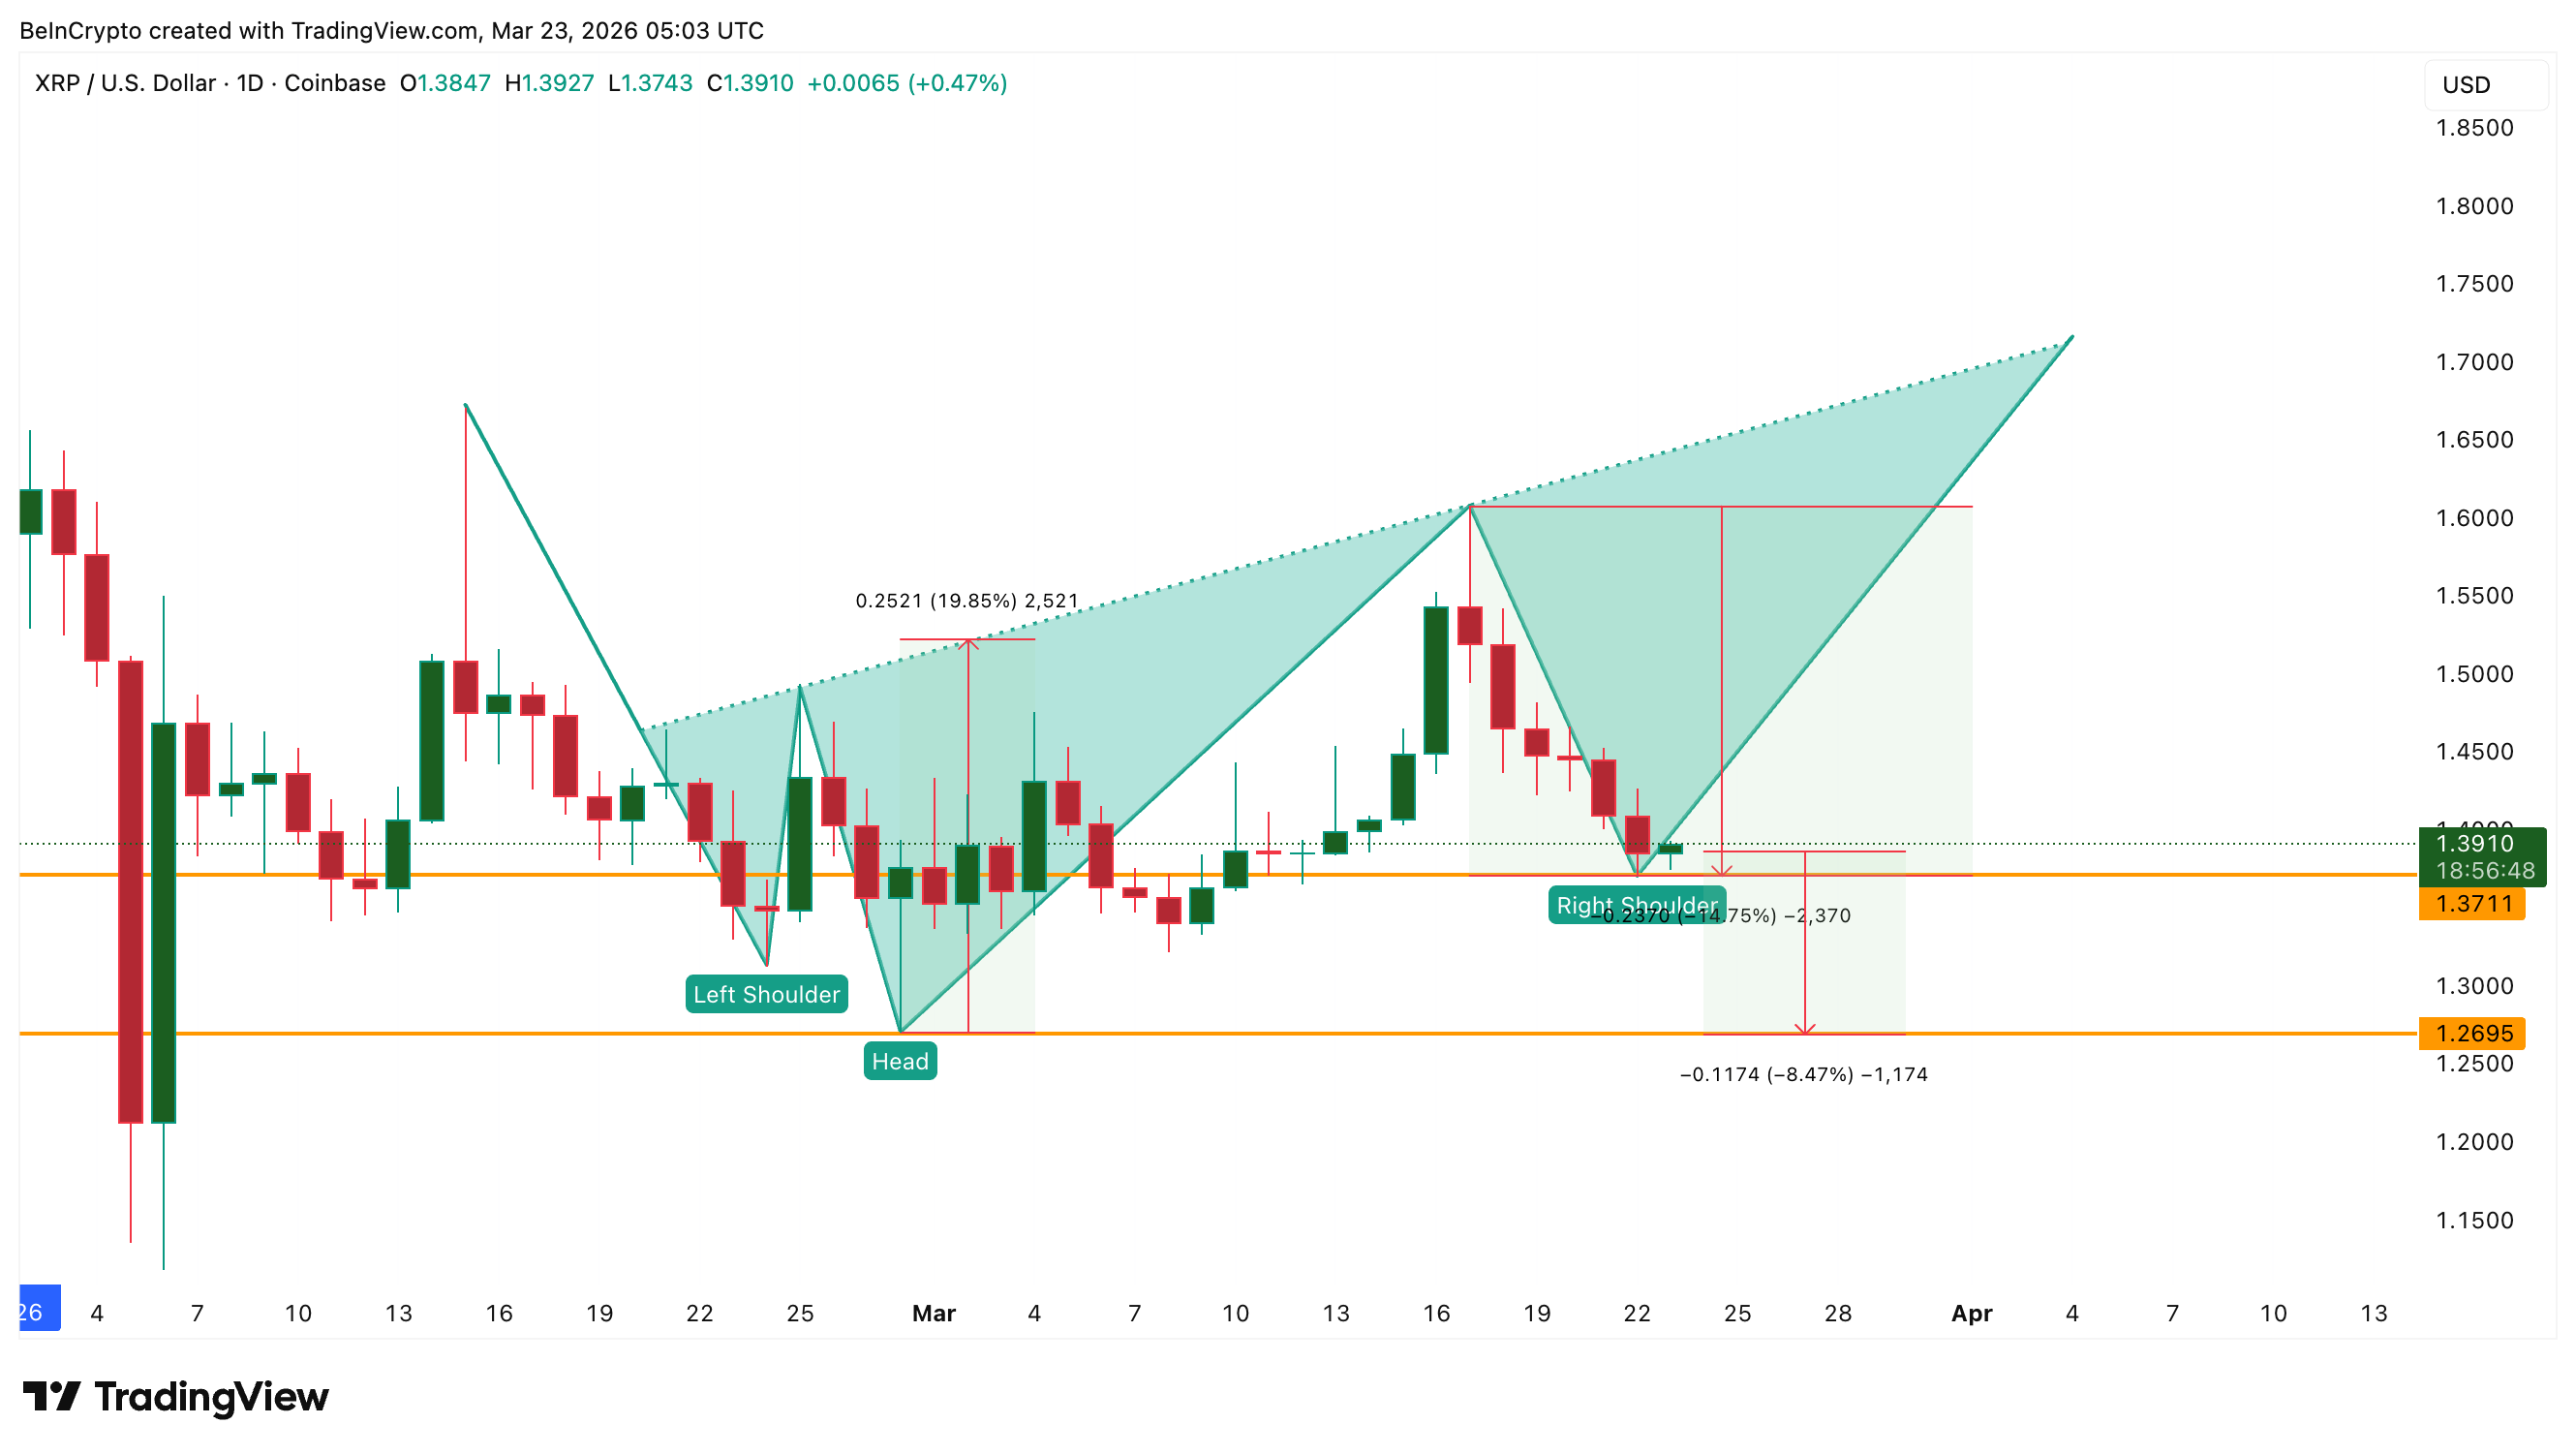
XRP (XRP) price fell roughly 15% since March 17 to trade near $1.38, yet the daily chart still clings to an inverse head-and-shoulders pattern with a 20% breakout target.
The correction has pushed XRP toward the right shoulder of the formation. If the floors hold, the pattern stays valid. If they break, the structure collapses. On-chain metrics suggest conviction holders are betting on the former.
Critical Pattern Keeps Bullish Hope Alive
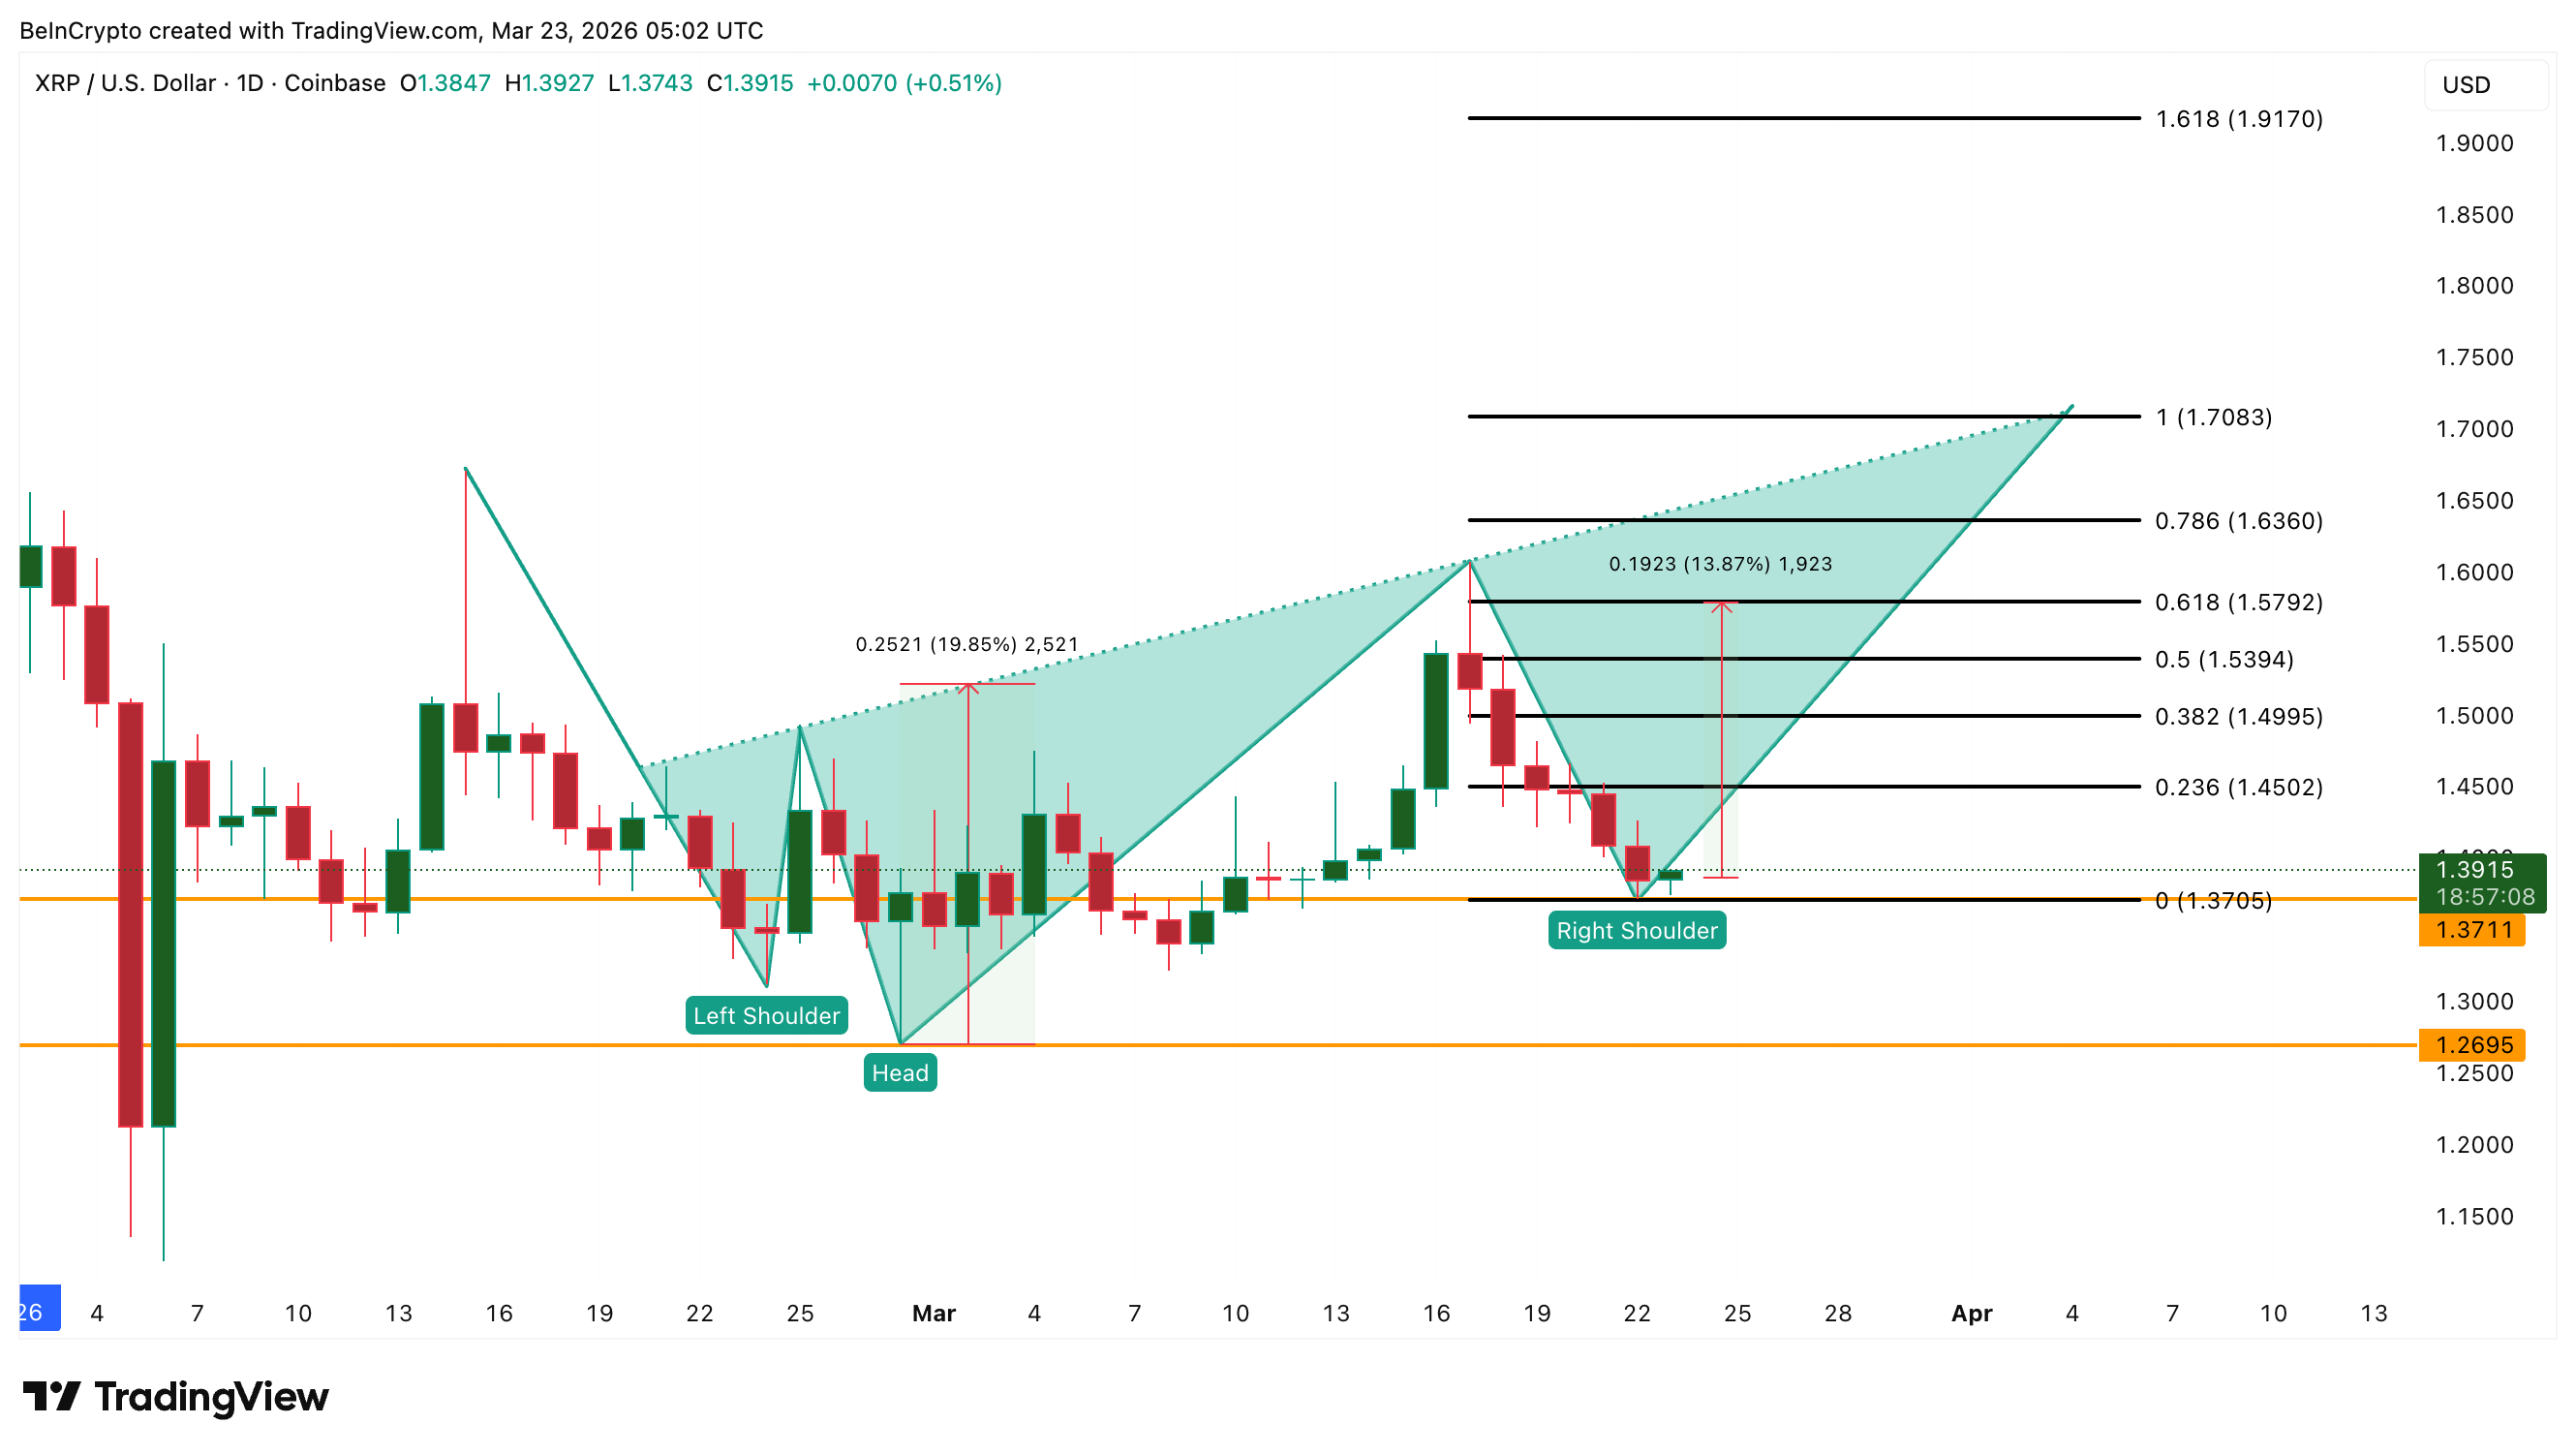
The daily chart on Coinbase shows XRP building an inverse head-and-shoulders since late February. The price is currently hovering around the right shoulder zone, and a break under would weaken the first floor. The neckline sits higher, but for now, the XRP price must try its best to either stay above the first floor (the current right shoulder level) or at least the next floor (mentioned next).
However, the pattern requires that the XRP price not fall by more than 8% from current levels. A drop below the head at $1.26 would invalidate the entire formation and shift the bias from a potential breakout to a continuation of the downtrend. The 15% decline since March 17 has already tested patience, but the structure technically remains intact as long as the right shoulder or even the head holds.
 Key XRP Pattern: TradingView
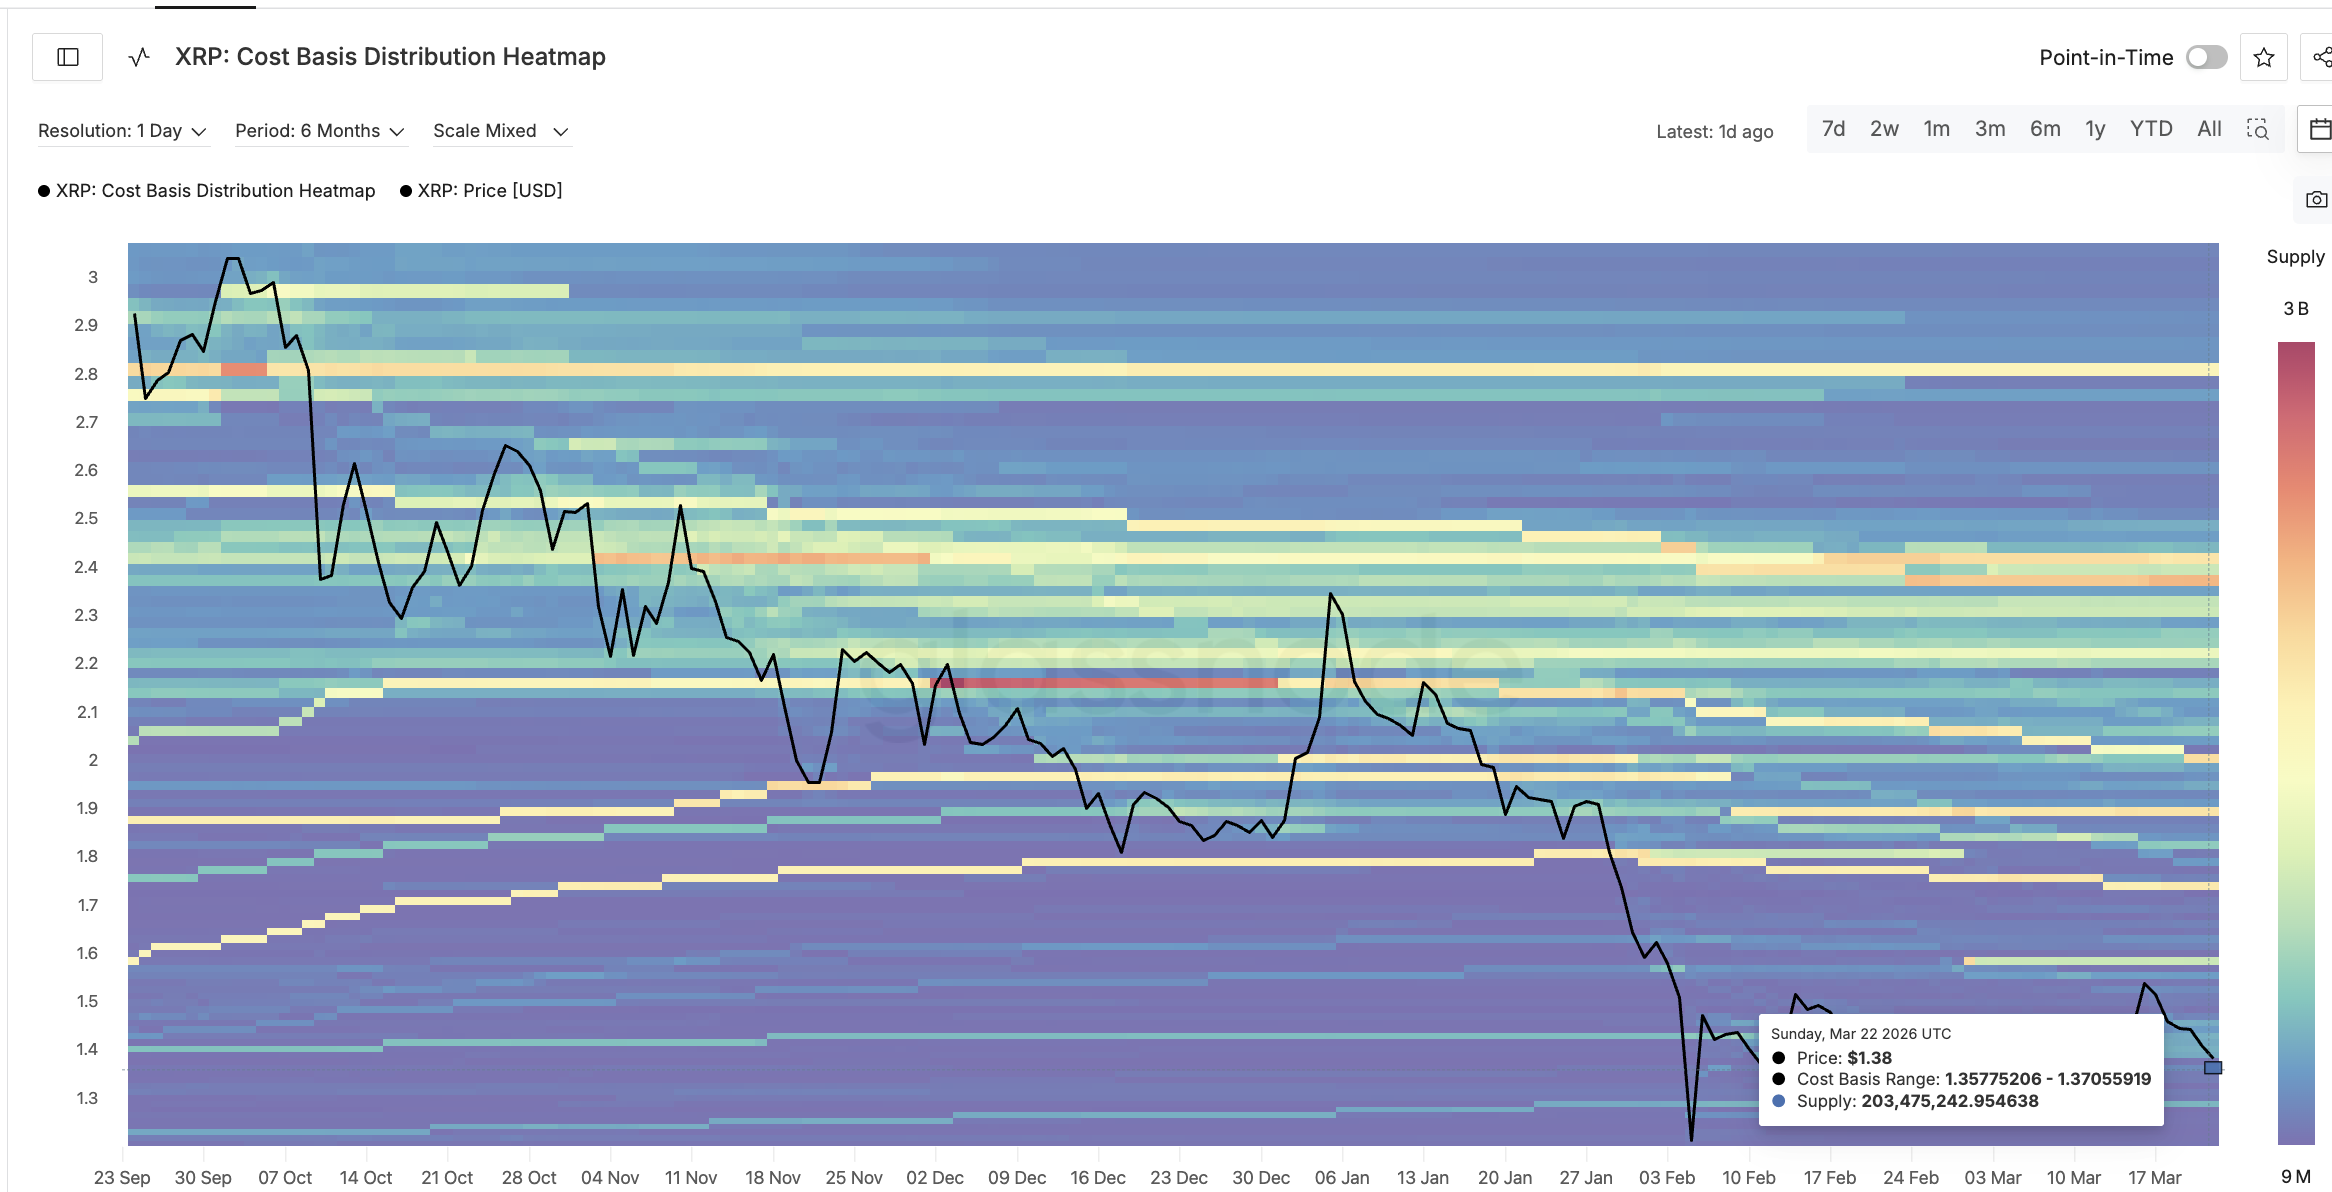
The cost basis distribution heatmap, a Glassnode metric that maps where holders last acquired their tokens, validates these technical floors. The $1.35 to $1.37 zone holds roughly 203 million XRP supply, creating a dense cluster of holders who have an incentive to defend their entry.
 XRP Cost Basis Cluster at $1.37: Glassnode
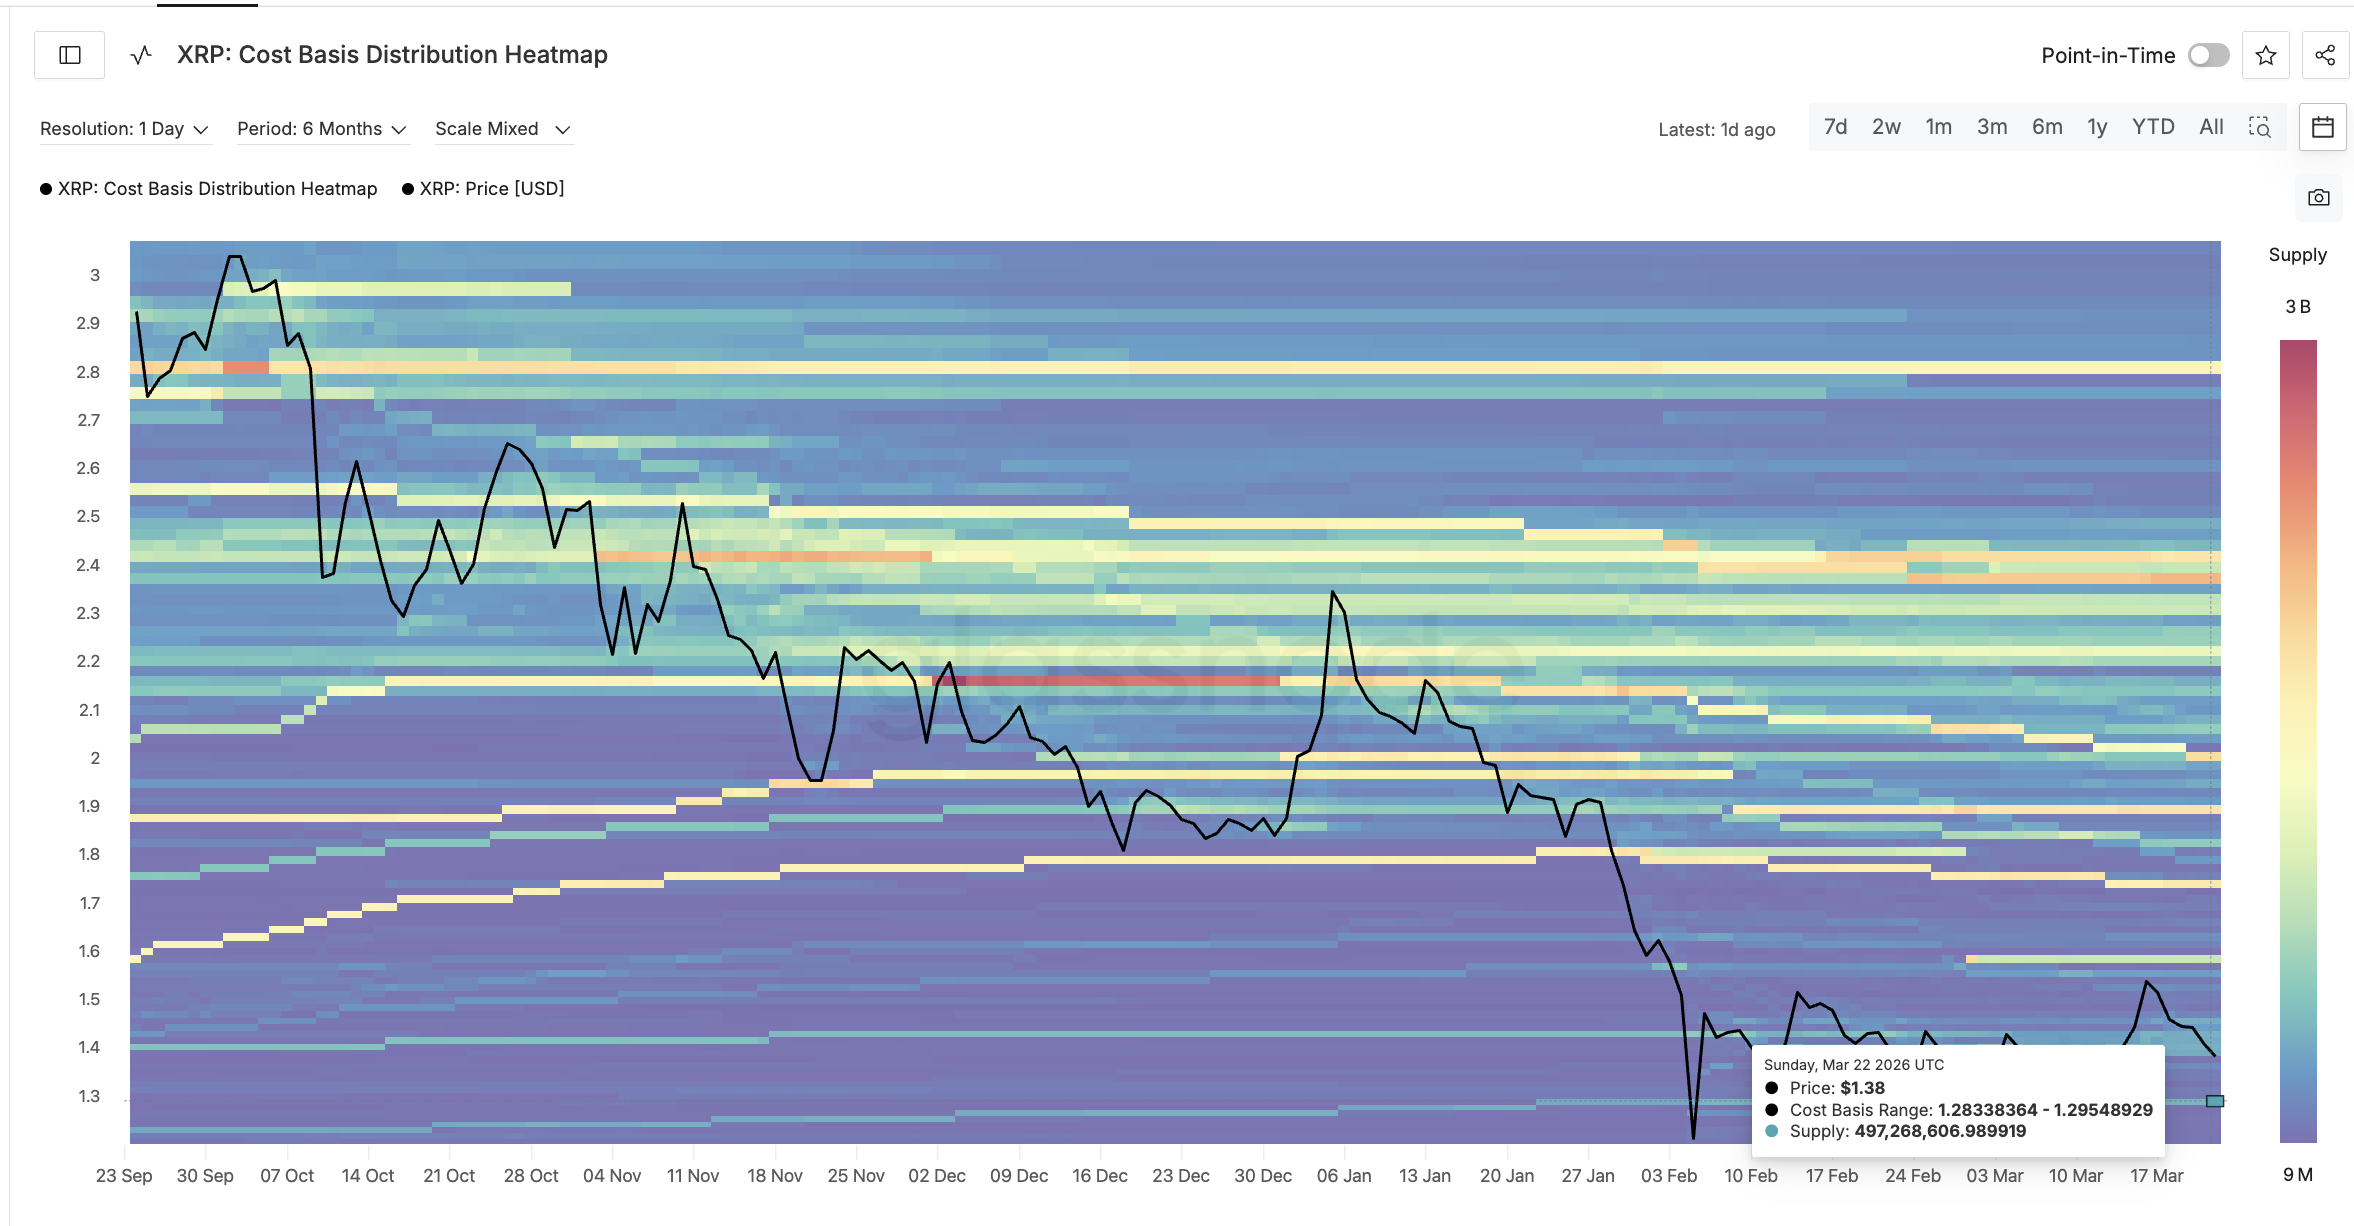
Deeper down, the $1.28 to $1.29 range contains an even heavier pocket of approximately 497 million XRP. That second cluster sits just above the head of the pattern, reinforcing $1.26 as a do-or-die level.
 XRP Cost Basis Cluster at $1.29: Glassnode
Together, these two zones represent over 700 million XRP held by participants who bought during the recent weakness. If prices stabilize, these holders are likely to add more. If prices breach $1.27, they face losses and could accelerate the selling. But whether these clusters hold depends on broader market conviction, which the next section measures.
Hodlers Add While Leverage Fades
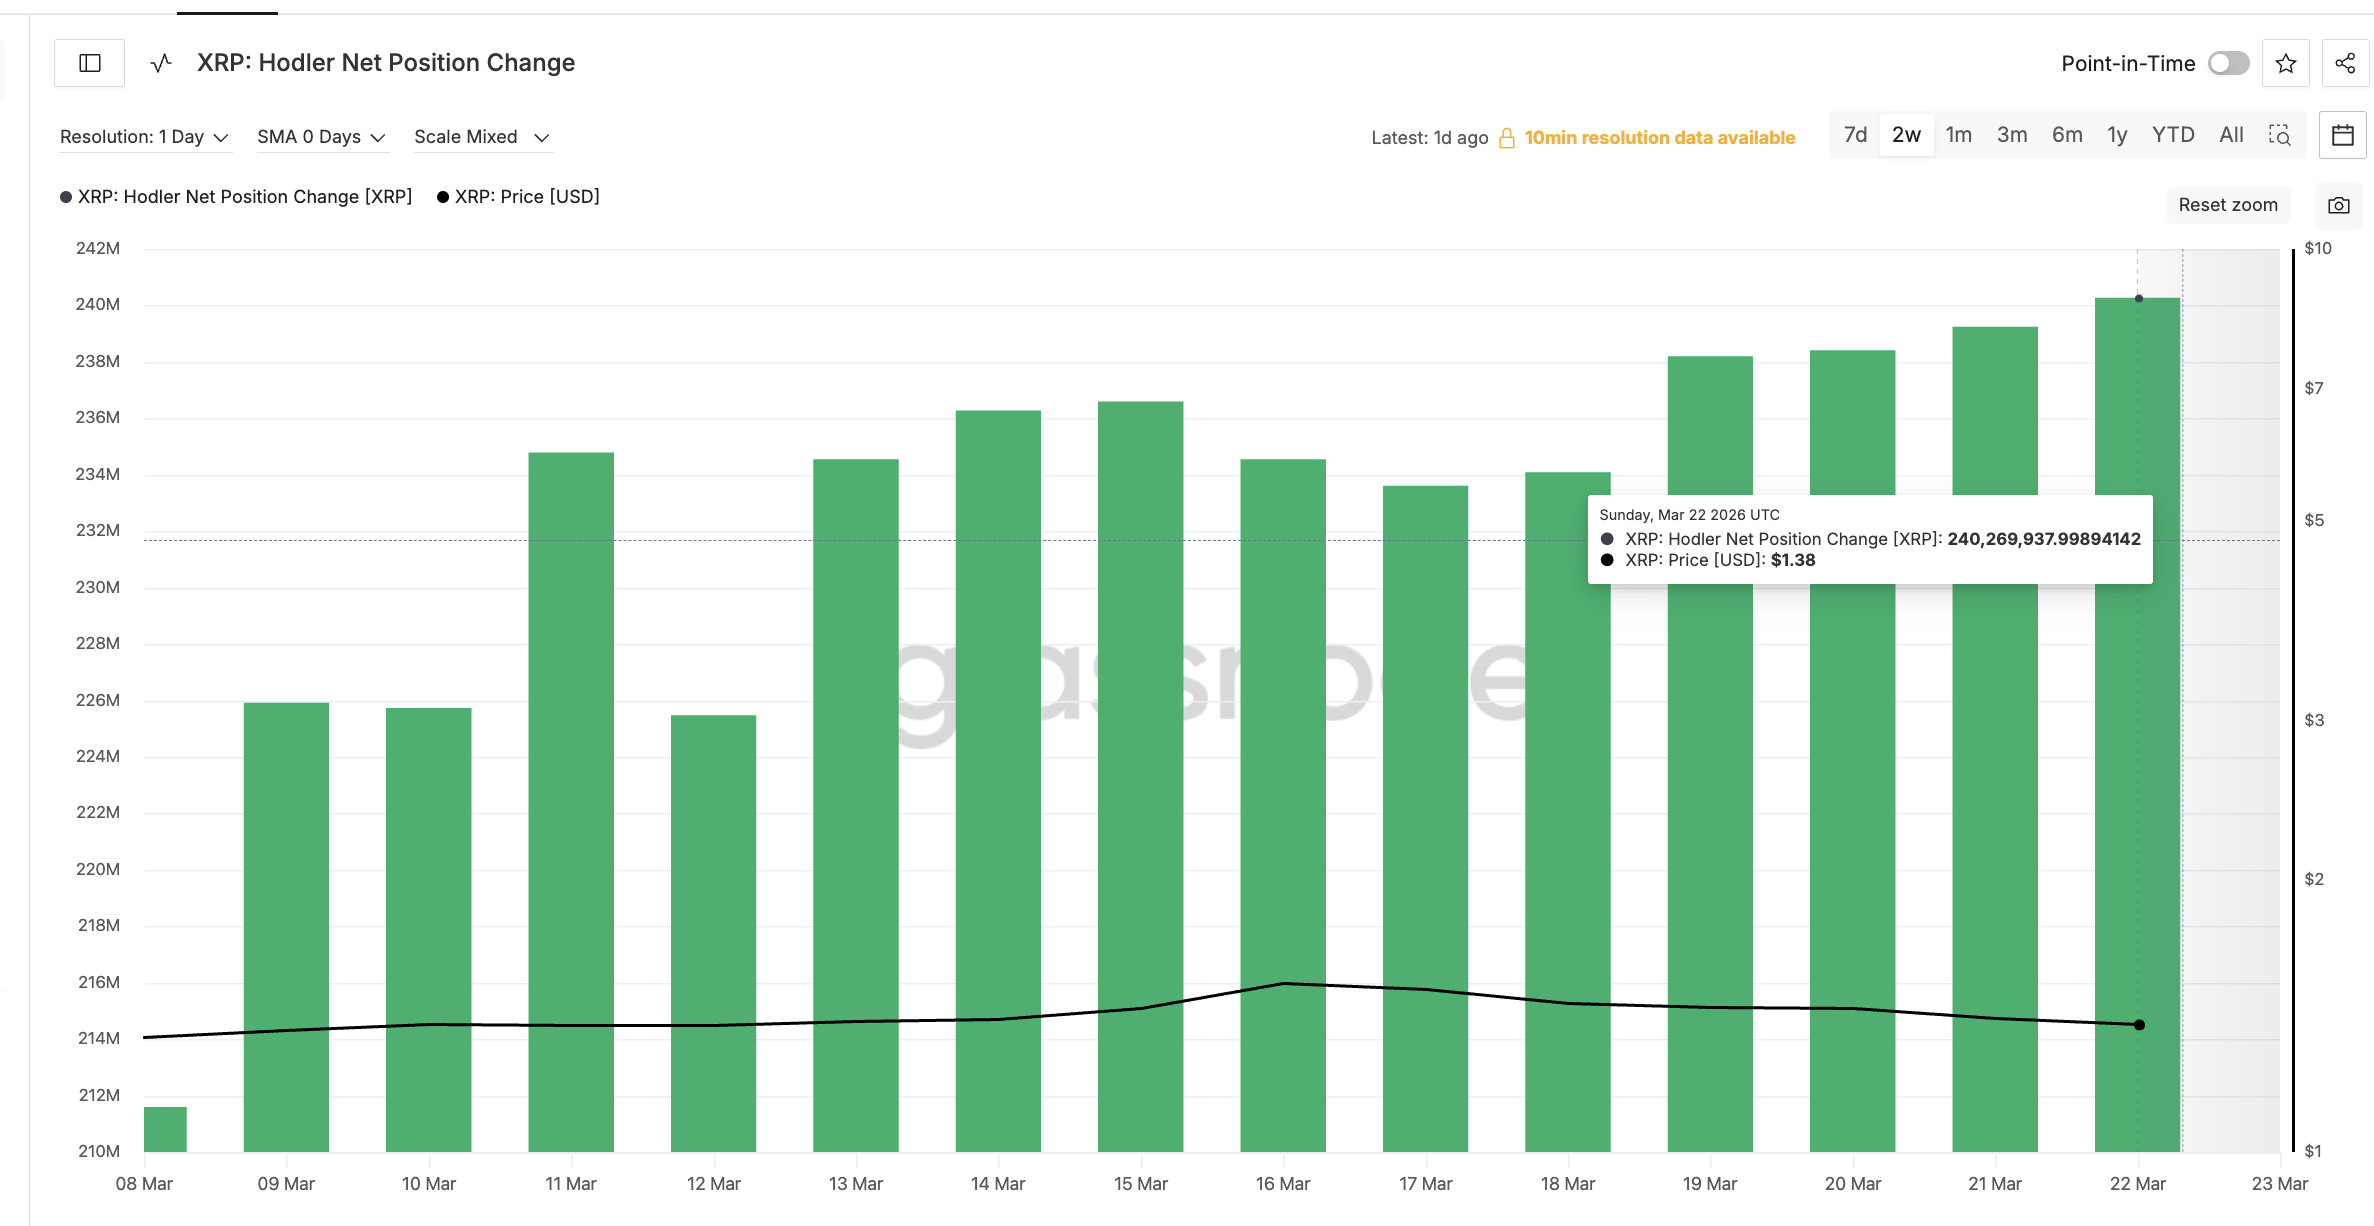
The hodler net position change, a Glassnode metric tracking accumulation or distribution by addresses holding for 155 days or more, paints a picture of steady conviction. On March 17, when the selloff began, hodlers held a net positive position of 233.6 million XRP. By March 22, that figure had climbed to 240.3 million XRP, a roughly 3% increase in five days despite a 15% price decline.
Want more token insights like this? Sign up for Editor Harsh Notariya’s Daily Crypto Newsletter here.
 XRP Hodler Net Position Change: Glassnode
The bars on the chart have been consistently green since early March. Even the sharpest drops did not flip the metric negative.
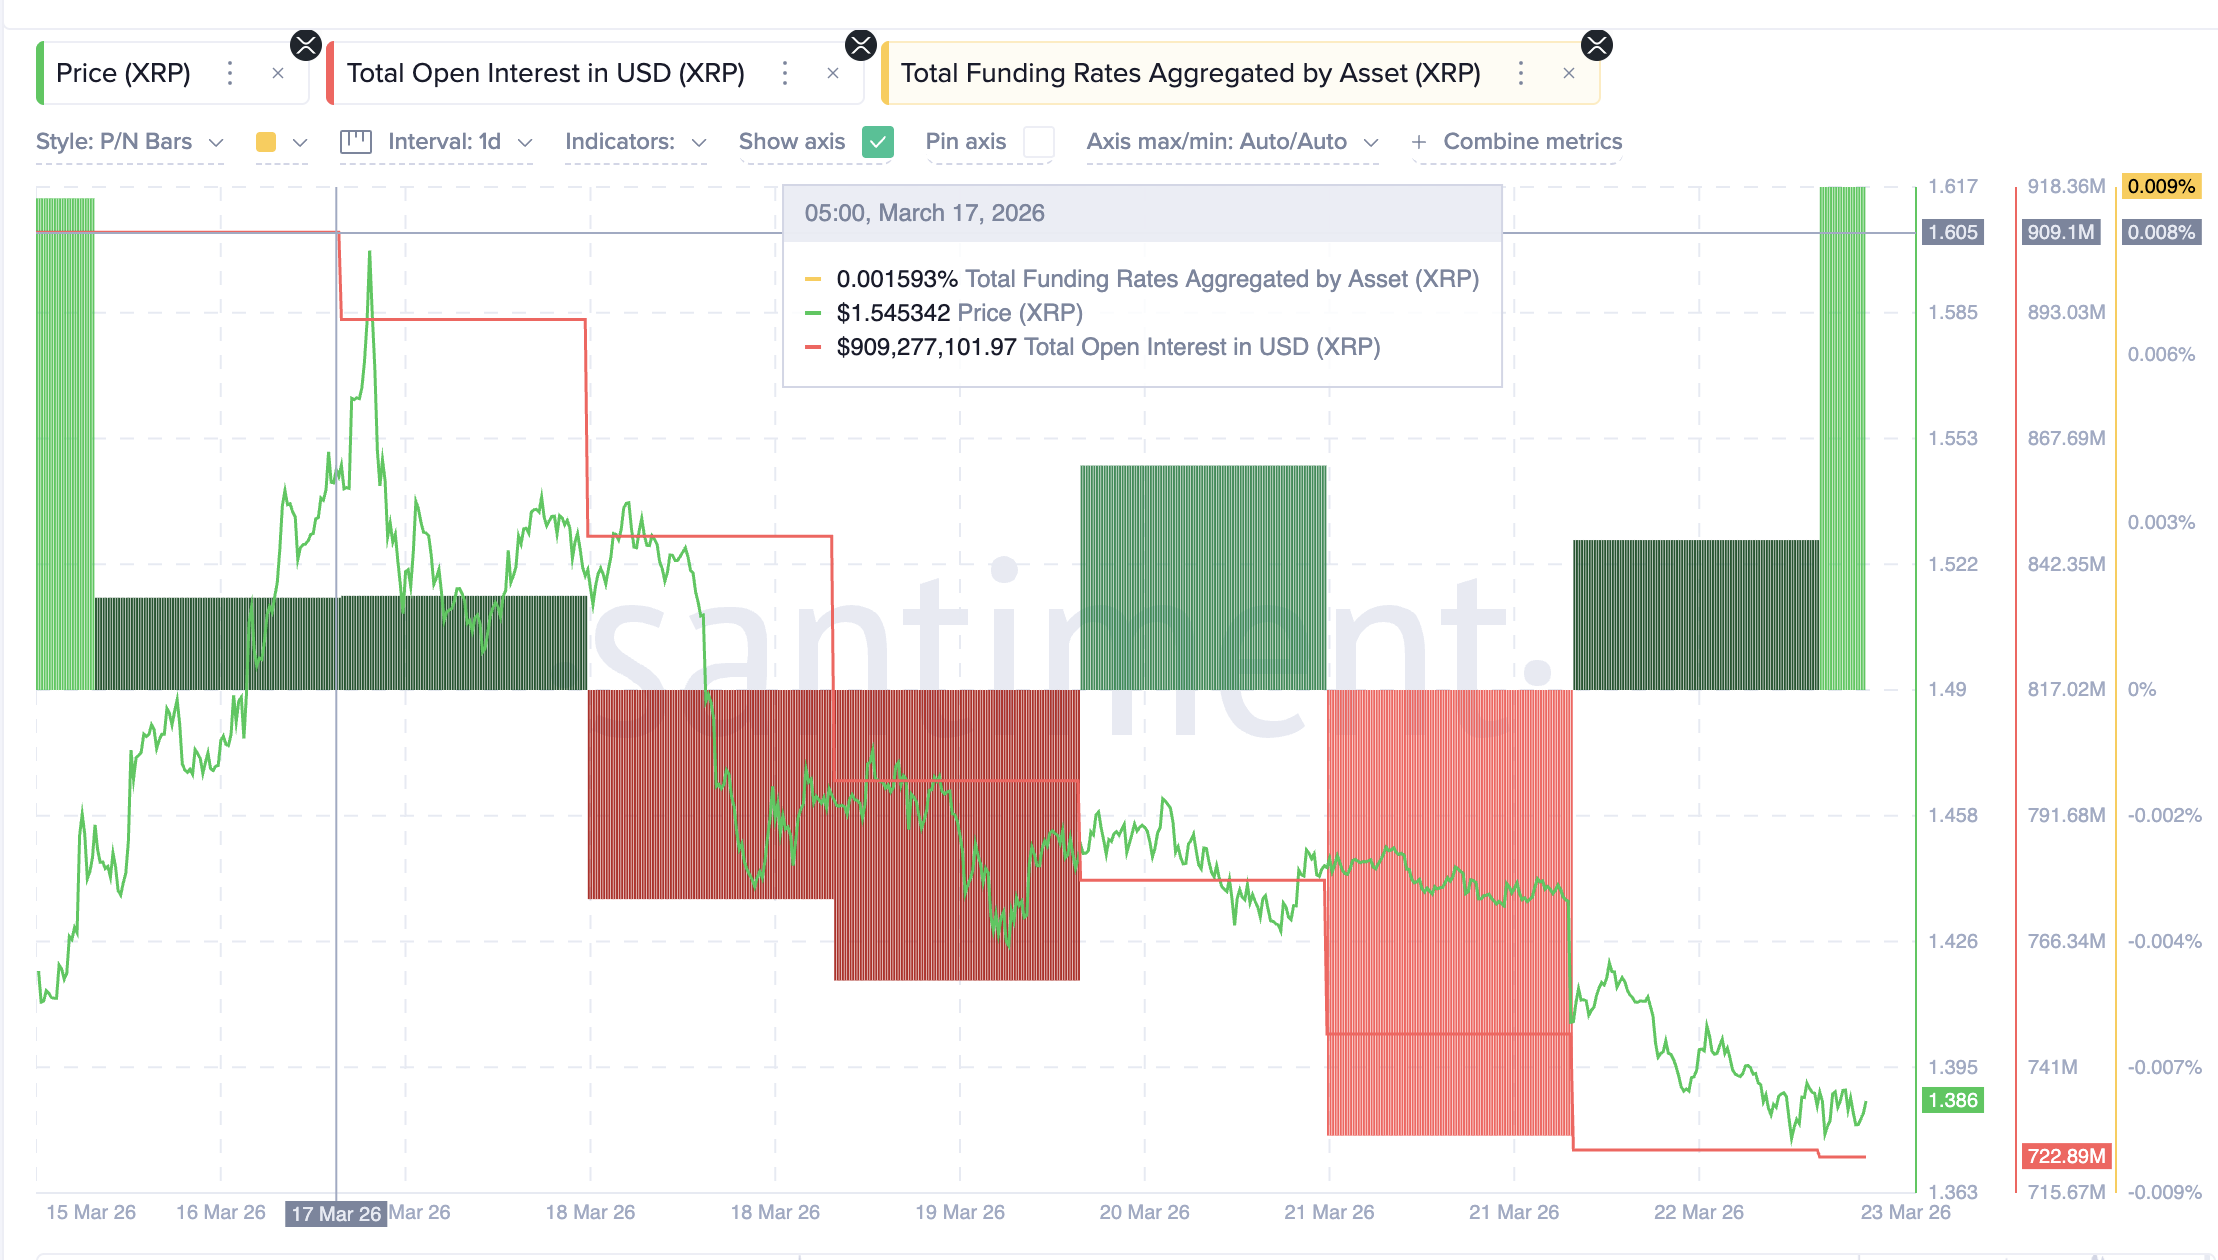
What makes the XRP picture different is the derivatives side. Total open interest dropped from $909 million on March 17 to $722 million currently, a 20% decline. That contraction confirms the selloff was largely leverage-driven rather than spot-led.
Meanwhile, the total funding rate shifted from 0.0015% on March 17 to 0.009% now. Rising funding with falling open interest typically signals that new long positions are cautious and measured rather than the overleveraged bets that triggered the initial liquidation cascade.
 XRP Open Interest and Funding Rate: Santiment
Hodlers are adding. Leverage is resetting. The combination favors a bounce, but the XRP price chart determines whether it leads anywhere meaningful.
XRP Price Levels That Decide the Next Move
The first hurdle for any XRP price recovery sits at $1.45. A daily close above this level would confirm that the right shoulder has solidified itself around $1.37 and buyers are stepping in.
The more critical test arrives at $1.57, the 0.618 Fibonacci level, and a roughly 13% move from current prices. A break above $1.57 would put $1.63 (the 0.786 Fib) and ultimately $1.70 (the 1.0 Fib and neckline breakout confirmation) in play. Beyond $1.70, the measured move targets $1.91 and higher.
 XRP Price Analysis: TradingView
On the downside, $1.37 remains the immediate floor, supported by the 203 million XRP cost-basis cluster. A loss of this level exposes the 497 million XRP pocket near $1.28 to $1.29. If that zone also fails, the head at $1.26 becomes the last line of defense. A daily close below $1.26 kills the inverse head-and-shoulders and removes the structural basis for any bullish thesis.
For now, $1.37 separates a valid right shoulder formation from a pattern collapse toward $1.26 and below.
Recommended Articles


