


Bitcoin’s ‘Big Bad’ Revealed — Year-High Whale Metric Could Drive Price to $60,000
The Bitcoin price has traded almost flat over the past 24 hours, hovering near $67,600. But 30-day losses tell a different story. The price dropped roughly 27% month-on-month. This sudden intraday pause might not signal recovery. It could be a brief hold before the next leg down.
One of the strongest holder groups is flashing aggressive distribution signals. These patterns match historical setups that preceded sharp corrections. The danger is hiding in plain sight.
Bear Flag Breakdown and Year-High Whale Ratio Point to Historic Pattern
Bitcoin has already broken down from a bear flag pattern. The structure carried approximately 40% crash risk from the breakdown point. The pattern itself looks weak. But something much bigger appeared alongside it.
The Exchange Whale Ratio spiked to 0.81 on February 14. That marked the highest reading in a year. This metric tracks the ratio of the top 10 whale inflows to total exchange inflows.
History shows this pattern repeating with scary precision. In March 2025, the ratio hit 0.62 when Bitcoin traded around $84,100. Price then surged roughly 3.7% to $87,200 within a week as whales front-ran the move. But by early April, Bitcoin crashed approximately 12.6% to $76,200 as distribution began.
The same thing happened in November. The ratio spiked to 0.70 when the price sat near $88,400. Bitcoin rallied about 5.2% to $93,000 and then collapsed roughly 7.4% to $86,000 by mid-December. The pattern is clear. Whales position early, price rises briefly, then heavy selling begins.
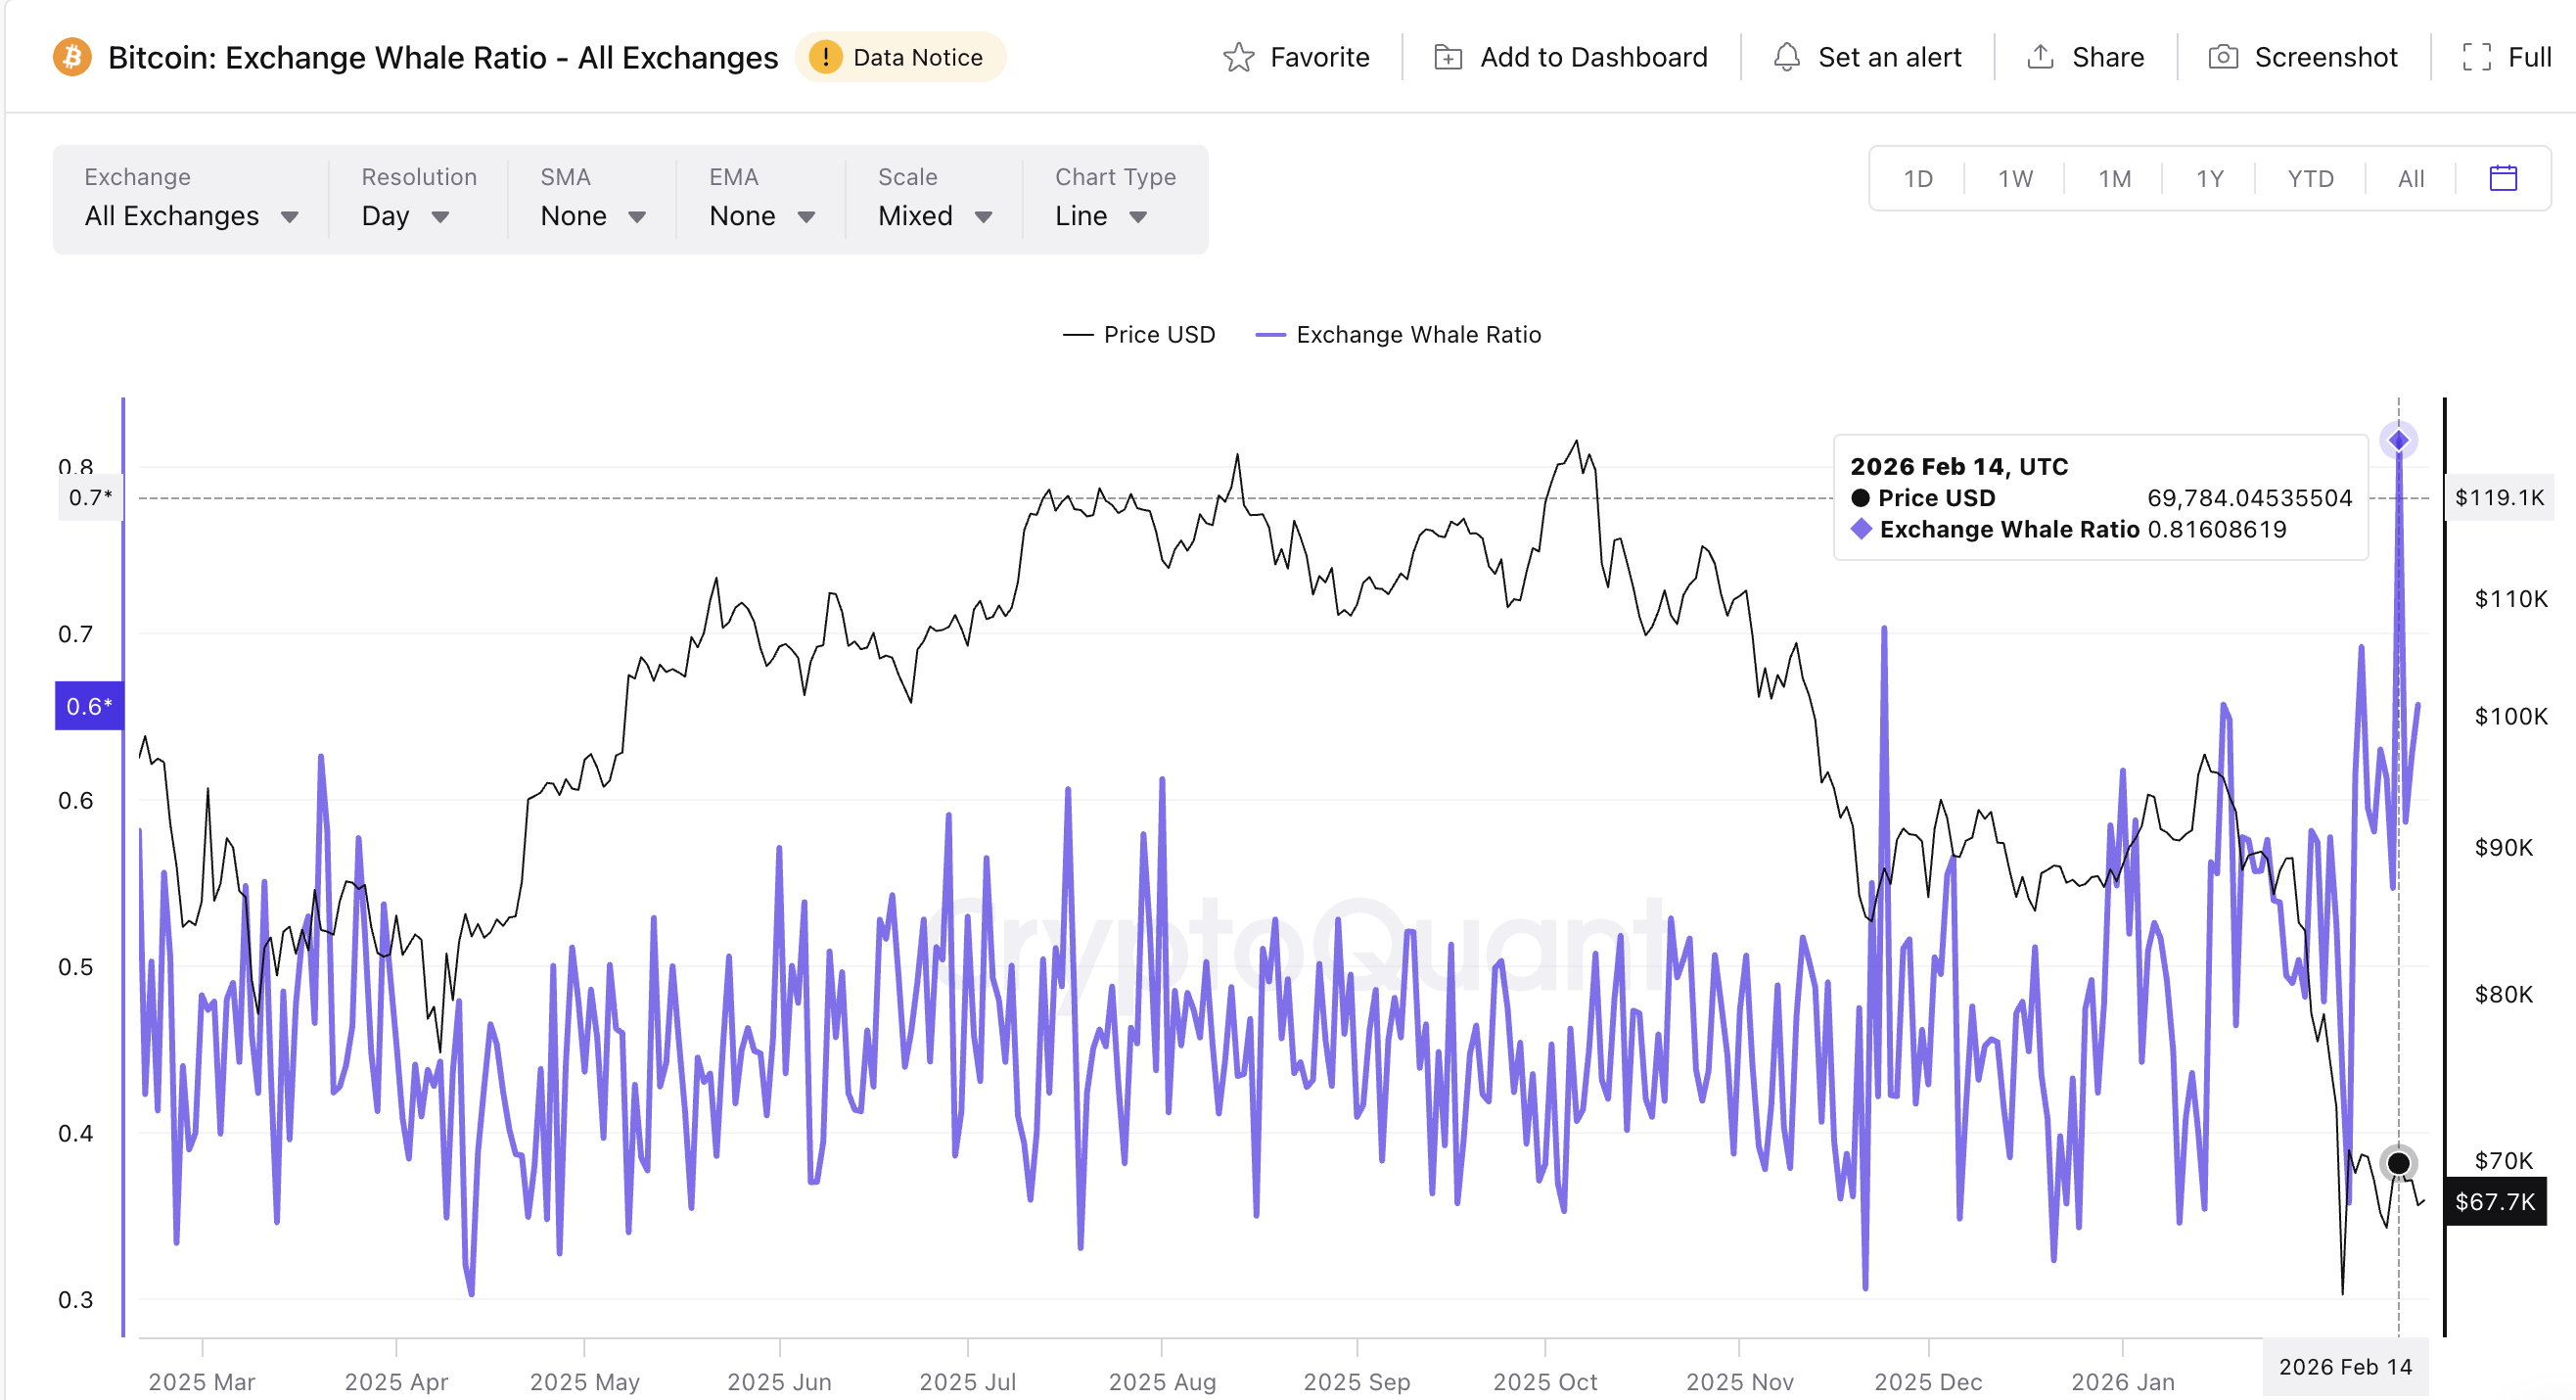 Exchange-Whale Ratio: CryptoQuant
Now the ratio hit 0.81 in mid-February when Bitcoin traded near $69,700. That’s the highest whale-metric spike in 12 months. Price already started falling and currently sits around $67,000. But the ratio remains elevated at 0.65.
That level still sits in the historical profit-booking zone based on past corrections. Therefore, another quick BTC price bounce followed by a deeper correction might not be discounted.
A hidden bearish divergence formed on the 12-hour chart between February 8 and February 16. Price made a lower high during this period. The Relative Strength Index (RSI), a momentum indicator, simultaneously made a higher high. This combination signals pullback continuation rather than reversal.
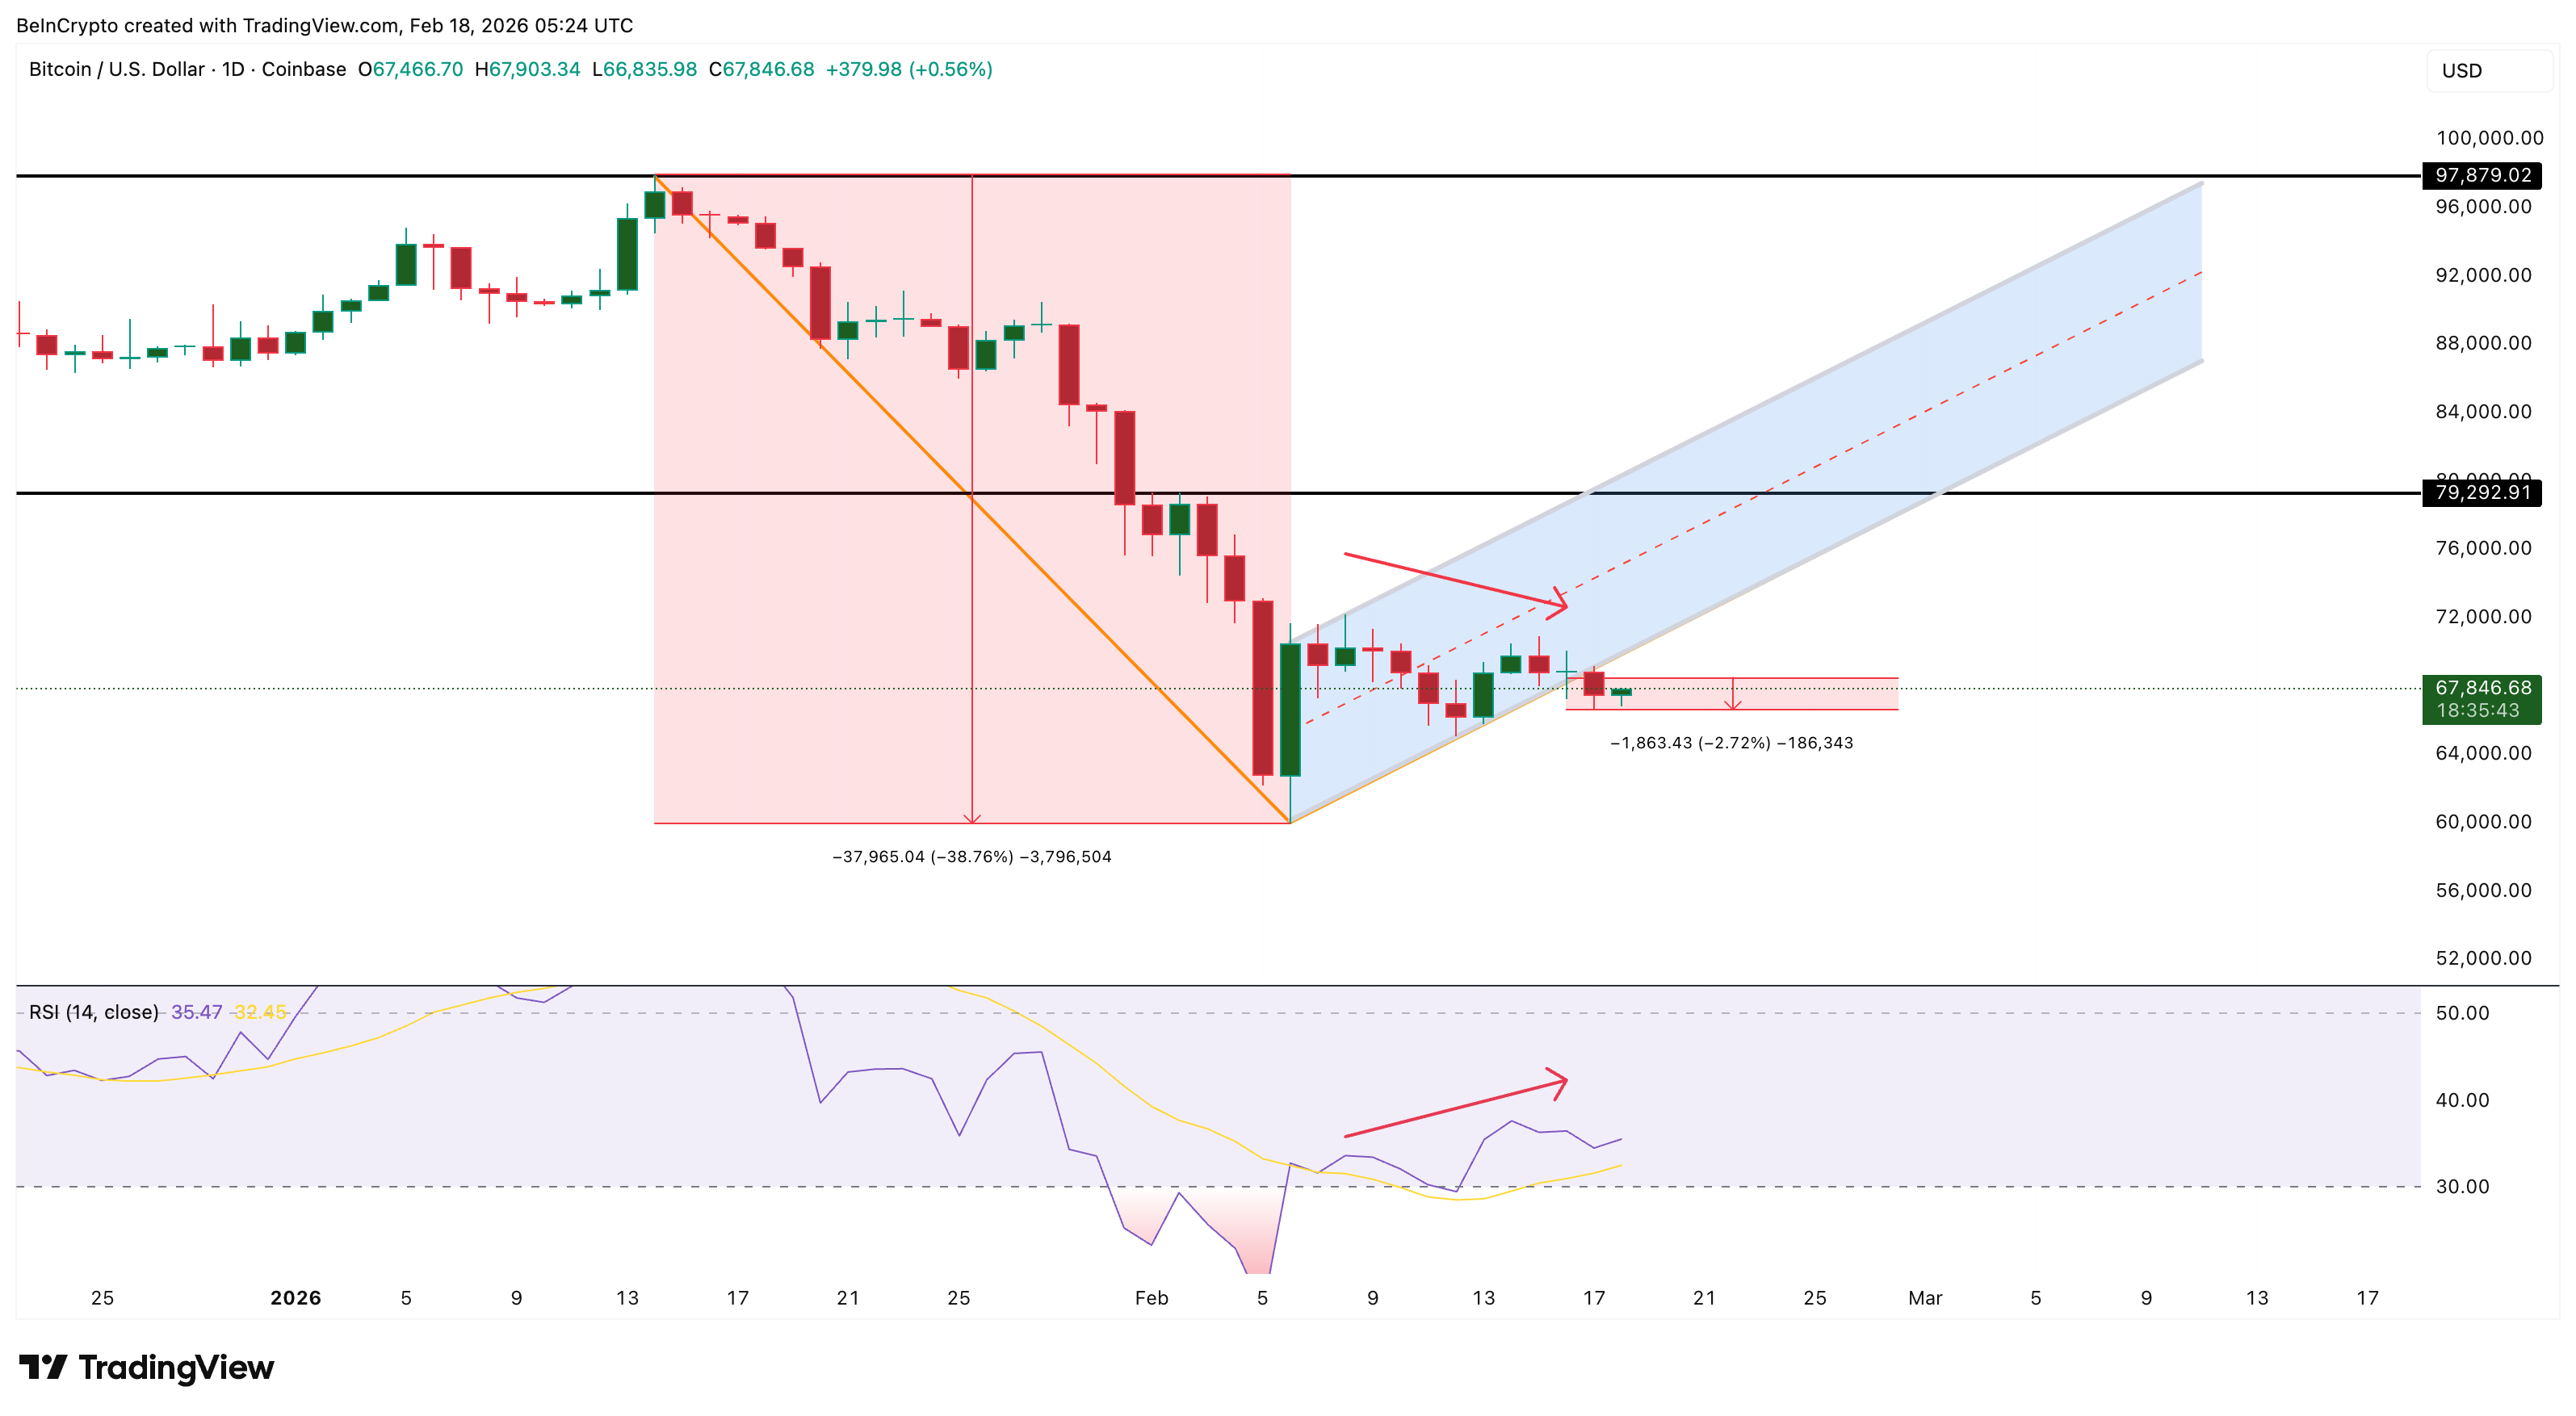 Bitcoin RSI Risk Flashes: TradingView
All three signals point toward deeper correction. But why blame whales specifically for this weakness?
Whale Addresses Drop as Strongest Supply Cluster Comes Into Focus
Some might argue the Exchange Whale Ratio spiked because total exchange inflows dropped. But actual whale address counts prove otherwise.
Whale addresses holding 1,000 BTC or more dropped from 1,959 on January 22 to 1,939 currently. That’s a loss of 20 whale addresses during the correction. These holders didn’t disappear randomly. They distributed holdings while the price fell. The addresses dropped alongside the price decline. They didn’t buy the dip. They created the dip.
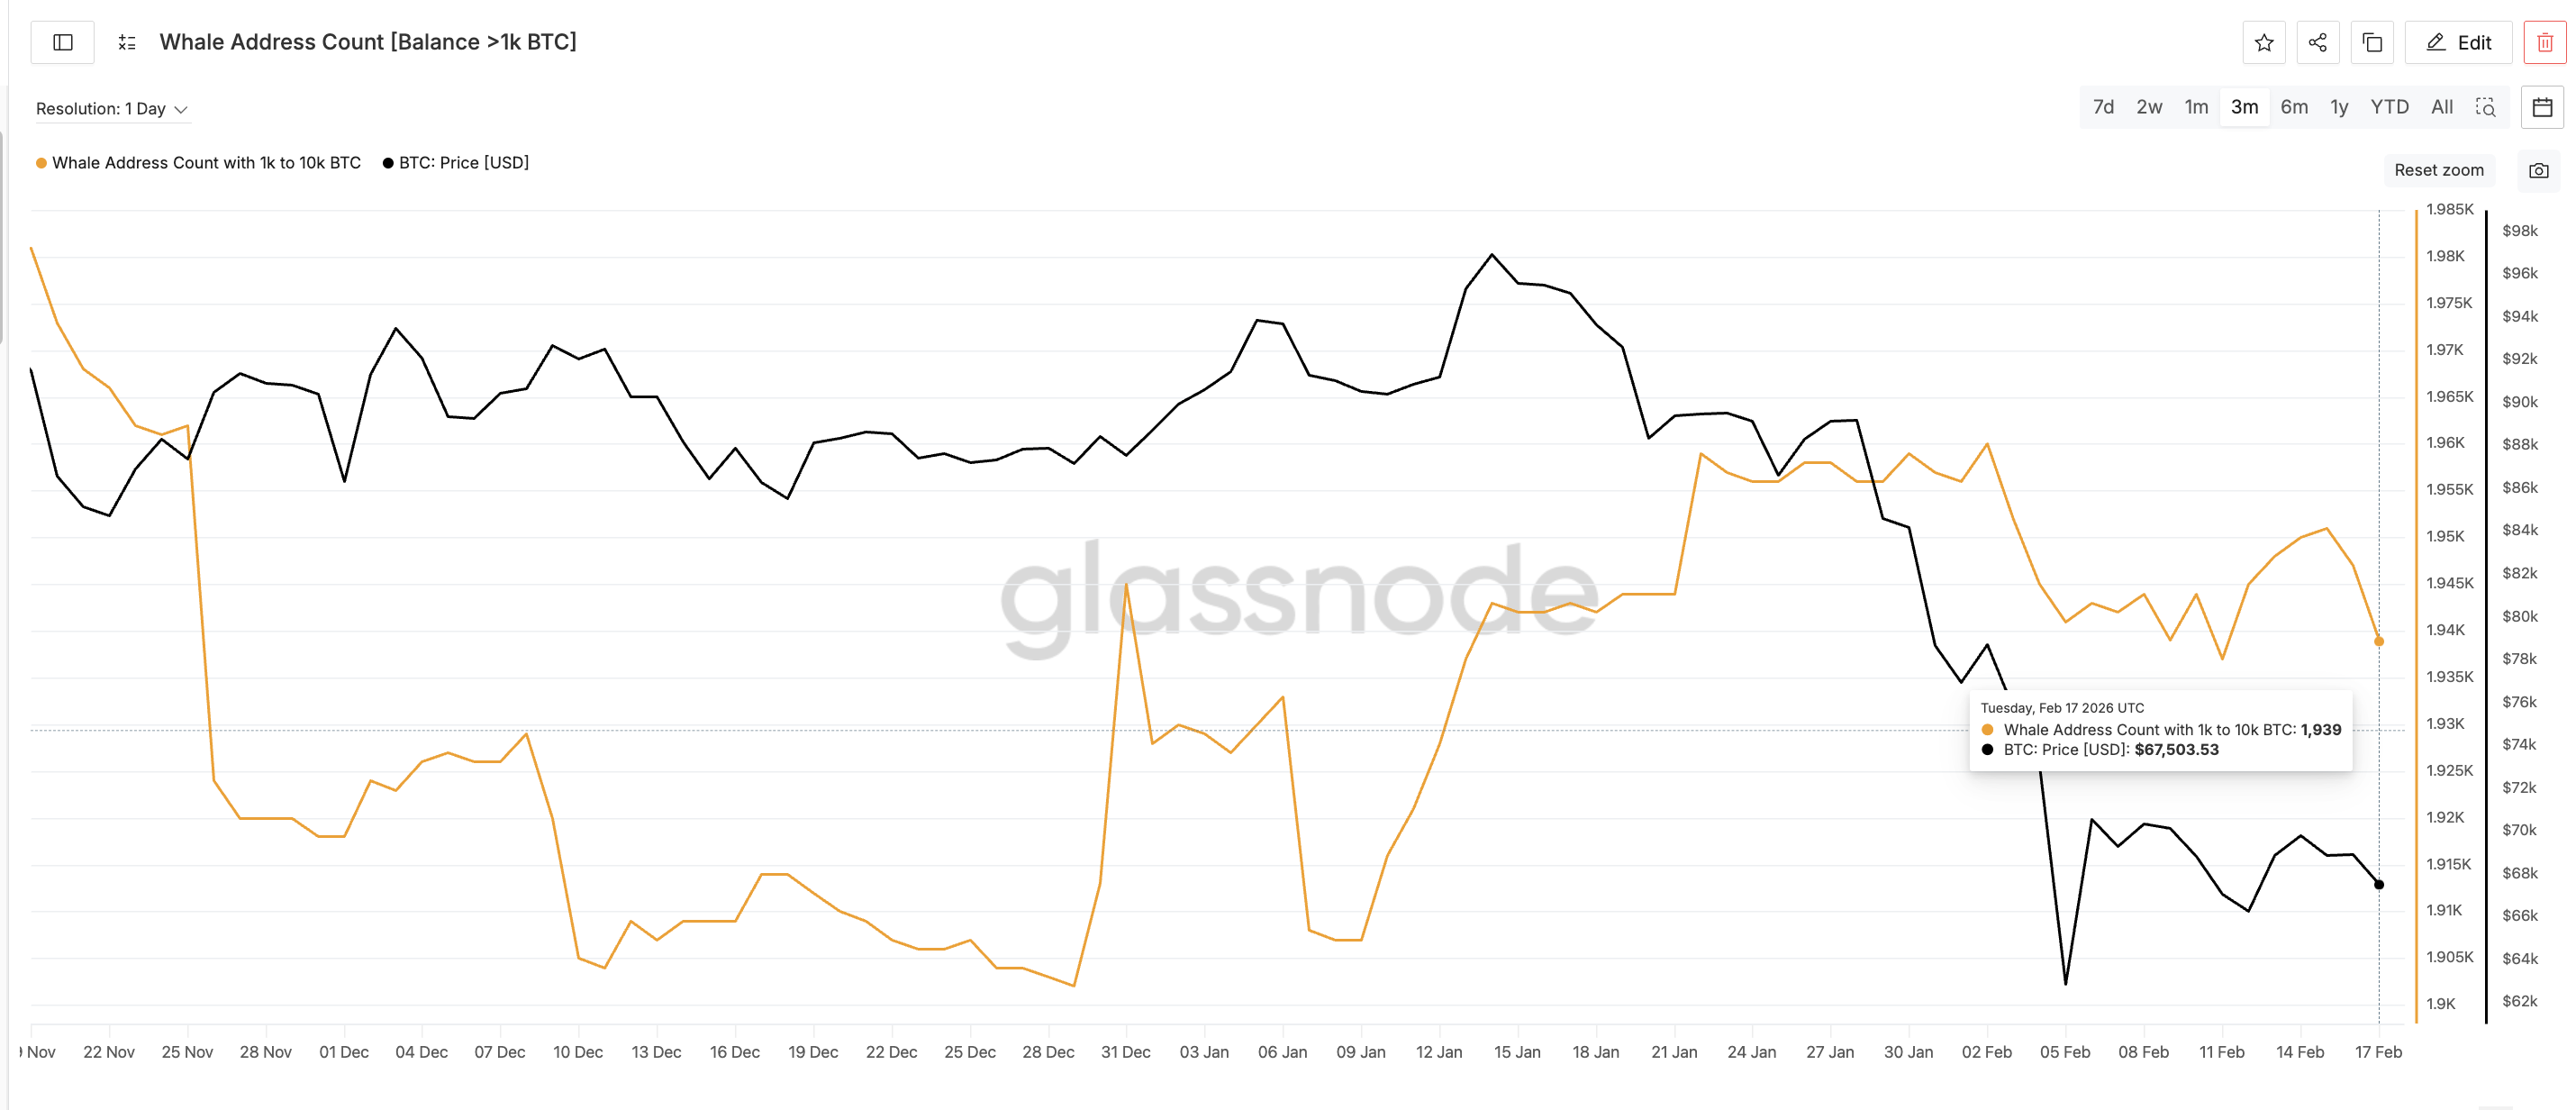 Whales Keep Dropping Stash: Glassnode
Want more token insights like this? Sign up for Editor Harsh Notariya’s Daily Crypto Newsletter here.
The pattern shows whales rode price rebounds temporarily, then sold during corrections. Their conviction is weak. When strong holders accumulate during weakness, it creates buying pressure. When they distribute during weakness, it accelerates the decline. Bitcoin’s 27% monthly drop makes sense when you see 20 whale addresses or at least 20,000 BTC exiting.
But the real danger emerges when looking at where supply is concentrated. UTXO Realized Price Distribution shows cost basis clusters across the market. It reveals price levels where the most supply was created. These zones act as strong support or resistance depending on market direction.
The strongest current cluster sits near $66,800. This level holds maximum supply concentration under the current price. It represents the biggest cost basis zone in the near term. Breaking through requires massive selling pressure. Retail traders don’t have the size to push through such a thick supply. Only whales possess that firepower, making them the possible ‘Big Bad’ for the Bitcoin price.
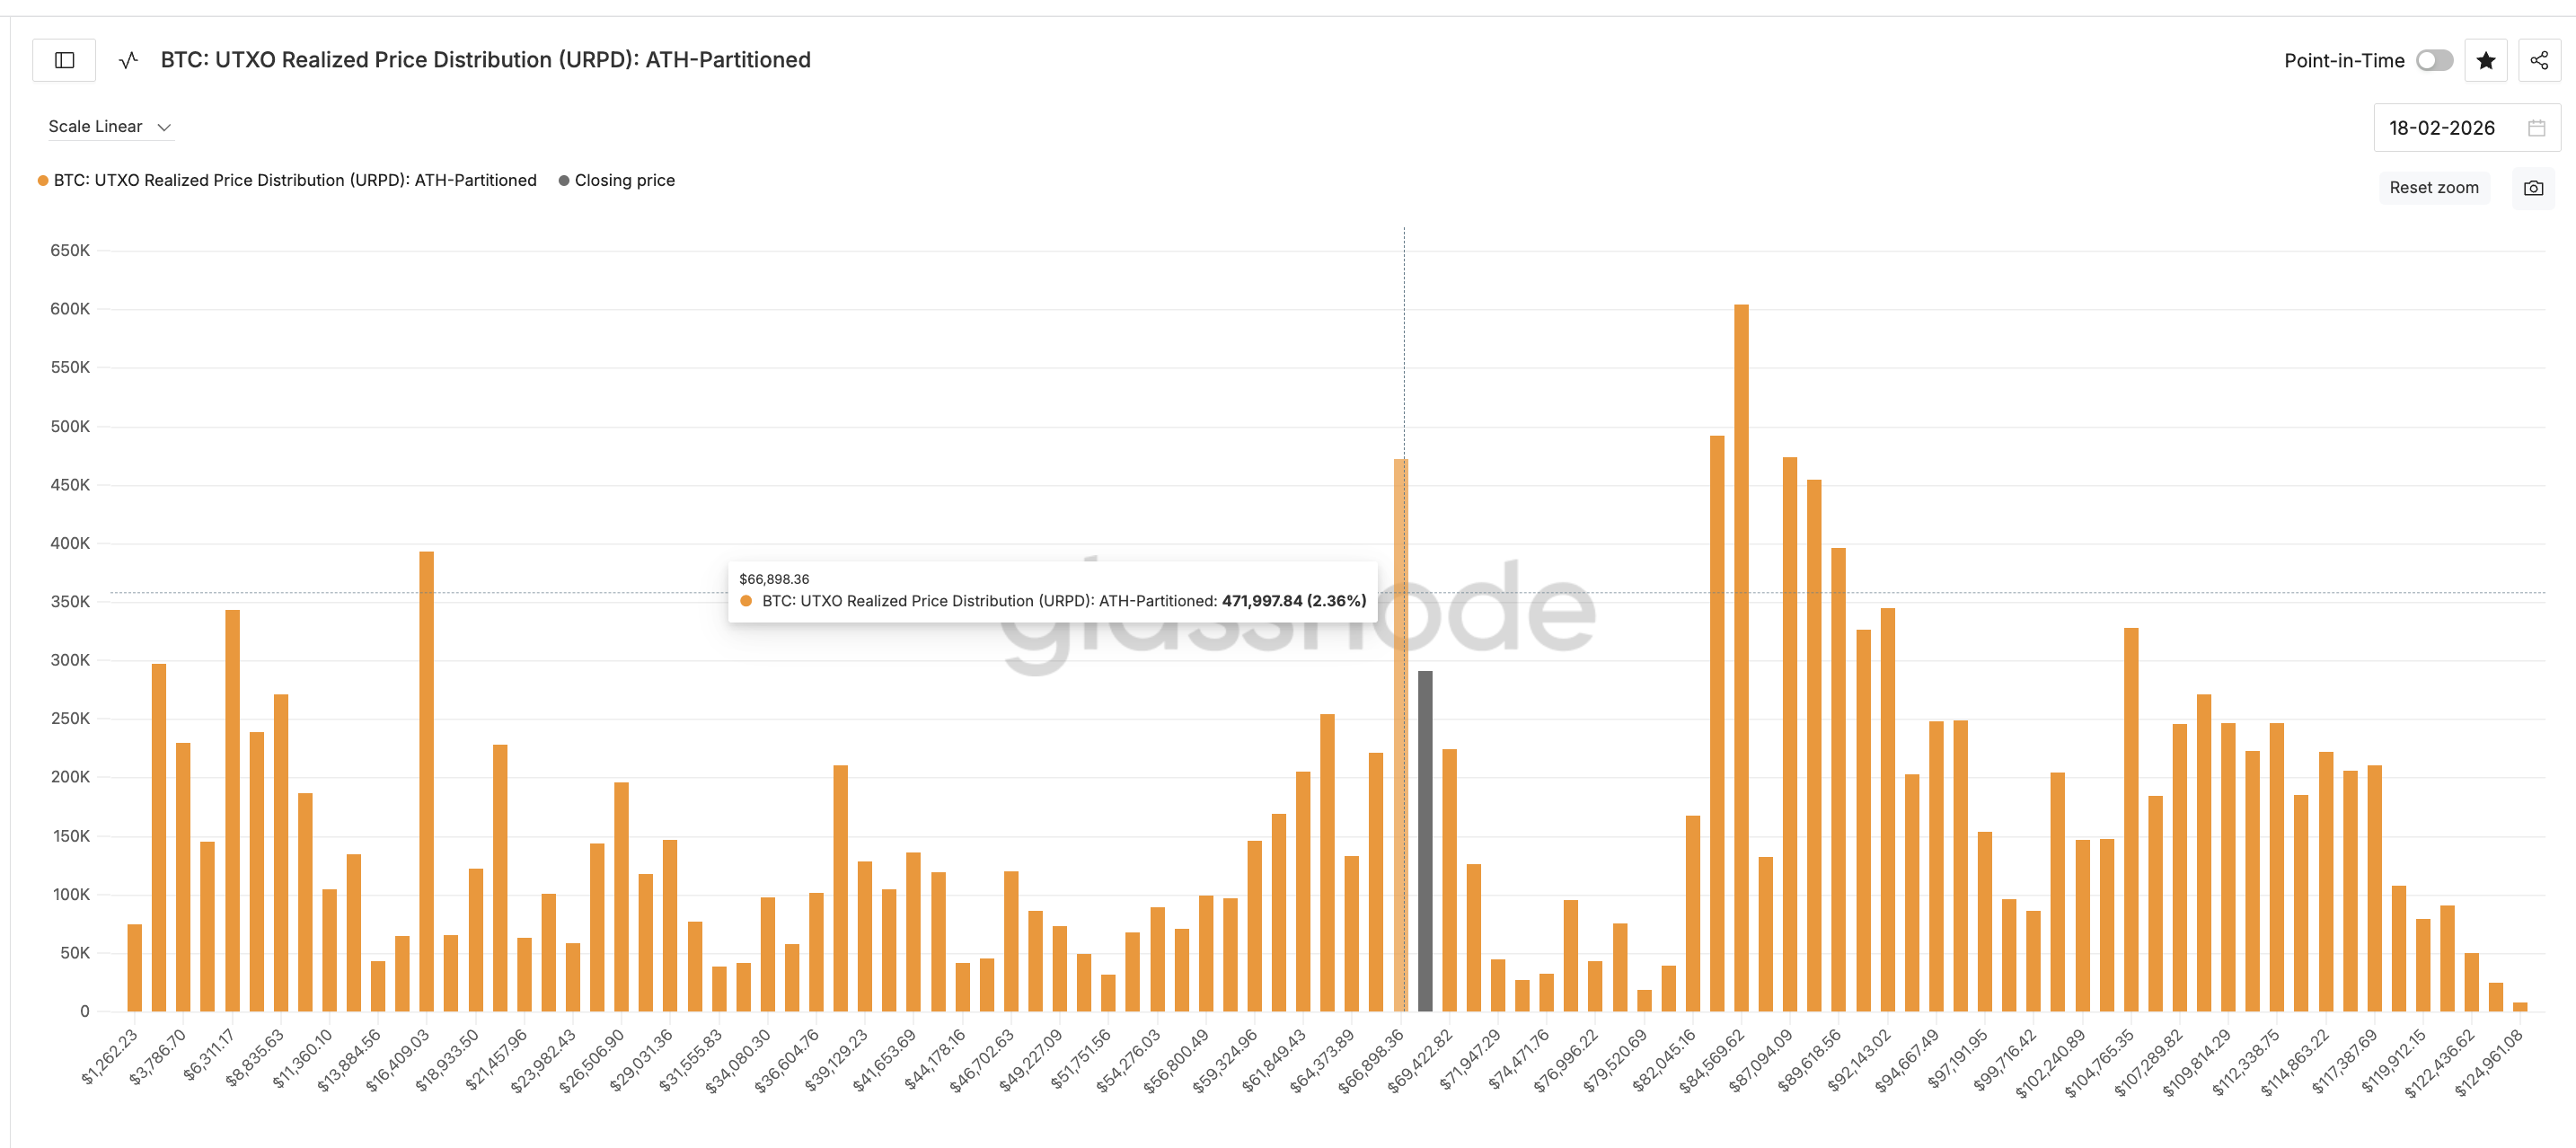 Key Price Clusters: Glassnode
Here’s the problem. Those same whales are already distributing. The Exchange Whale Ratio proved it. The address count drop confirmed it. They’re actively selling into the market. The current price near $67,600 sits dangerously close to that $66,800 cluster.
Critical Bitcoin Price Support Holds Key to $60,000 Crash Risk
The first major support level sits at $66,600. This aligns closely with the $66,800 URPD cluster. Both levels represent the same technical and supply-based zone. Bitcoin currently trades just 1.6% above this critical support. If whales continue distributing this level won’t hold long.
A break below $66,600 opens the path toward $60,000. That represents approximately 12% additional downside from current levels. Bitcoin briefly touched this zone on February 6 before bouncing. But the setup now looks much weaker than it did then. The whale ratio wasn’t at yearly highs. Hidden bearish divergence hadn’t formed yet.
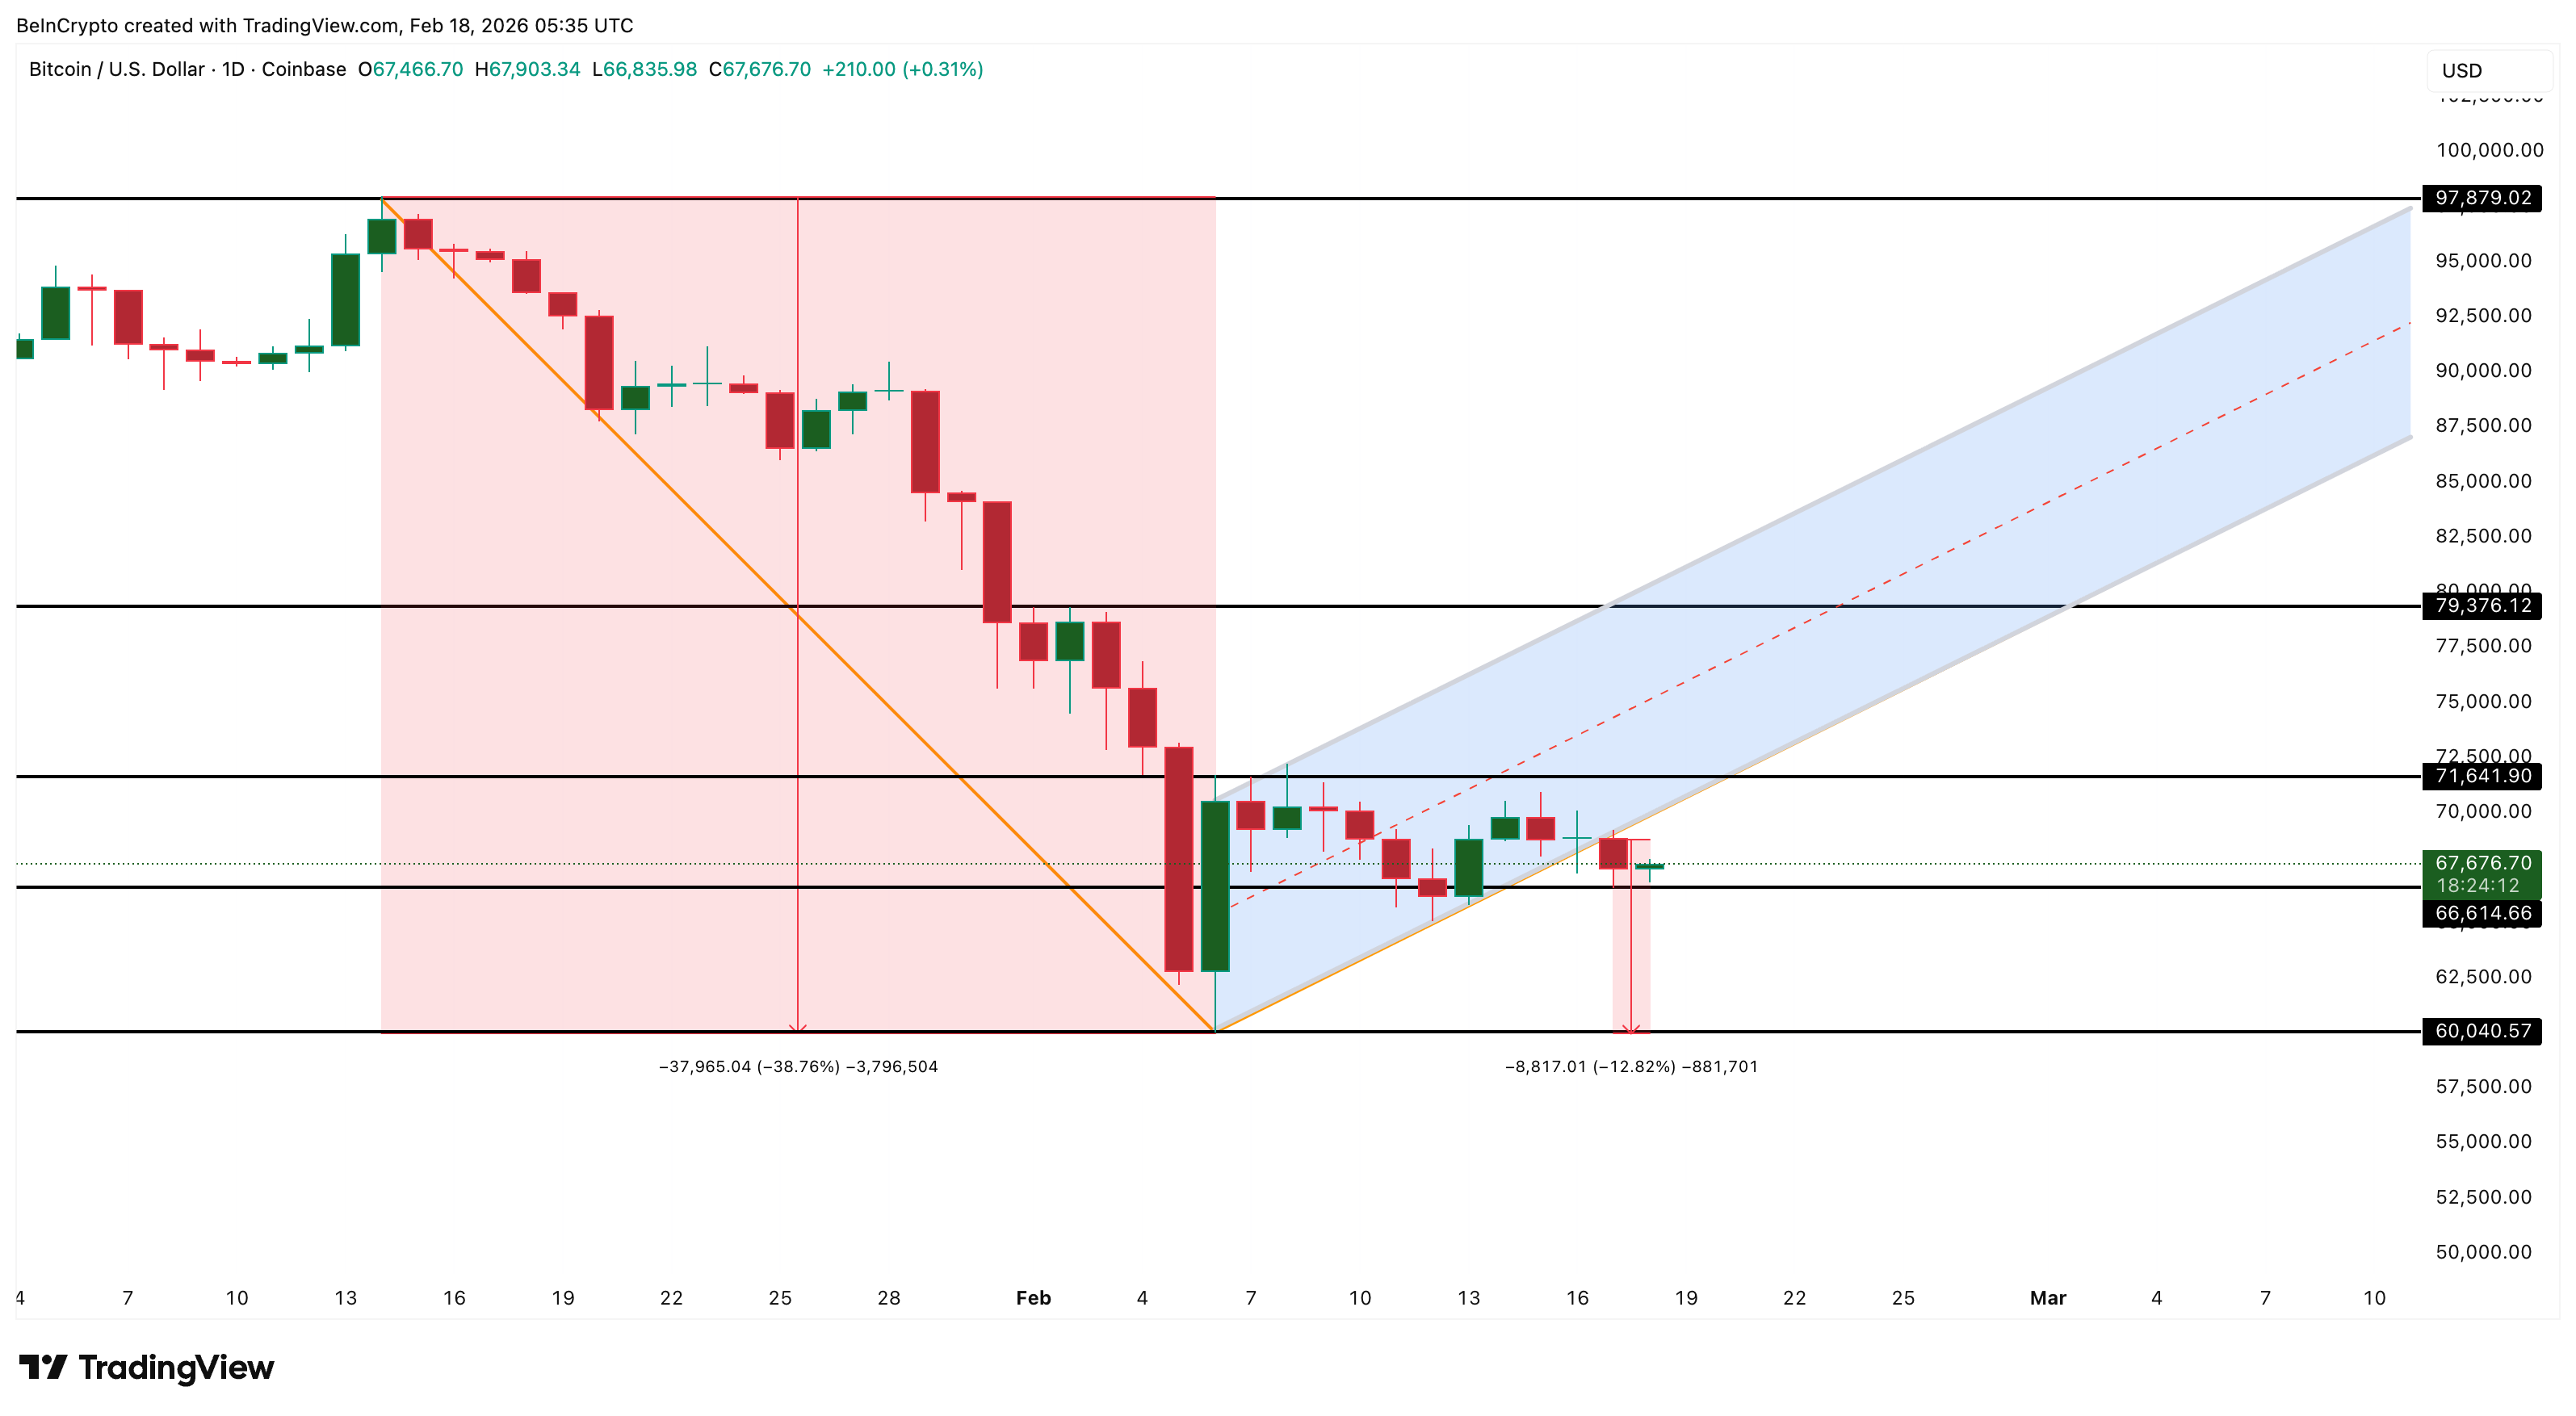 Bitcoin Price Analysis: TradingView
Now all those warnings flash simultaneously while the price hovers just above the strongest supply cluster. Breaking $66,600 would likely trigger cascade selling as the URPD zone fails. Holders sitting at the cost basis near $66,800 would panic. Leveraged longs positioned for recovery would get liquidated. The move toward $60,000 could happen faster than the initial breakdown.
On the upside, Bitcoin needs a clean break above $71,600 to show any real strength. That would invalidate the immediate bearish structure and suggest buyers are regaining control. Full pattern invalidation only happens above $79,300. Until Bitcoin reclaims that level, the bear flag breakdown remains active, and downside risk dominates.
Recommended Articles


