


Is the HYPE Fading? Hyperliquid’s 25% Rally Faces a Reality Check
Hyperliquid has emerged as one of the strongest performers in the crypto market. While Bitcoin is down nearly 28% and Ethereum has fallen around 40%, HYPE is up about 25% over the past month and nearly 10% in seven days. Even in the latest session, the Hyperliquid price has gained close to 3%.
However, behind this outperformance, multiple technical and derivatives indicators suggest that the rally may be losing internal strength. Failed breakouts, weakening volume, and rising leverage risks are now putting the sustainability of Hyperliquid’s move under pressure.
Buying Strength Weakens As Sellers Come Back Into Play
Despite recent price strength, spot market participation is starting to weaken.
On the daily chart, HYPE recently pushed toward the $36 zone but failed to sustain the bull flag breakout. The latest candle printed a long upper wick near this level, showing that sellers stepped in aggressively. This rejection indicates a growing supply (sellers) at higher prices.
At the same time, On-Balance Volume (OBV) has been trending lower between January 28 and February 5, even as the price continued moving higher. OBV is a volume-based indicator that tracks buying and selling pressure.
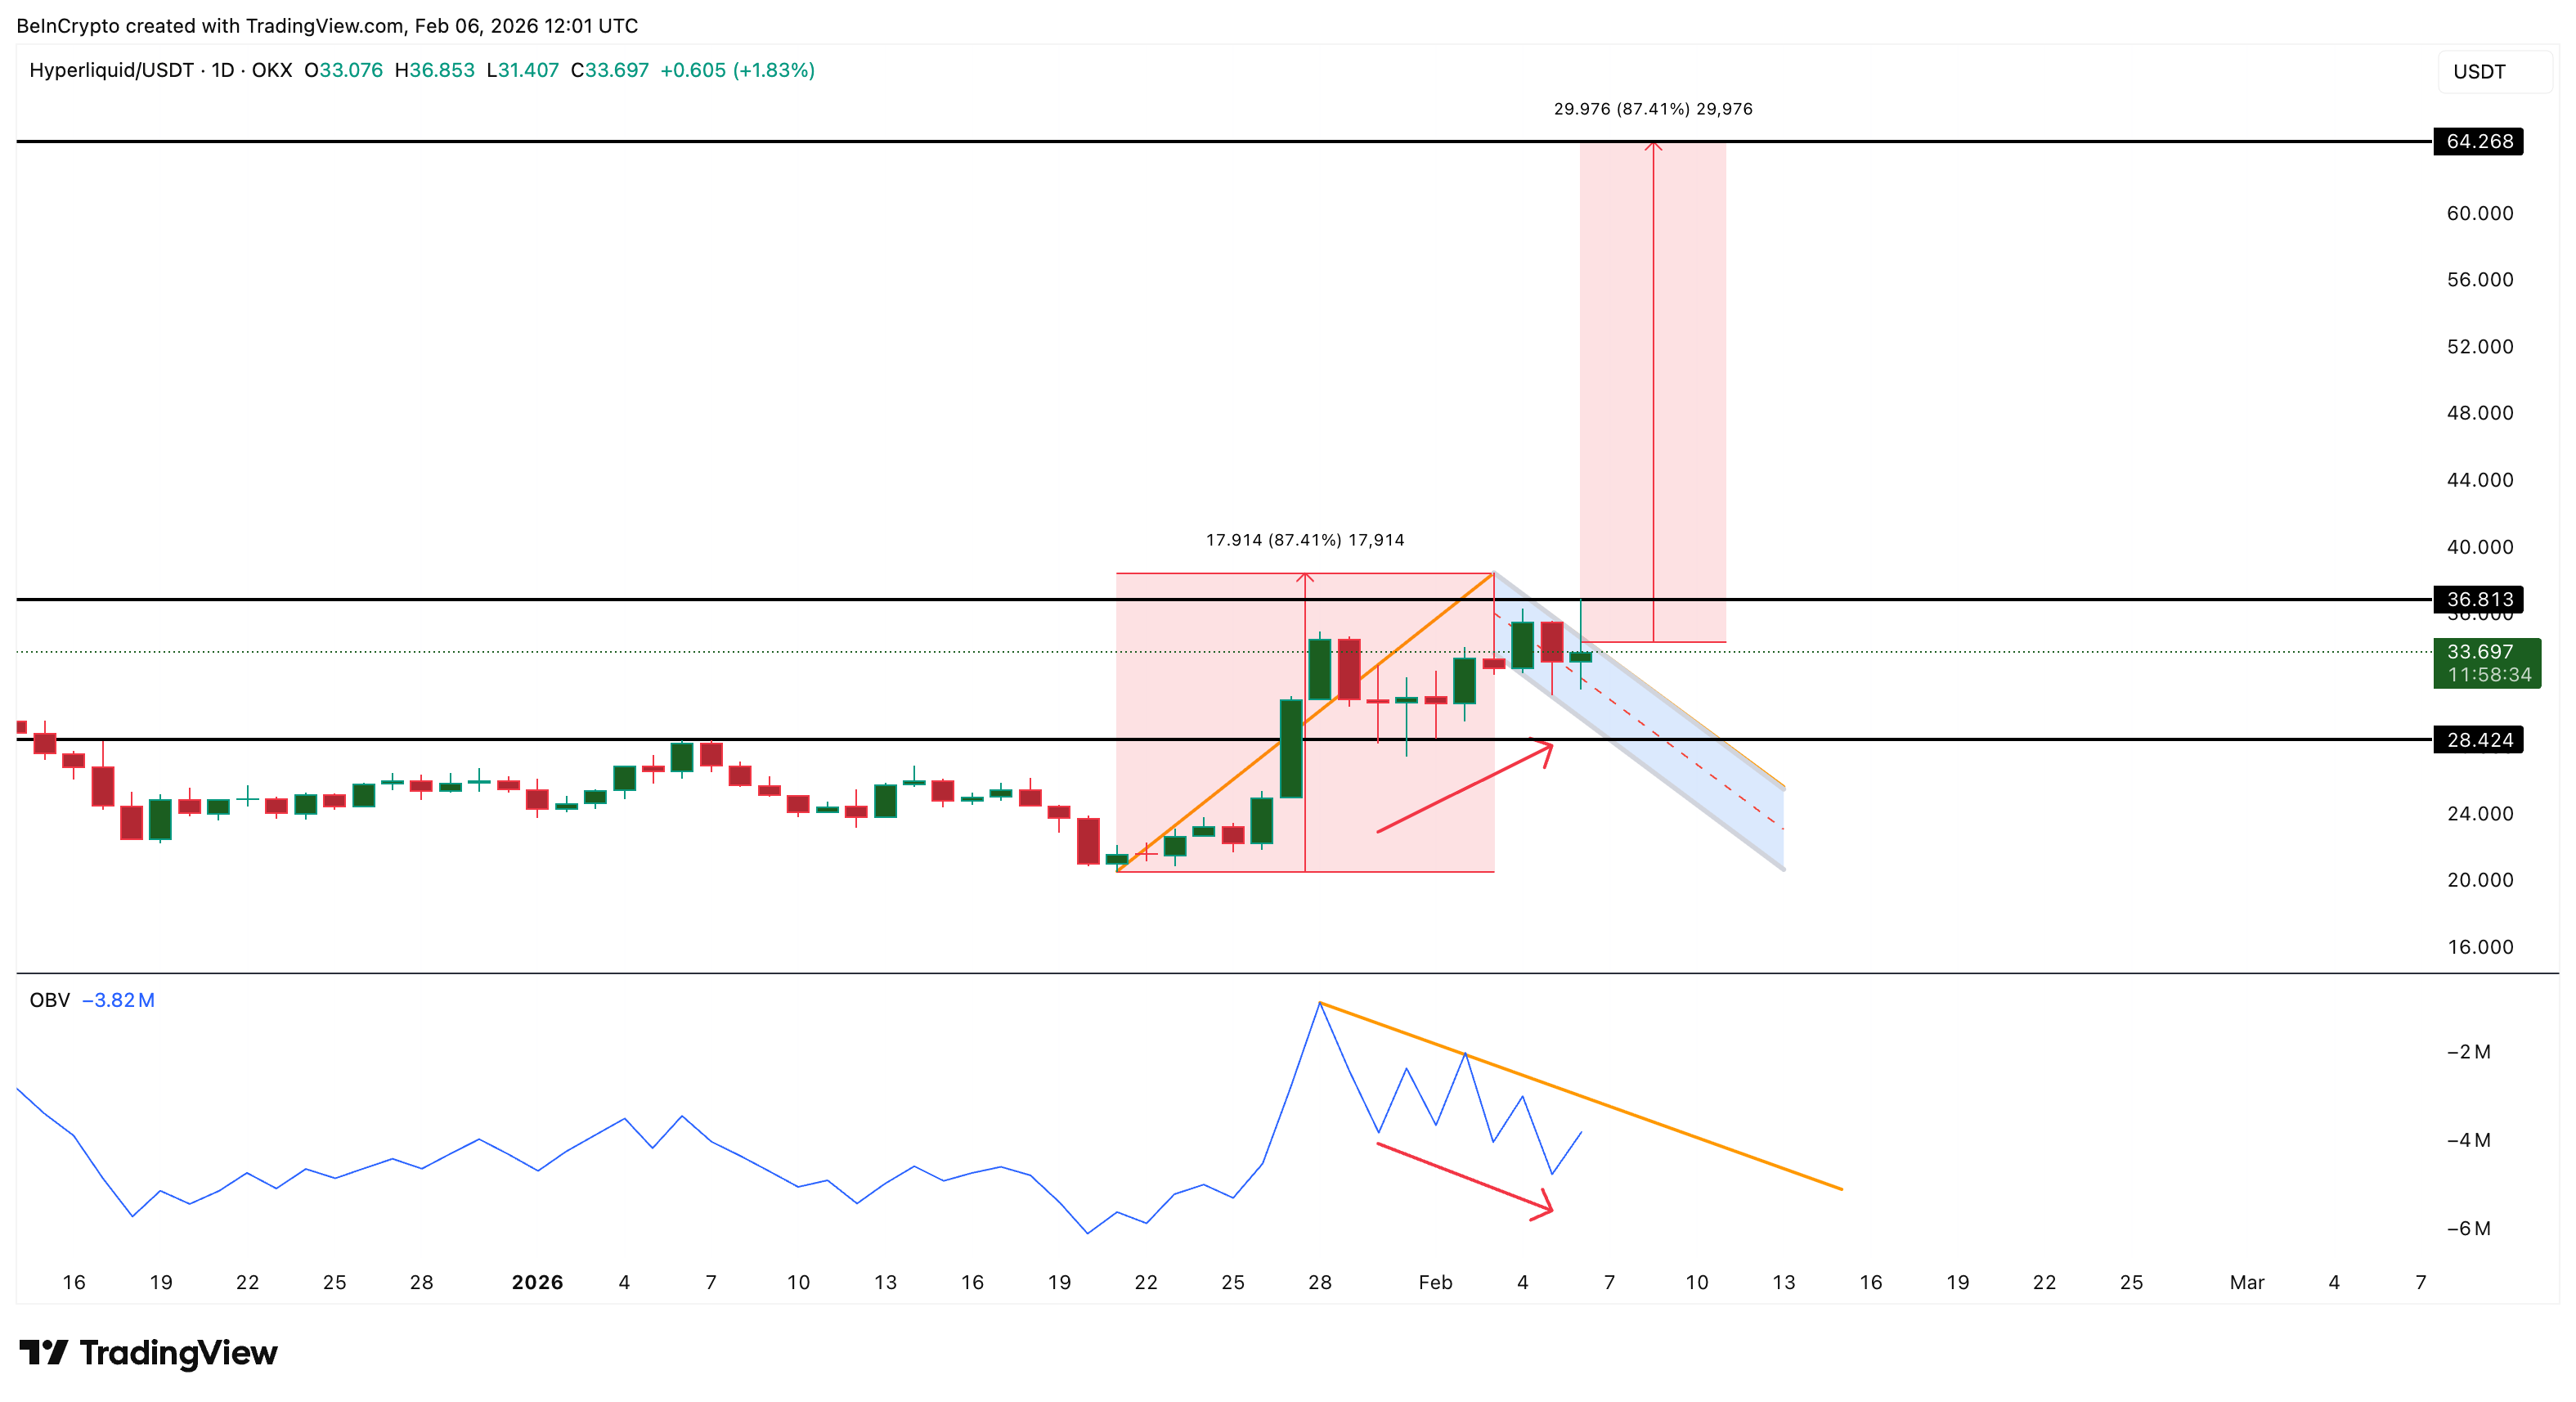 Weakening OBV: TradingView
Want more token insights like this? Sign up for Editor Harsh Notariya’s Daily Crypto Newsletter here.
This divergence suggests that fewer spot buyers are supporting the rally. In simple terms, price is rising, but real demand is fading. Momentum indicators are flashing similar warnings.
Between January 28 and February 4, the Hyperliquid price formed a higher high, while the Relative Strength Index (RSI), a momentum indicator, printed a lower high. This bearish divergence, sellers gaining control, was followed by a drop toward $31 before buyers returned.
A similar structure is now forming again. Price is attempting to push higher, but RSI is failing to confirm the move and is shaping another lower high. This divergence is not yet fully confirmed. However, if the next daily candle forms below $36, the pattern would be validated.
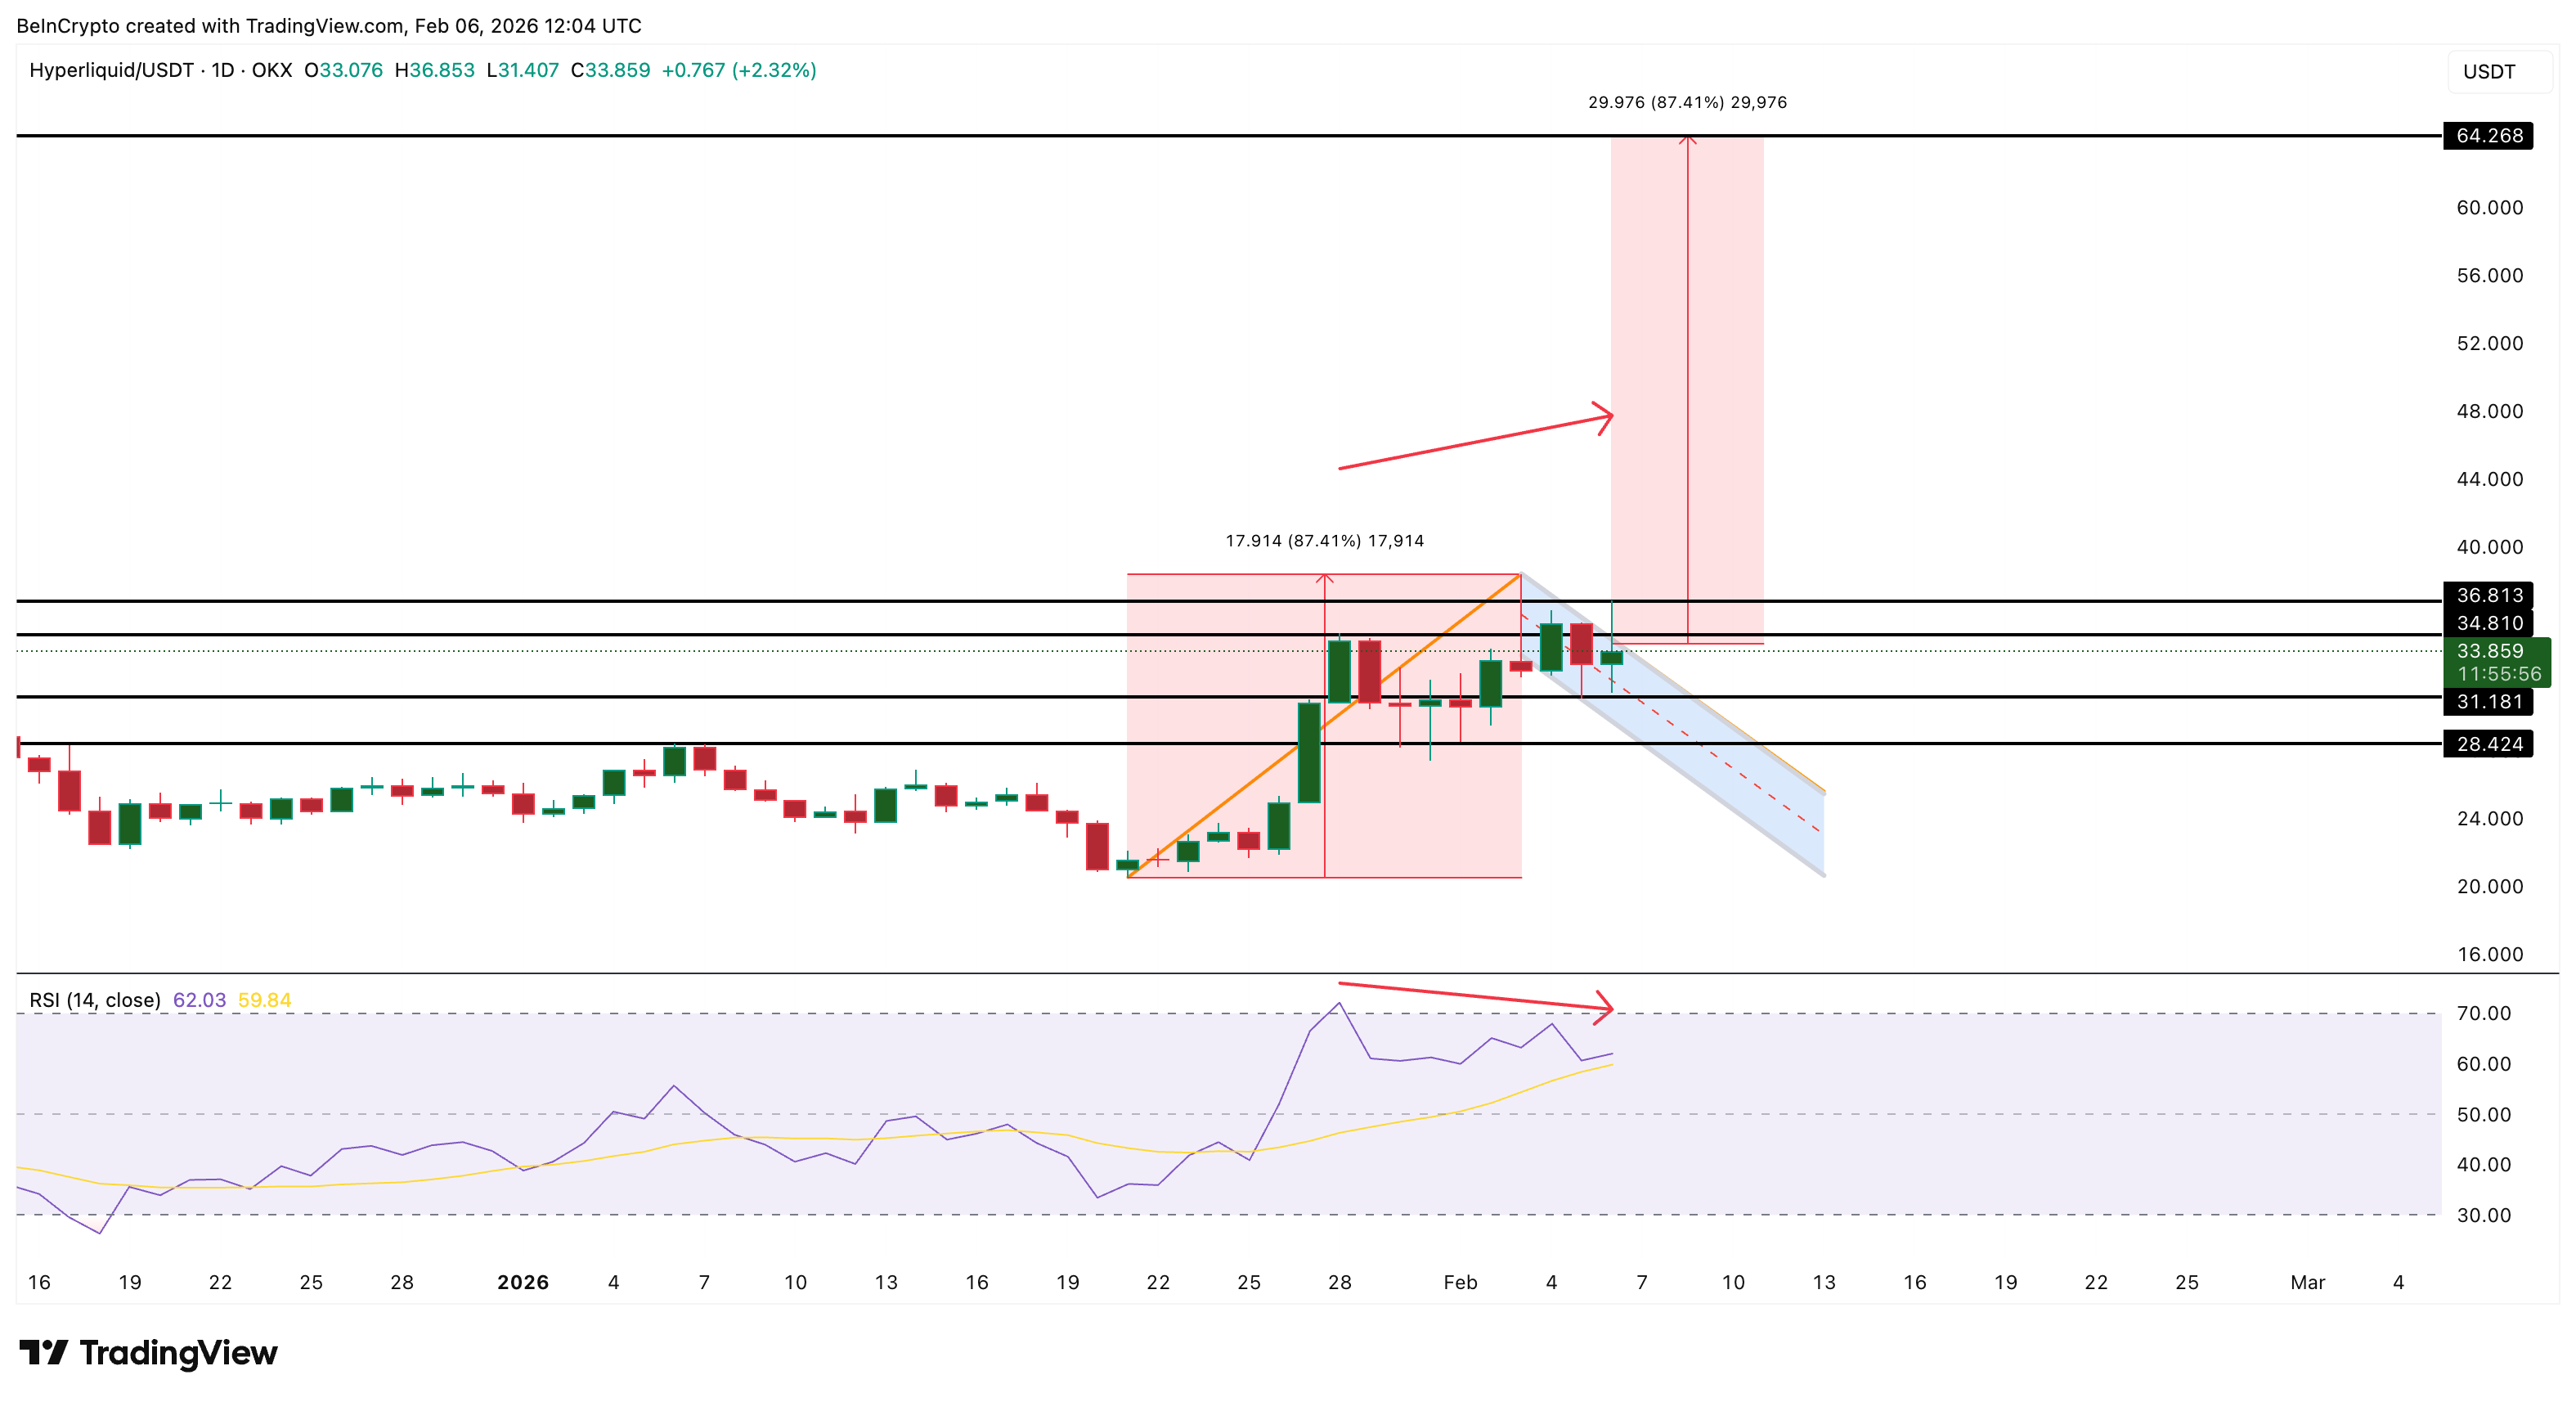 Bearish Divergence Forming: TradingView
When weakening OBV aligns with bearish RSI divergence and repeated rejections near resistance, it often signals that upside momentum is slowing.
Derivatives Positioning Is Tilted Heavily Toward Longs
While spot buying is weakening, leverage exposure is moving in the opposite direction.
Data from Bybit alone shows that long positions on HYPE perpetual contracts stand near $17.1 million, while short positions remain around $10.7 million. This represents a roughly 60% skew toward longs. Such positioning creates structural vulnerability.
When most traders are on the same side, even a small correction can trigger forced liquidations. These liquidations often accelerate selling pressure and turn minor pullbacks into deeper drops. This risk is amplified by the current technical setup.
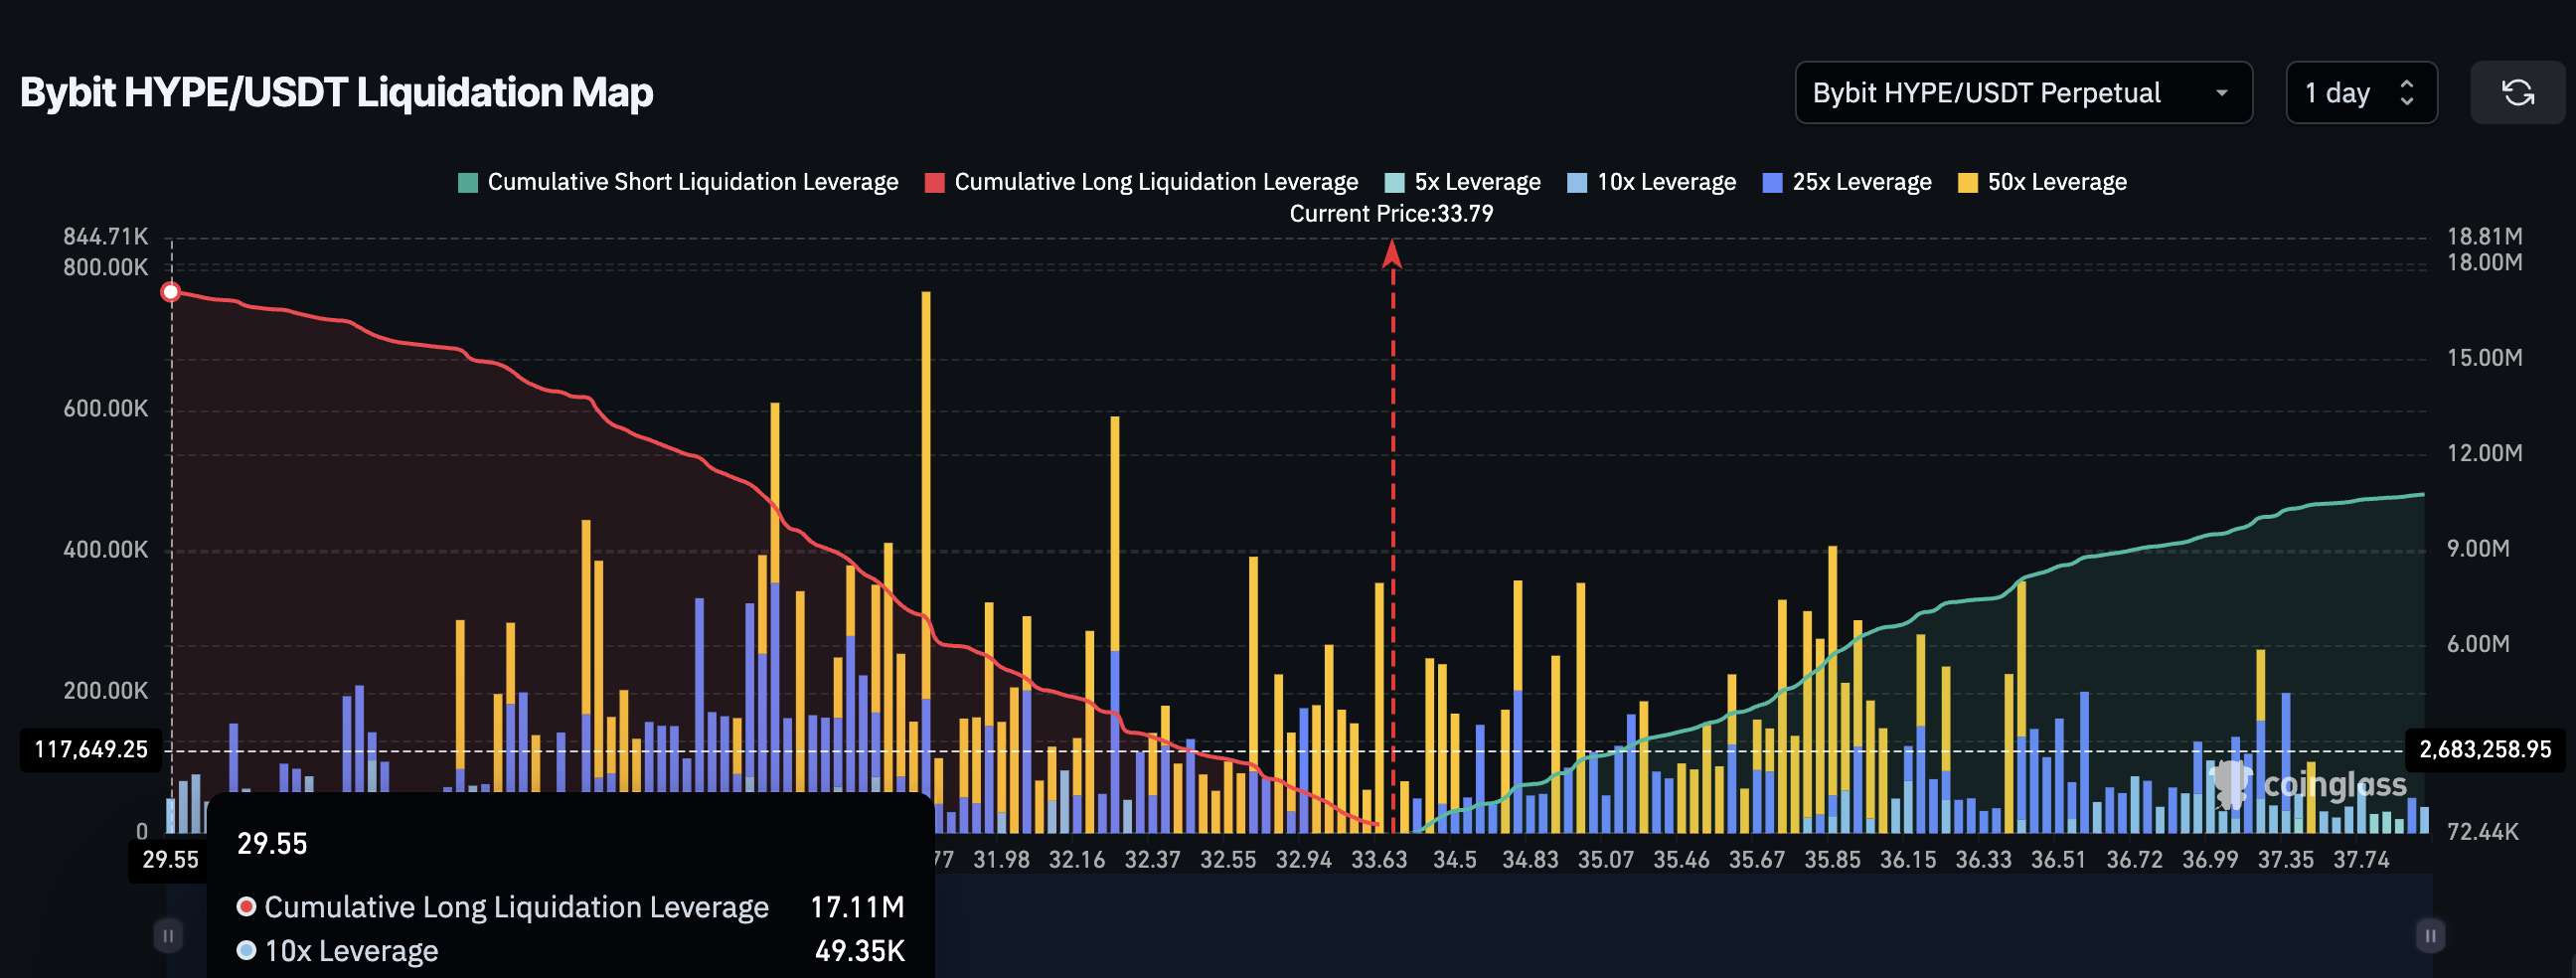 HYPE Liquidation Map: Coinglass
If the bearish RSI divergence plays out and price begins slipping below resistance, overleveraged long positions may go out of the picture. Crypto markets have repeatedly shown that long-heavy environments are prone to sudden downside cascades.
In Hyperliquid’s case, leverage is rising while momentum weakens, an unstable combination.
Hyperliquid Price Levels To Track Now
All technical and derivatives signals now converge around a few critical levels. On the upside, Hyperliquid (HYPE) must first reclaim $37 on a sustained daily closing basis. A clean break above this level would invalidate the current weakness and restore bullish momentum.
If $37 is reclaimed, the next resistance sits near $42. Clearing this zone would strengthen the trend and reopen the path toward the $60–$64 region, based on Fibonacci extensions and rally projections.
However, downside risks remain significant. The $28 level is now the most important structural support.
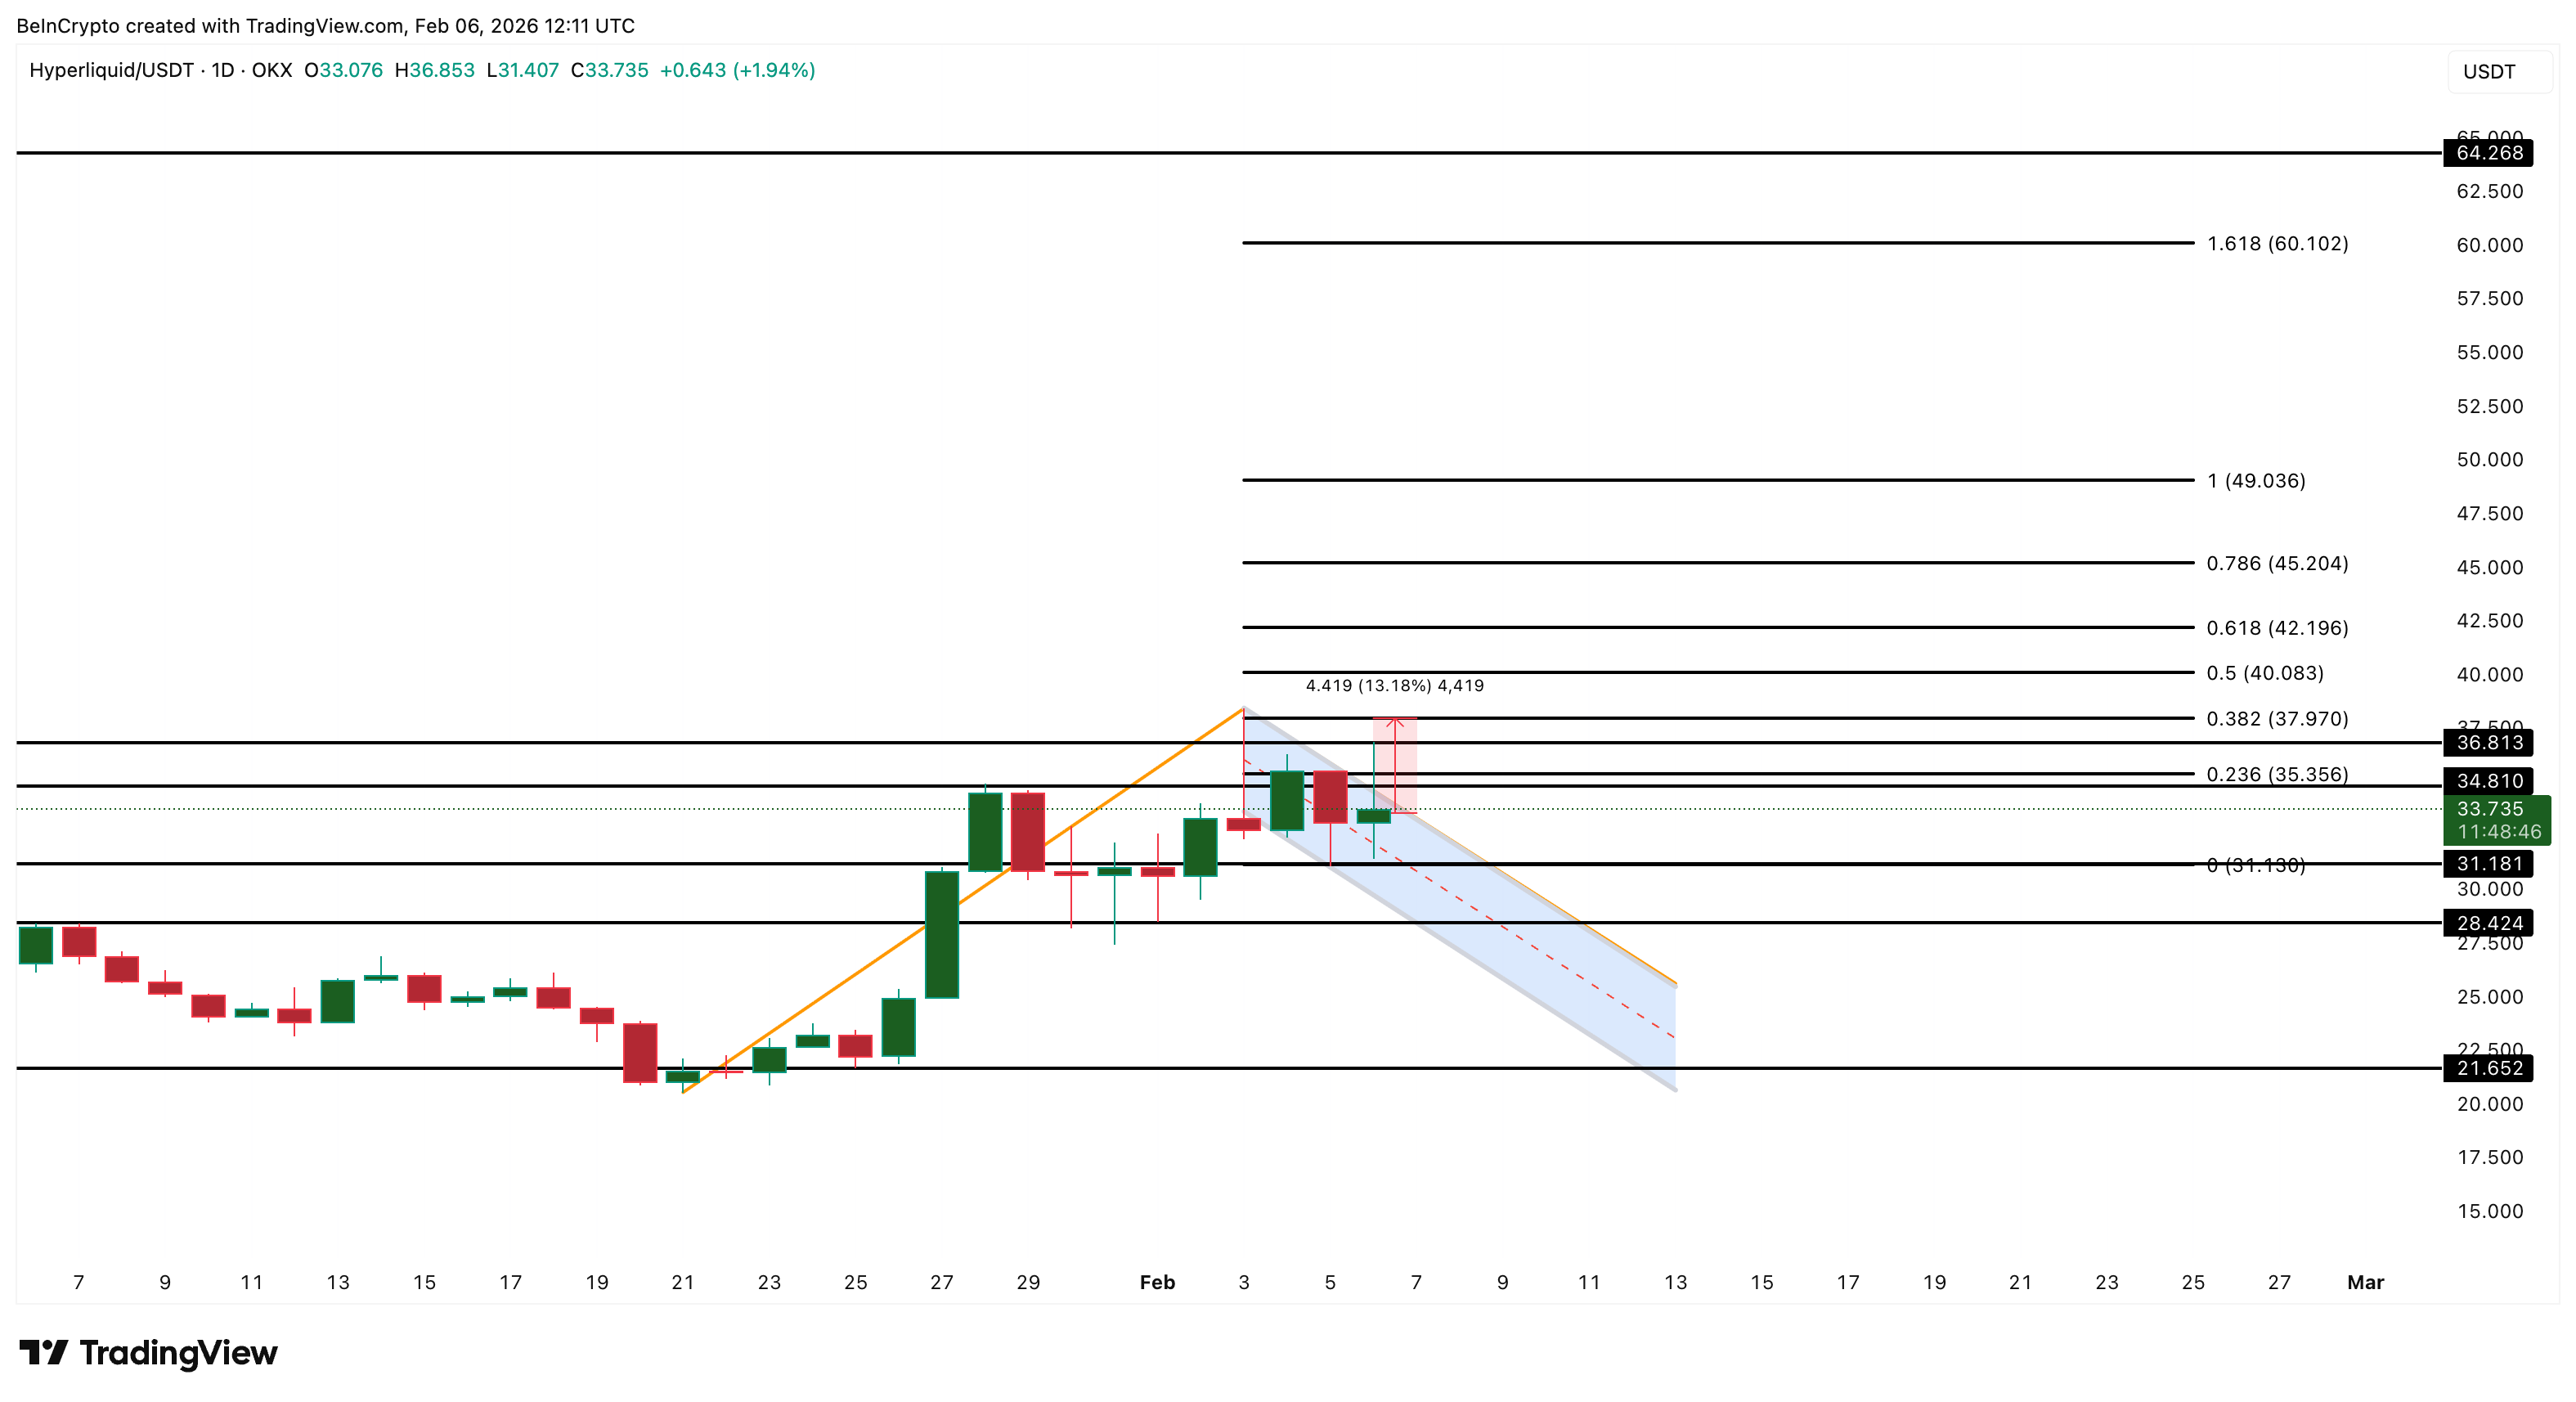 Hyperliquid Price Analysis: TradingView
A daily close below $28 would weaken the bullish structure and likely trigger a broad-based long liquidation, per the HYPE/USDT liquidation map. In that scenario, price could slide quickly toward the $21 region, where deeper support is located.
Given the combination of fading volume, bearish momentum signals, and long-heavy positioning, $28 has become the line separating Hyperliquid price continuation from breakdown.
Recommended Articles


