


Crypto Today: Bitcoin, Ethereum, XRP start week in red, no recovery in sight
- Bitcoin trades below $93,000, price changes less than 1% on Monday .
- Ethereum erases nearly 2% of its value, trading around $3,200.
- XRP is hovering under the $2 resistance level, declining for the sixth consecutive day.
Bitcoin (BTC), Ethereum (ETH) and Ripple (XRP) are struggling to recover on Monday threats of additional tariffs on European countries, by US President Trump. Crypto market erased 2% of its market capitalization in the last 24 hours, down to $3.23 trillion at the time of writing.
Monday marks the fifth consecutive day of decline in Ethereum and sixth in the case of Ripple.
Bitcoin struggles under $95,000 resistance
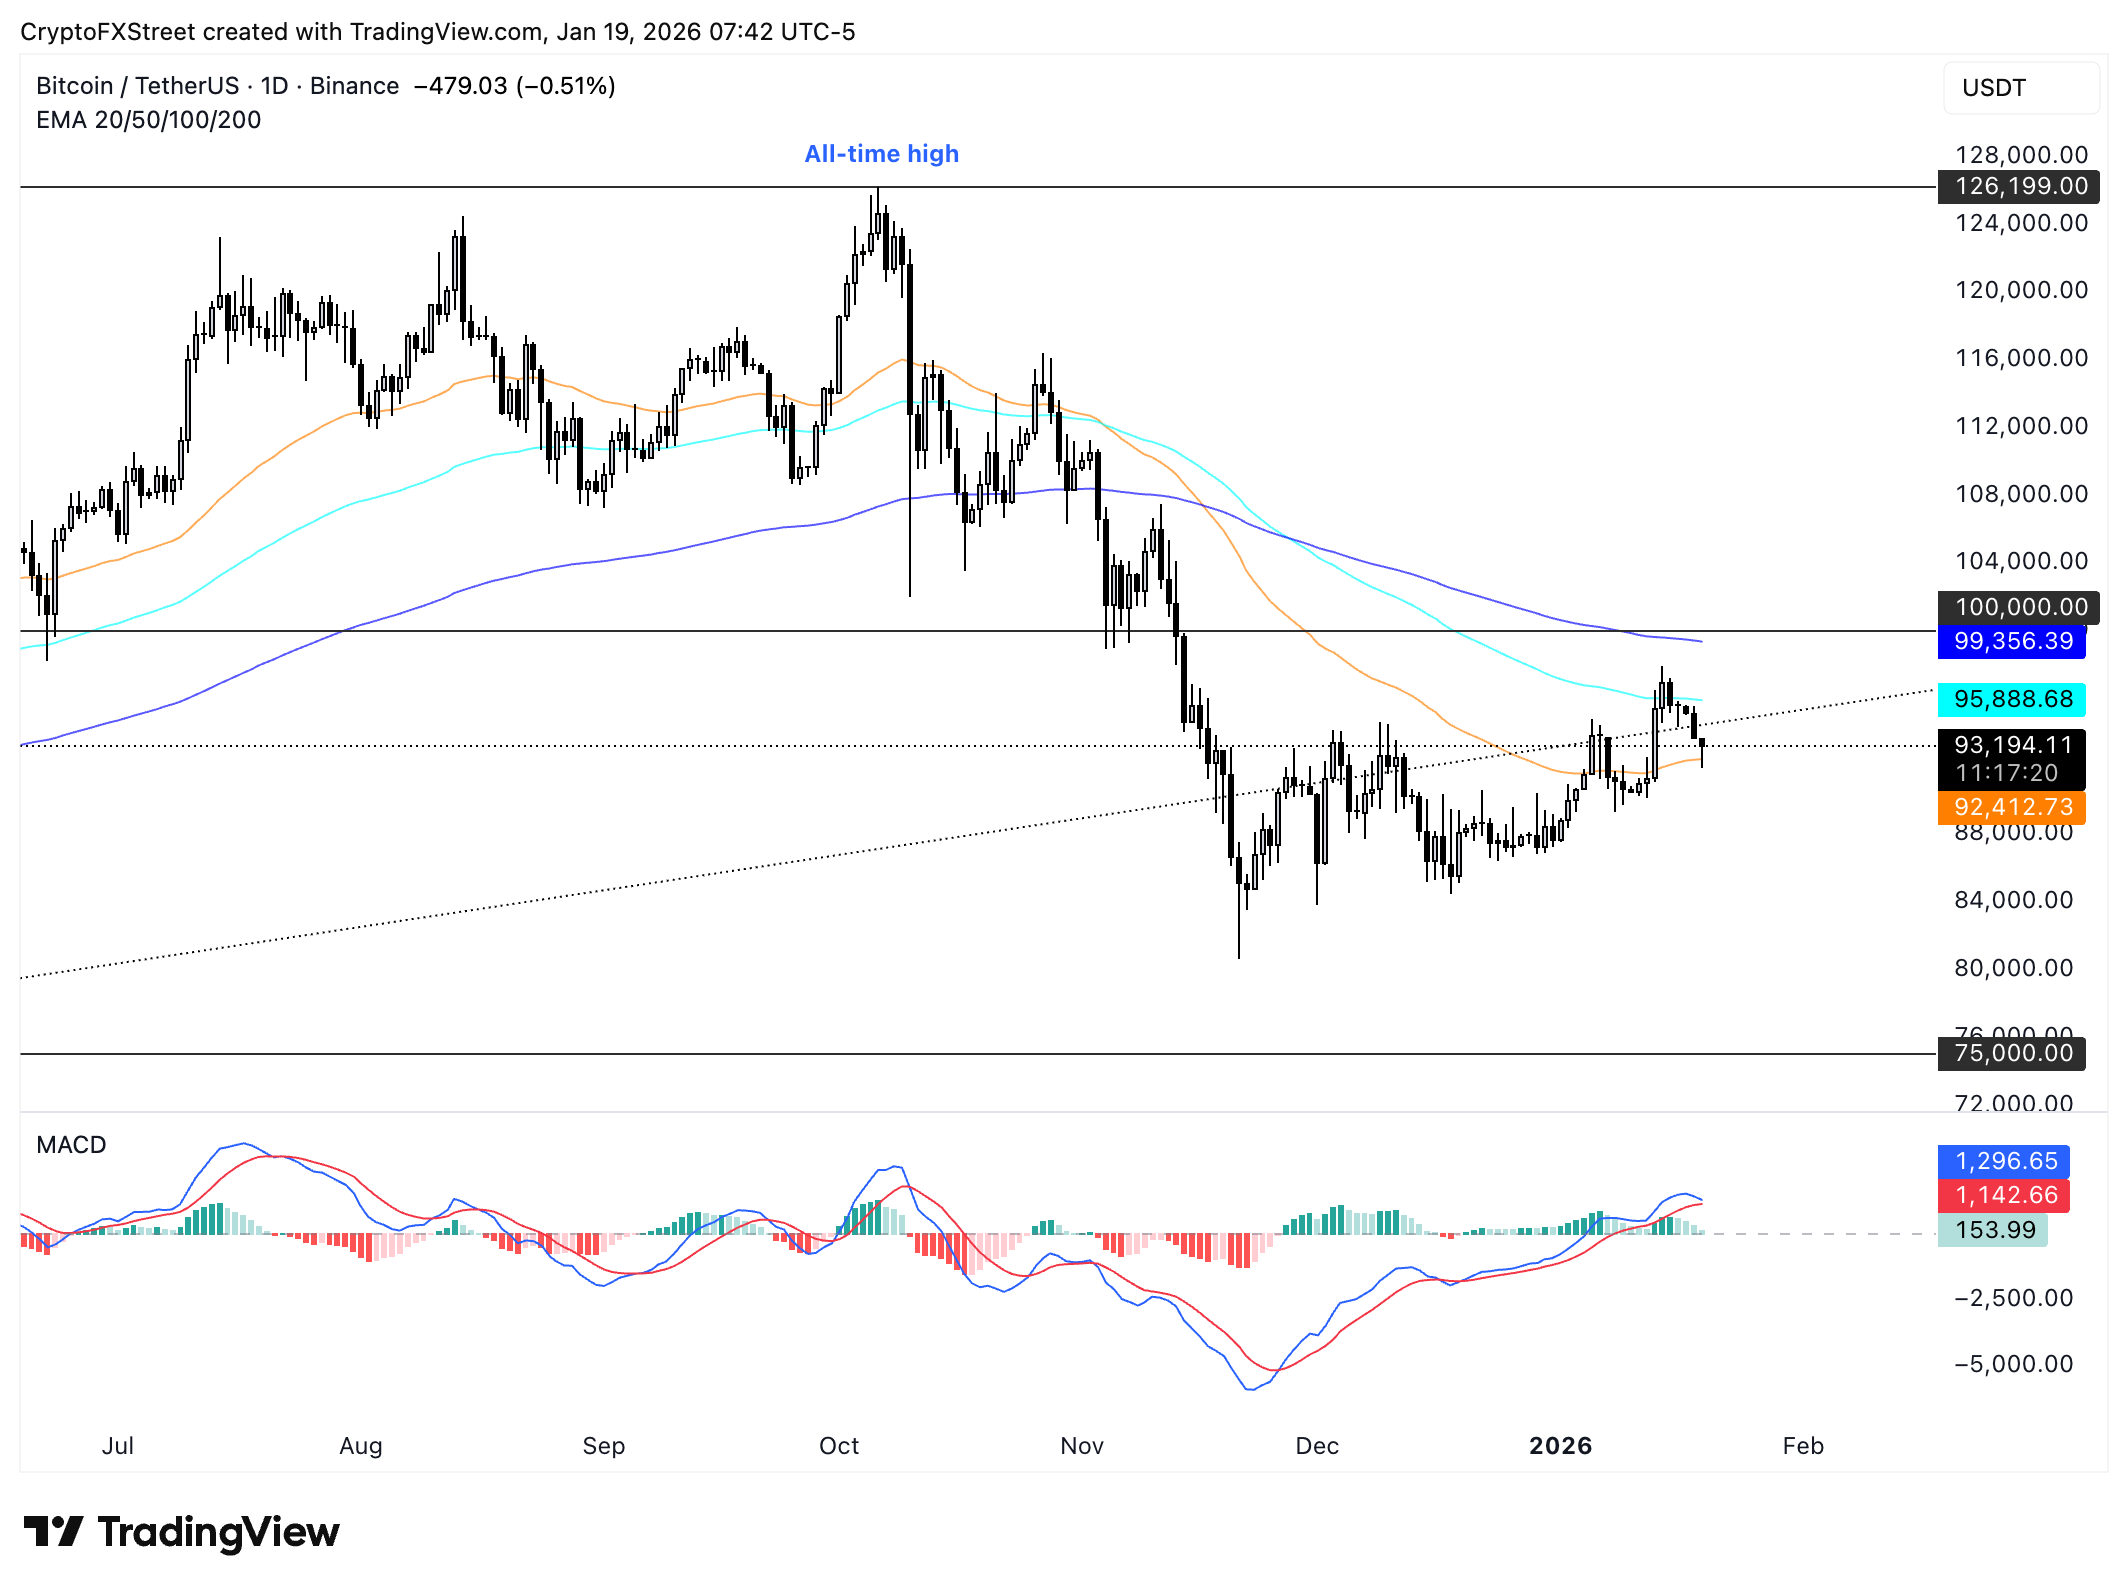
Bitcoin slipped under the $95,000 level on Friday, January 16. Since then the king crypto has struggled to recover, falling to a low of $91,910 on Monday. Bitcoin’s rangebound price action marks two key levels, the $95,889 and $92,412, two key Exponential Moving Averages (EMAs) as seen on the daily price chart.
The $93,000 resistance is key on Monday as the price is nearly unchanged in the last 24 hours.
Momentum indicator, Moving Average Convergence Divergence (MACD) shows shorter green histogram bars above the neutral line, signaling a waning positive momentum in BTC price trend.
The lower boundary of the range, at $92,412 could act as key support. A daily candlestick close under this level could signal further correction is coming this week.
Ethereum price fails to reflect rising demand
Ethereum validator exit queue hit zero over the weekend. The entry queue for staking climbed over 2.5 million Ether tokens, with a 44 day waiting period. This is a sign of shifting demand, more Ether is lined up to be locked in staking, while less is lined up for increasing market supply of Ether.
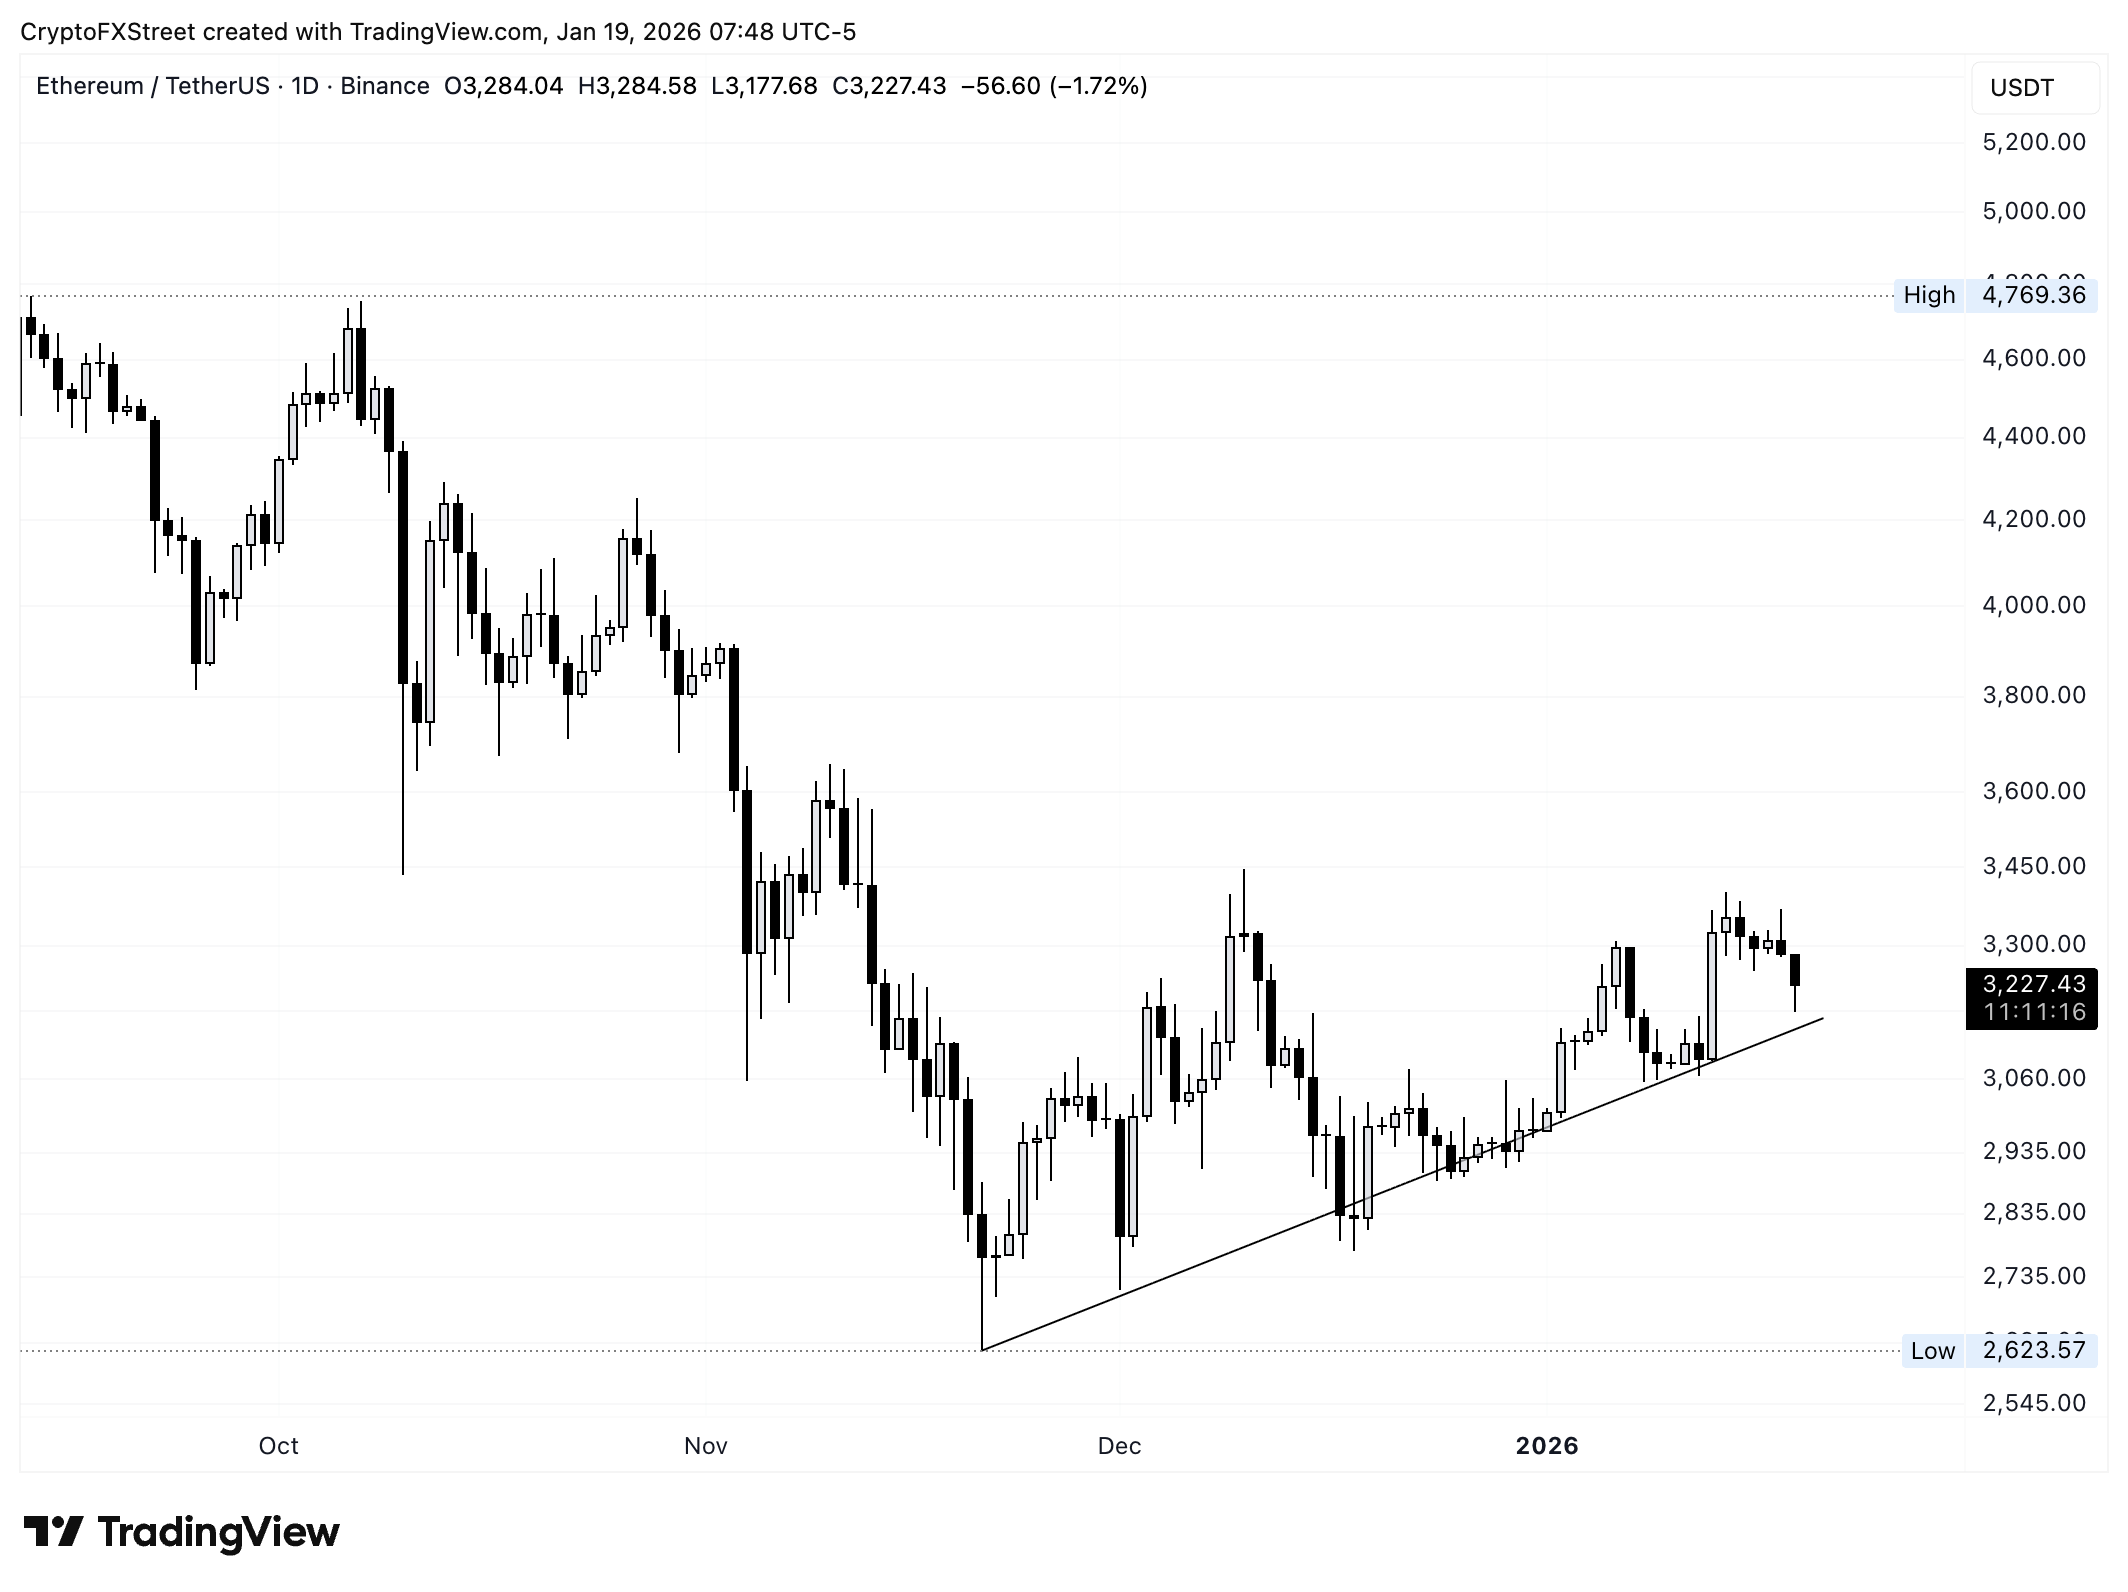
Even as demand shifts, Ether price struggles to reflect this, and ETH trades at $3,230 at the time of writing.
Monday marks the fifth consecutive day of decline in Ethereum price. The $3,145 support is key to the upward trend that started on November 21, 2025.
XRP down for sixth consecutive day
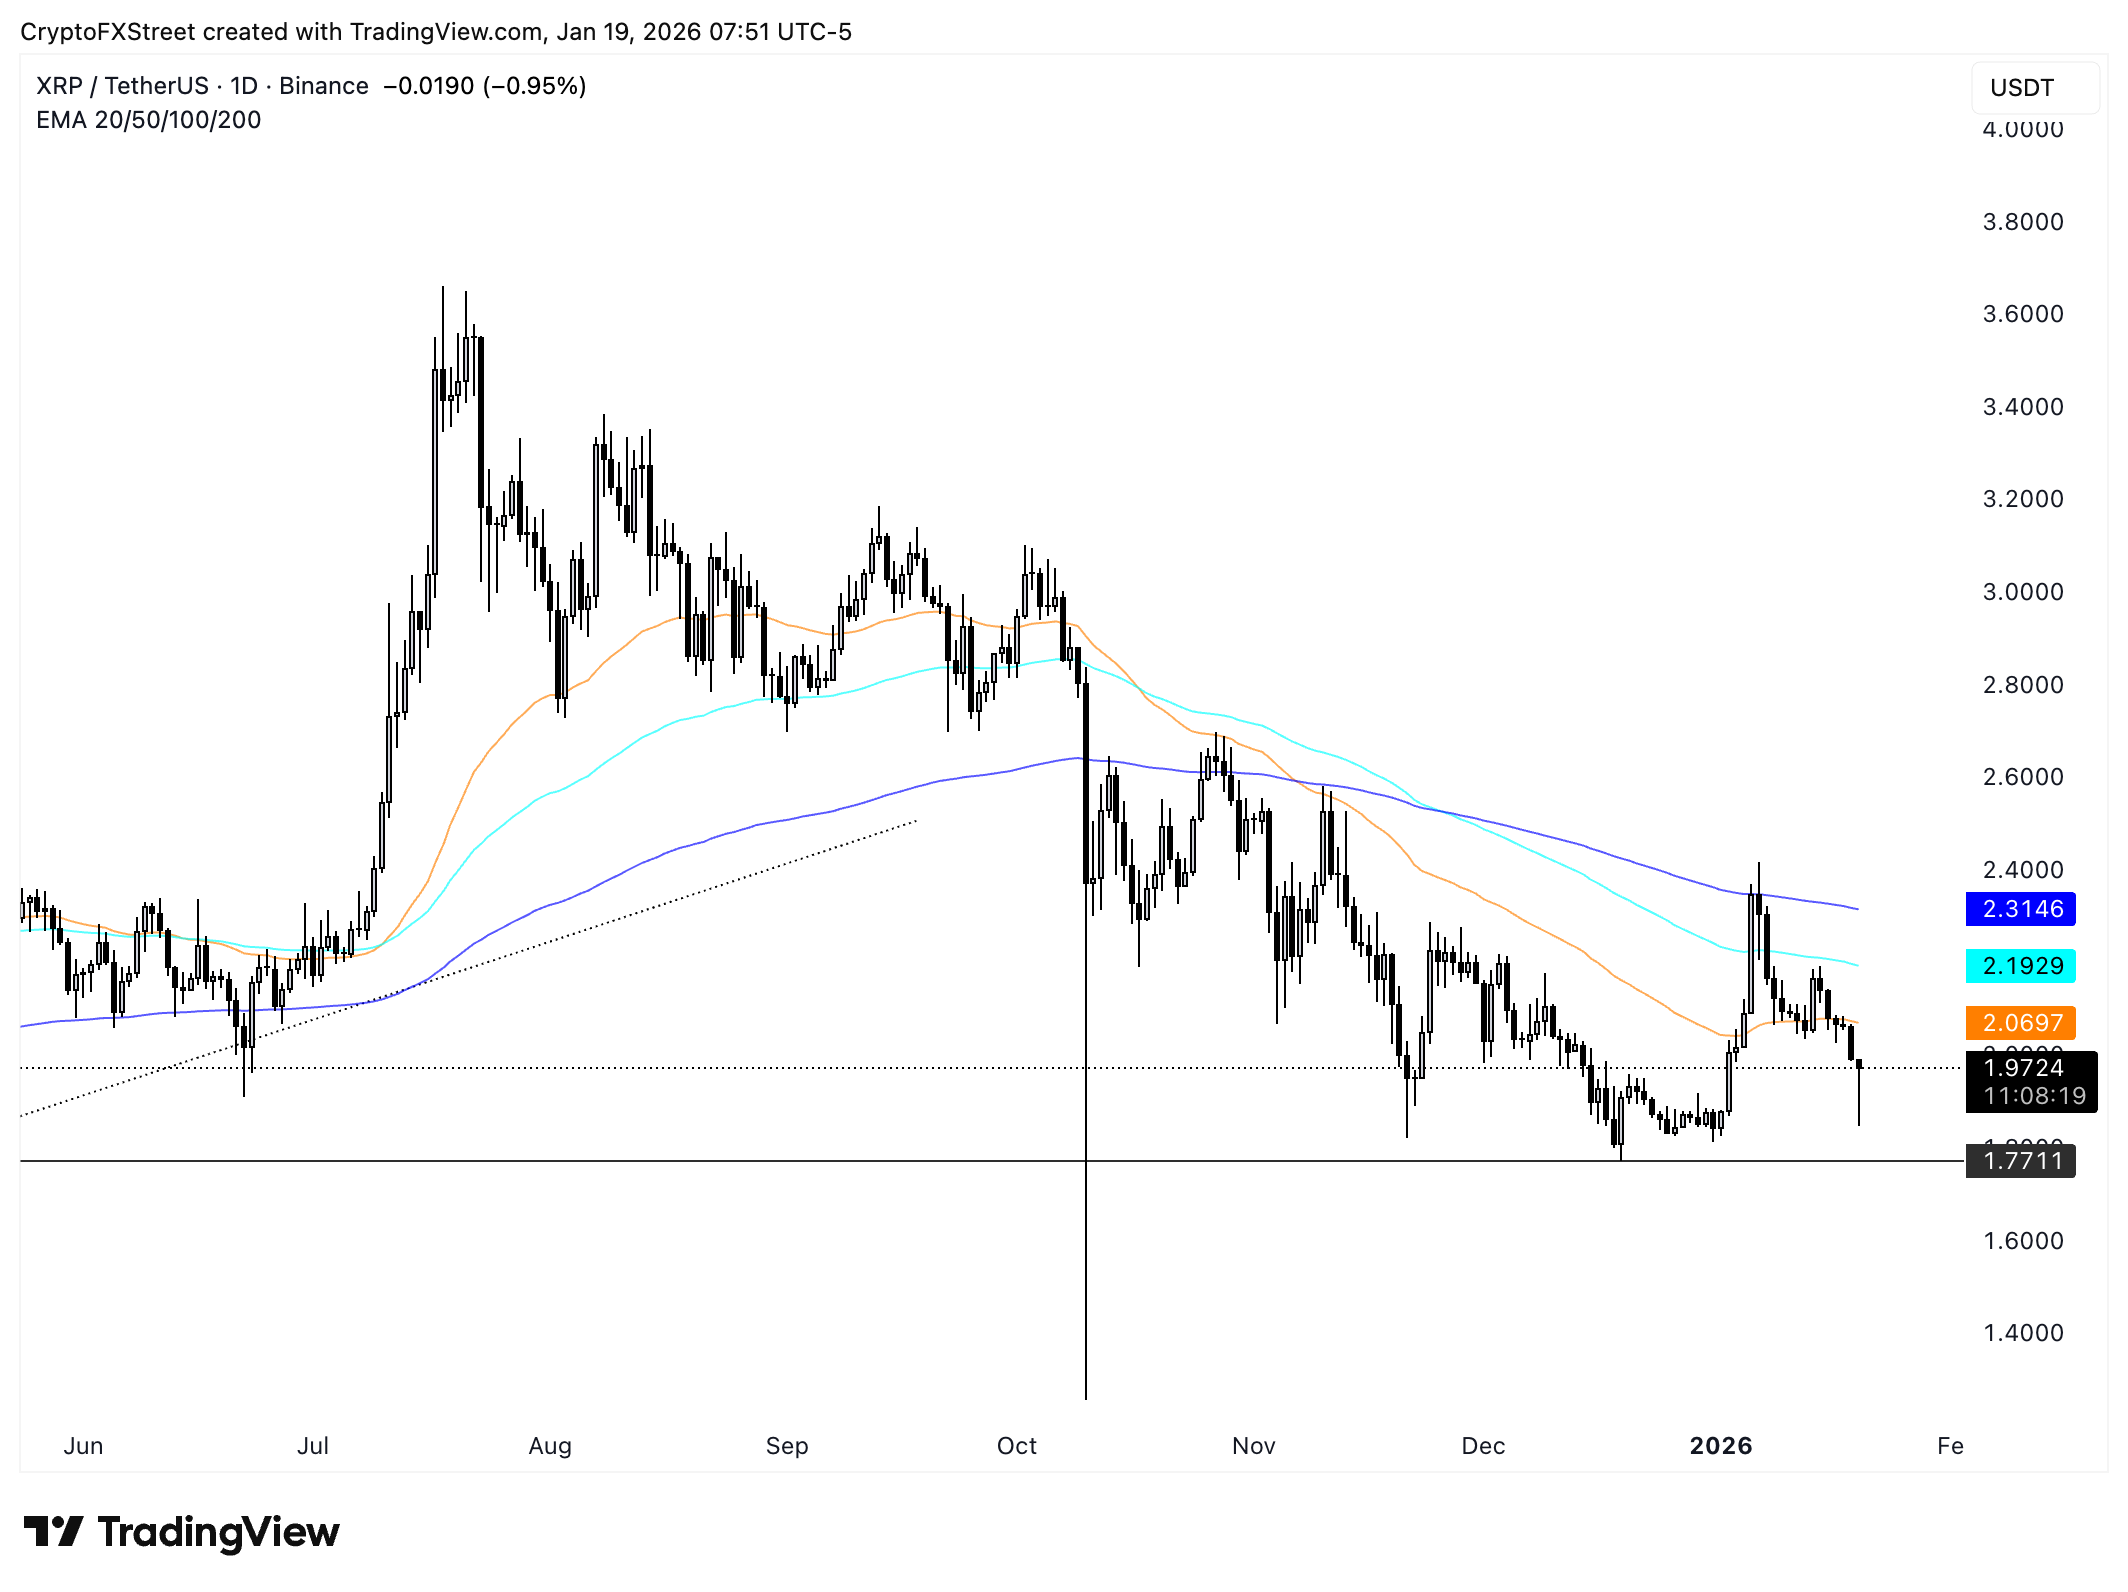
XRP is trading under the $2 level, price is in a downward trend for the last six days. XRP is exchanging hands at $1.9712 at the time of writing and the decline in overall crypto market capitalization is echoed in the altcoin’s daily price chart.
The $1.7711 level is key support for XRP and the EMA at $2.0698 is the key resistance on the XRP/USDT daily price chart.
Recommended Articles


