




US Dollar Index Price Forecast: Technical setup favours further gains above 100
- The US Dollar climbs to a seven-week high as the hawkish Fed outlook and rising Treasury yields support the Greenback.
- Technically, DXY holds above all major daily SMAs, keeping the bullish bias intact.
- The 61.8% Fibonacci level at 100.46 acts as immediate resistance, with RSI nearing overbought territory.
The US Dollar Index (DXY) climbs to a fresh seven-week high on Friday, supported by the Federal Reserve’s (Fed) hawkish interest rate hike on Wednesday. At the time of writing, the index trades around 100.40 and is on track to register a weekly gain of more than 1%.
Meanwhile, US Treasury yields rebound sharply, lending additional support to the Greenback, largely driven by firm Oil prices and persistent concerns over energy-related inflation. The benchmark 10-year yield trades around 5.00%, up over 1% on the day and not far from the 2007 high of 5.04% touched earlier this week.
UOB shifts to modestly hawkish Fed view, putting medium-term bearish USD bias at risk
Analysts at UOB Group note that their previously articulated stance in the “4Q26 quarterly report” — where a “medium-term bearish USD bias is contingent on an extended Fed rate pause through the remainder of 2026” — is now being reassessed in light of the latest FOMC developments. The bank stresses that, “like the markets, we do not think this is a ‘one-and-done hike’ from the Fed, and as per previous rate hike cycles, the Fed usually does not stop at one.” At the same time, they caution that “we do not believe this is the start of a long series of hikes.”
Instead, UOB now “expect two additional hikes, in Dec 2026 and 1Q 2027, thereafter on hold for rest of 2027 as the inflation fades in a more durable fashion in the later part of 2027 as the most likely course of action.” In their view, this shift implies that “as we now expect two further Fed rate hikes, the narrowing of US rate differentials relative to G-10 peers – which have been weighing on the DXY since late 2024 – is likely to reverse and underpin the DXY going forward.”
The bank also highlights important constraints and risks around the policy path. They have “ruled out a back-to-back rate hike in the Oct FOMC, due to its proximity to the mid-term elections (3 Nov).” Nevertheless, UOB emphasizes that “we continue to keep in mind the risks of further policy tightening if the inflation trajectory is made more persistent by the combination of higher energy prices, trade tariffs and AI-related factors.”
Technical analysis
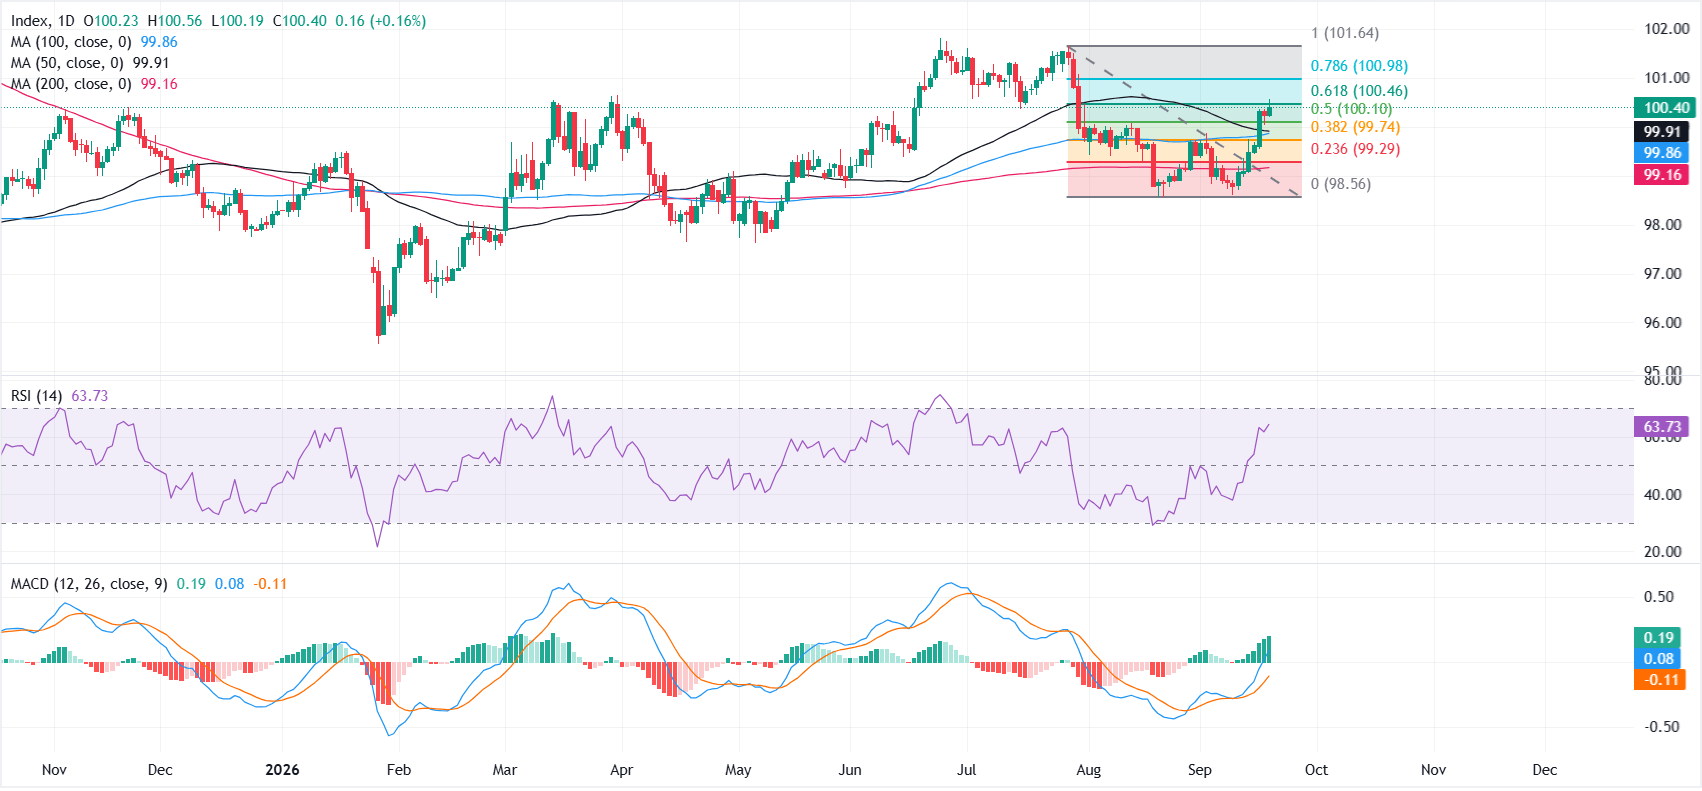
In the daily chart, Dollar Index Spot holds a constructive bullish bias as it remains above the 50-, 100- and 200-day Simple Moving Averages (SMAs) clustered between roughly 99.16 and 99.91.
Price is hovering just under the 61.8% Fibonacci retracement at 100.46, which acts as an immediate pivot resistance, while the Relative Strength Index (RSI) near 64 leans toward overbought and the Moving Average Convergence Divergence (MACD) stays positive, hinting that upside momentum is still in play but becoming stretched.
On the topside, initial resistance is located at the 61.8% retracement at 100.46, followed by the 78.6% Fibonacci level at 100.98, ahead of the recent swing high near 101.64.
On the downside, first support appears at the 50.0% retracement at 100.10, then at the 50-day SMA at 99.91 and the 100-day SMA at 99.86, with deeper levels seen at the 38.2% retracement at 99.74 and 23.6% retracement at 99.29, before the 200-day SMA at 99.16 and the 98.56 structural low.
(The technical analysis of this story was written with the help of an AI tool. Know more.)
US Dollar Price Today
The table below shows the percentage change of US Dollar (USD) against listed major currencies today. US Dollar was the strongest against the Japanese Yen.
| USD | EUR | GBP | JPY | CAD | AUD | NZD | CHF | |
|---|---|---|---|---|---|---|---|---|
| USD | 0.09% | -0.05% | 0.68% | 0.14% | 0.05% | 0.40% | -0.09% | |
| EUR | -0.09% | -0.14% | 0.63% | 0.05% | -0.07% | 0.33% | -0.19% | |
| GBP | 0.05% | 0.14% | 0.78% | 0.18% | 0.08% | 0.49% | -0.04% | |
| JPY | -0.68% | -0.63% | -0.78% | -0.55% | -0.68% | -0.29% | -0.80% | |
| CAD | -0.14% | -0.05% | -0.18% | 0.55% | -0.11% | 0.28% | -0.24% | |
| AUD | -0.05% | 0.07% | -0.08% | 0.68% | 0.11% | 0.40% | -0.13% | |
| NZD | -0.40% | -0.33% | -0.49% | 0.29% | -0.28% | -0.40% | -0.51% | |
| CHF | 0.09% | 0.19% | 0.04% | 0.80% | 0.24% | 0.13% | 0.51% |
The heat map shows percentage changes of major currencies against each other. The base currency is picked from the left column, while the quote currency is picked from the top row. For example, if you pick the US Dollar from the left column and move along the horizontal line to the Japanese Yen, the percentage change displayed in the box will represent USD (base)/JPY (quote).
Recommended Articles


