
Tether mints 3 billion USDT on Ethereum and TRON as markets stabilize
- Tether mints 2 billion USDT on Ethereum days after issuing 1 billion USDT on TRON.
- Most illicit activities involving stablecoins occurred on Ethereum and TRON networks, according to a Bitrace crypto crime report.
- Ethereum price hovers at $1,800 as bulls battle the 50-day EMA resistance at $1,860.
- TRON price faces increasing downside risks as the RSI indicator slides below the midline at 50.
Tether ramps up its minting activity amid surging demand for stablecoins, often signaling heightened trading and liquidity needs. According to recent reports, the issuer of the leading stablecoin by market capitalization has minted 2 billion USDT on Ethereum and an additional 1 billion USDT on the TRON network.
Tether mints USDT as illicit trade skyrockets on Ethereum and TRON networks
Tether has minted 2 billion USDT on Ethereum in addition to another 1 billion USDT issued on the TRON network over the last three days, according to Spot On Chain. USDT minting has accelerated in 2025, especially on the TRON network.
“The total supply of USDT on TRON now stands at $71.71 billion, making it the largest supply by chain,” Spot On Chain highlighted on Monday.
Since the beginning of the year, Tether has minted a total of 12 billion USDT on TRON, underscoring the protocol’s growing role in the adoption of stablecoins.
Tether’s revamped USDT minting comes amid reports of illicit trade occurring mostly on Ethereum and TRON networks. According to a crypto crime report released by Bitrace, high-risk addresses linked to Ethereum and TRON protocols received over $278.1 billion in 2024, marginally higher than in 2023, but significantly exceeding levels seen in 2022 and 2021.
“Given that most illicit activities occur on Ethereum and TRON networks, Bitrace defines blockchain addresses used by illegal entities for receiving, transferring, and storing stablecoins (ERC20_USDT, ERC20_USDC, TRC20_USDT, TRC20_USDC) as high-risk addresses,” Bitrace explained in the crypto crime report, adding that “in 2024, these addresses collectively received approximately USD 649 billion, slightly higher than the previous year.”
Ethereum price consolidates: Breakout in the offing?
Ethereum’s price hovers at $1,800 at the time of writing on Wednesday, reflecting the ongoing consolidation in the wider crypto market. The largest smart contracts token faces resistance at $1,860, coinciding with the 50-day Exponential Moving Average (EMA). A breakout above this level is necessary to confirm the bullish potential and solidify the trend reversal from the descending channel on the daily chart below.
The Relative Strength Index (RSI) indicator, currently at a neutral 55.38 above the midline, indicates that bulls are in control. An upward move toward overbought territory could propel Ethereum’s price momentum to challenge the next key resistance at $2,000.
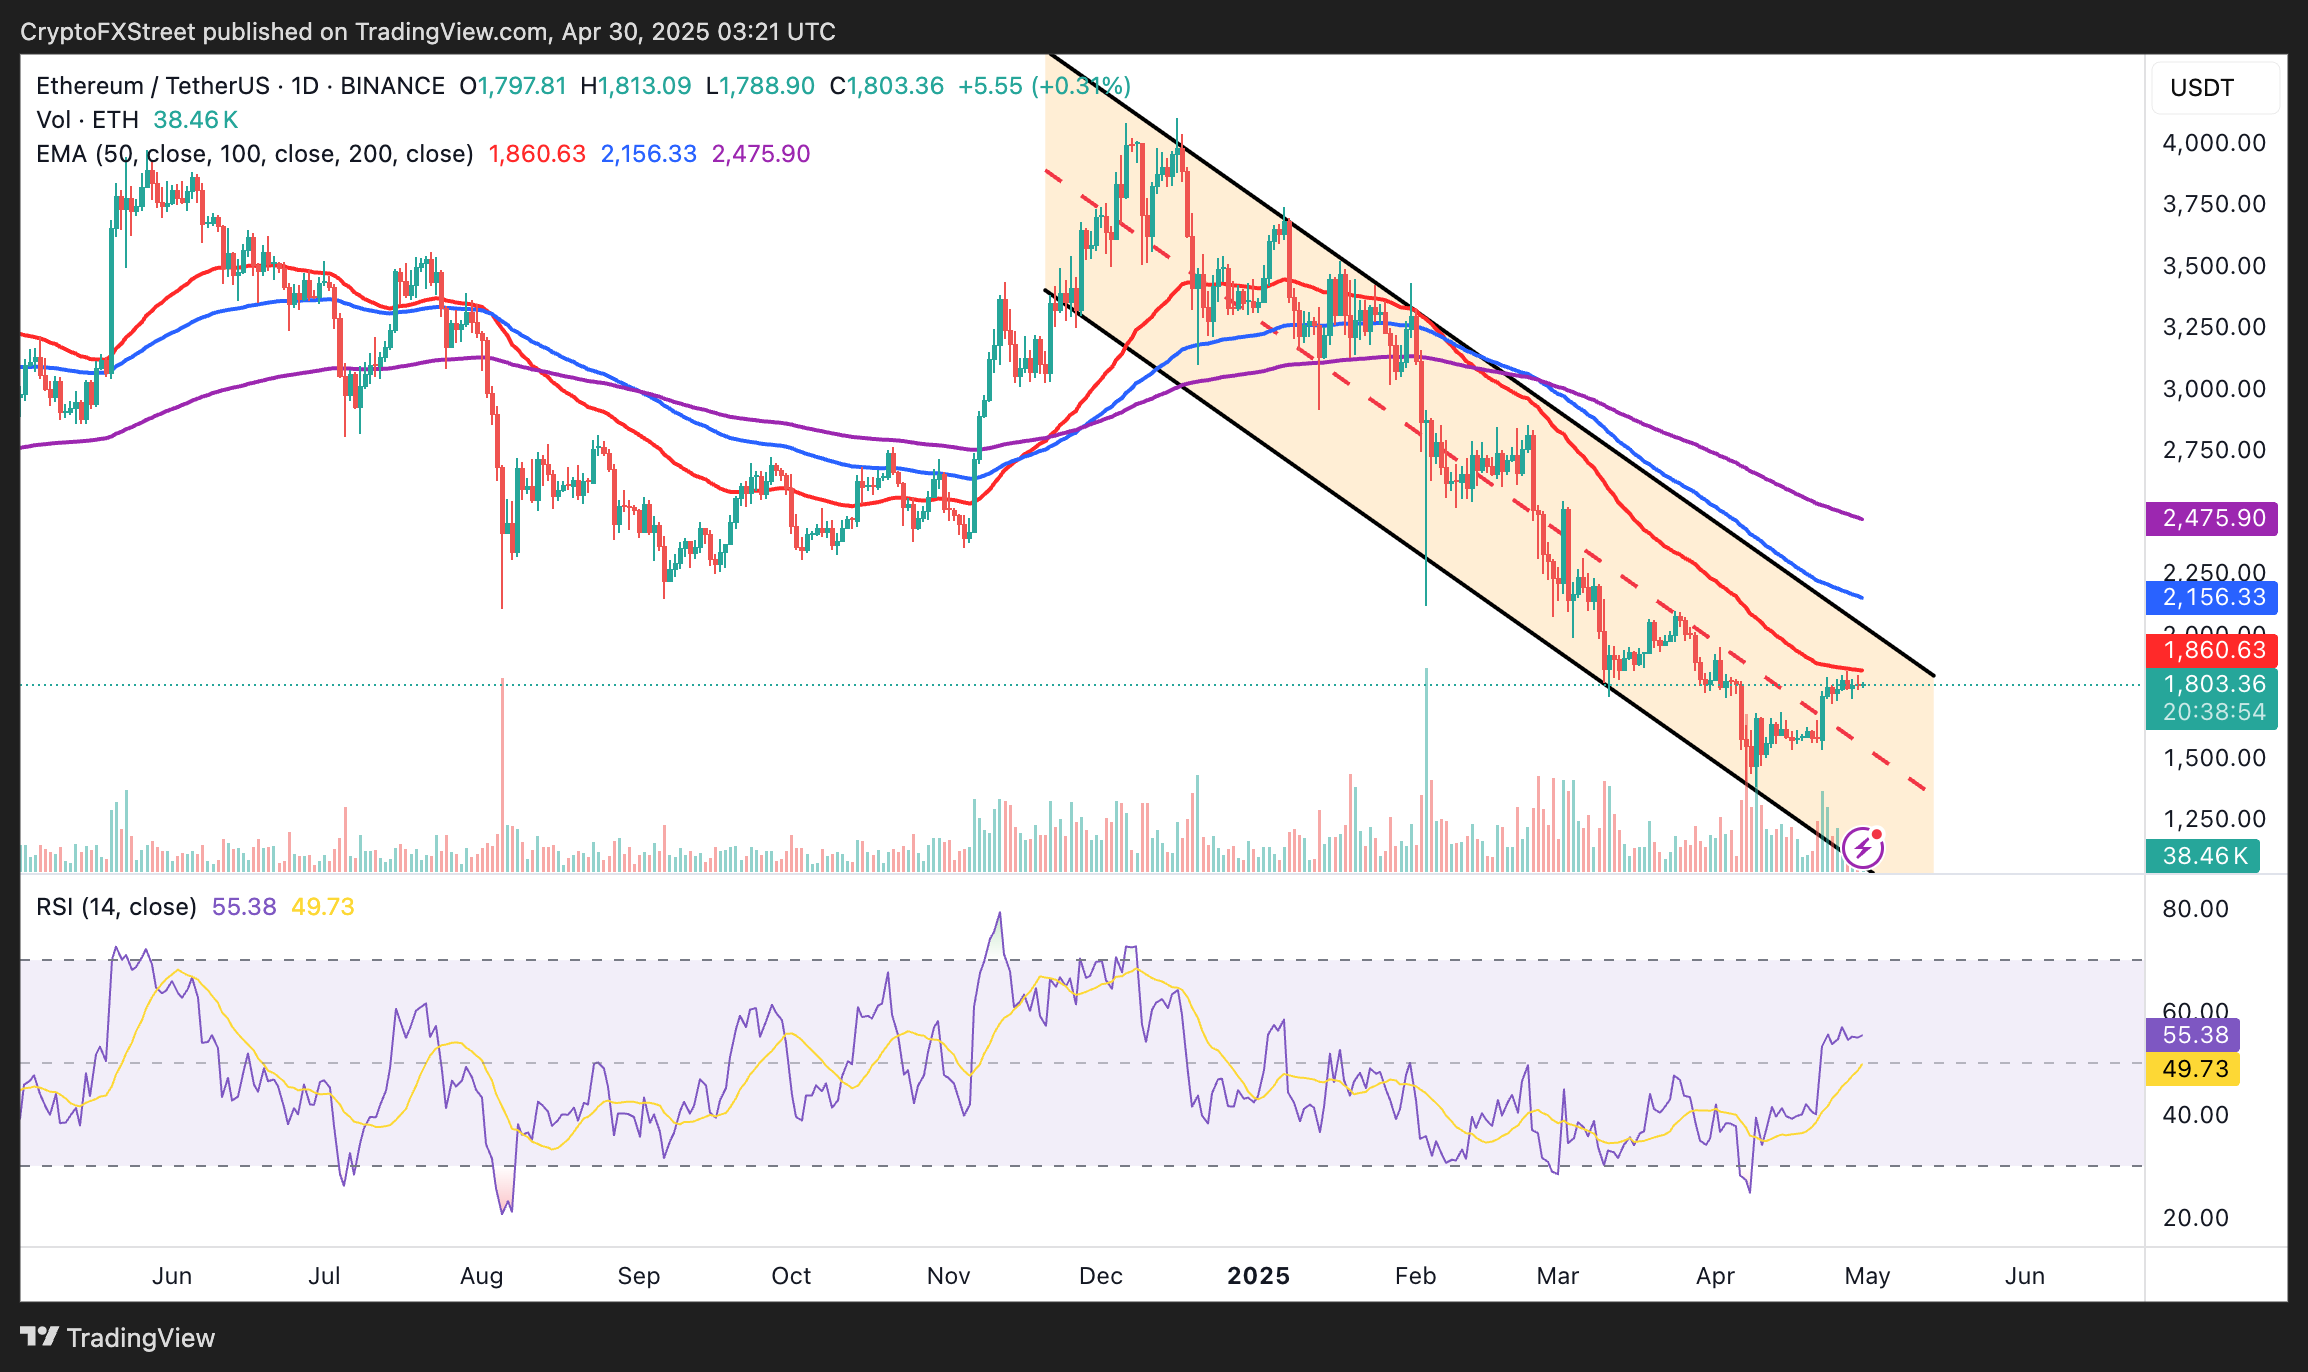
ETH/USD daily chart
However, with Ethereum trading below the 50, 100, and 200-day EMAs, it would take the bulls more conviction to break above the descending channel. Therefore, it is prudent to prepare for all outcomes, including ETH falling to retest the channel’s mid-level around $1,500, and if volatility increases, the lower boundary roughly at $1,400.
TRON price testing critical support level
TRON’s price bullish outlook may be at risk, teetering on the brink, as the immediate support from the 50-day EMA near $0.24 shows signs of faltering. Its upside is capped under $0.25, the red-shaded area on the daily chart.
At the same time, the RSI indicator is retracing from recent highs of 66.77 and approaching the midline (50), indicating a potential increase in sell-side pressure.
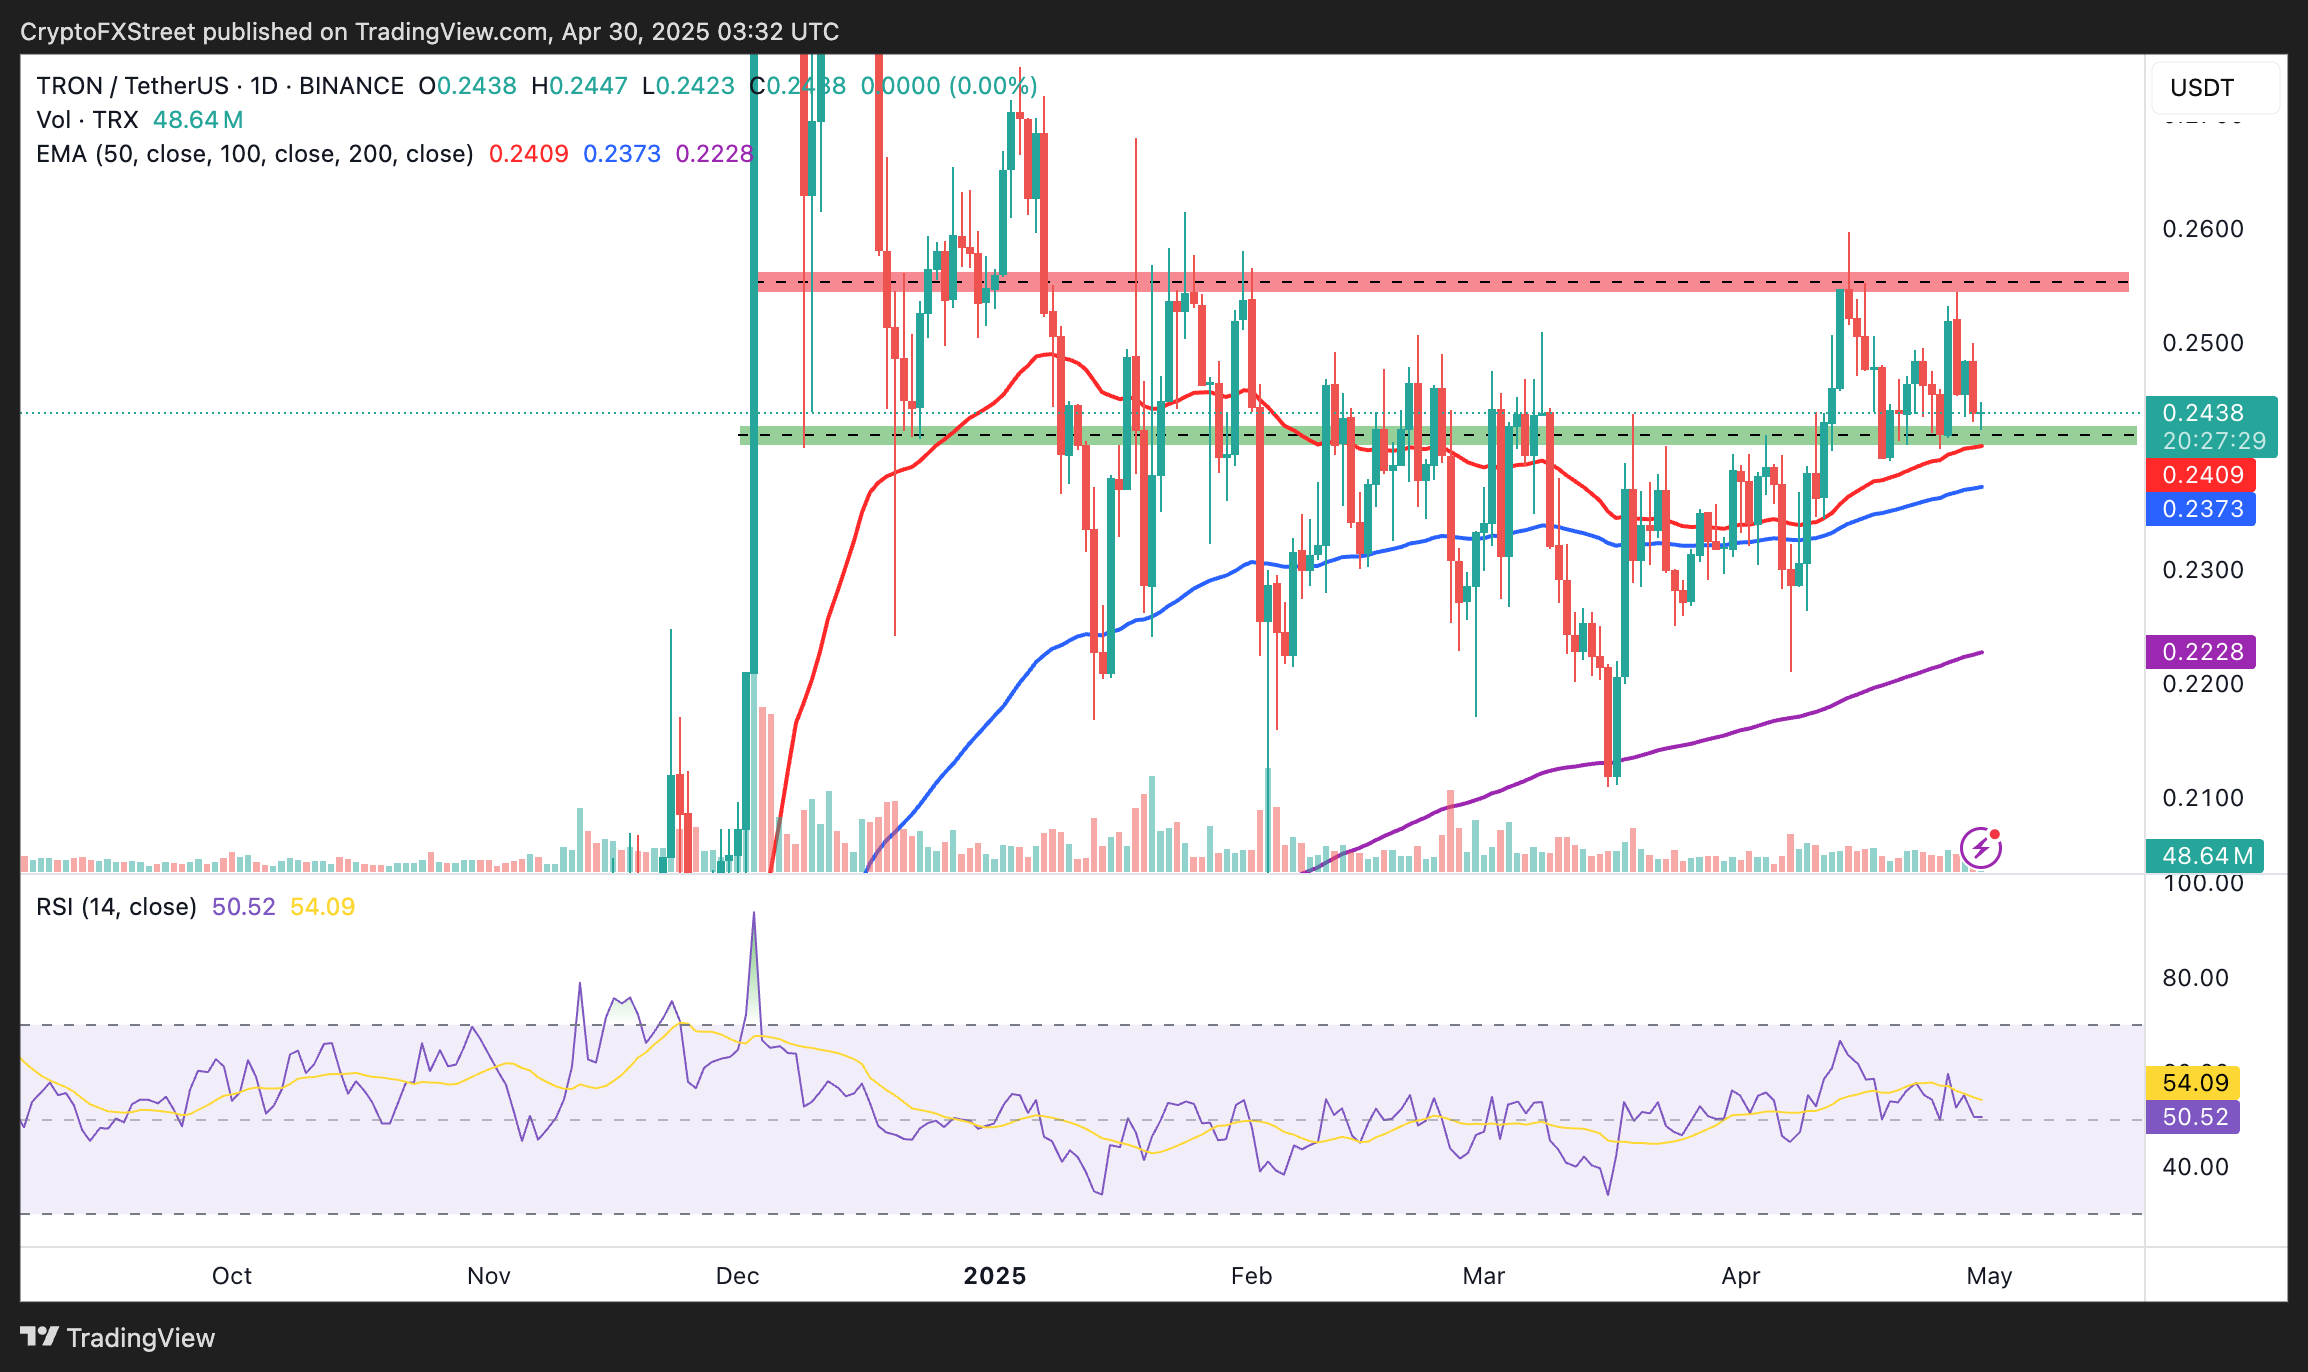
TRX/USDT daily chart
If the 50-day EMA support fails, bulls could find a reprieve at the 100-day EMA around $0.23, but accelerated losses might push prices to test the next critical support at $0.22, coinciding with the 200-day EMA.
Cryptocurrency prices FAQs
Token launches influence demand and adoption among market participants. Listings on crypto exchanges deepen the liquidity for an asset and add new participants to an asset’s network. This is typically bullish for a digital asset.
A hack is an event in which an attacker captures a large volume of the asset from a DeFi bridge or hot wallet of an exchange or any other crypto platform via exploits, bugs or other methods. The exploiter then transfers these tokens out of the exchange platforms to ultimately sell or swap the assets for other cryptocurrencies or stablecoins. Such events often involve an en masse panic triggering a sell-off in the affected assets.
Macroeconomic events like the US Federal Reserve’s decision on interest rates influence crypto assets mainly through the direct impact they have on the US Dollar. An increase in interest rate typically negatively influences Bitcoin and altcoin prices, and vice versa. If the US Dollar index declines, risk assets and associated leverage for trading gets cheaper, in turn driving crypto prices higher.
Halvings are typically considered bullish events as they slash the block reward in half for miners, constricting the supply of the asset. At consistent demand if the supply reduces, the asset’s price climbs.
บทความแนะนำ


