
Solana Price Prediction: Is SOL ready for a breakout?
- Solana price has breached a critical roadblock after multiple attempts.
- SOL could make a 14% climb to $120, levels last tested on December 26.
- A break and close below the 100-day SMA at $97.24 would invalidate the bullish thesis.
Solana (SOL) price is trading with a bullish bias as it has for the past few weeks, but its upside potential remains capped. Nevertheless, a widespread revival recourse, reinforced by the hype around the Chinese Lunar New Year and the Year of the Dragon, could provide tailwinds for the Layer 1 (L1) token.
Also Read: Solana surpasses Bitcoin in weekly performance, garners 85,000 pre-orders for Solana Mobile
Solana breaches key resistance
Solana (SOL) price has breached a key resistance, the $104.92 supplier congestion level. SOL has faced a rejection from this blockade multiple times before with the latest foray hinting at a possible continuation rally.
Downward support remains strong as offered by the 25, 50, and 100-day day Simple Moving Averages (SMA) at $97.24, $92.69, and $80.02, respectively. The inclination of these moving averages to the north shows this is the path with the least resistance.
The position of the Relative Strength Index (RSI) at 62 points to a strong price strength while also showing there is more room to the north before SOL is considered overbought. The Moving Average Convergence Divergence (MACD), positioned in positive territory, also supports the upside potential. Its movement above the signal line (orange band) suggests an incoming bullish cycle.
Increased buying pressure could see Solana price extend the gains past the $110.00 level. An extended climb could send SOL to the $120.00 psychological level, nearly 14% above current levels. In a highly bullish case, the L1 token could retake the range high of $126.36, levels last tested on Christmas day.
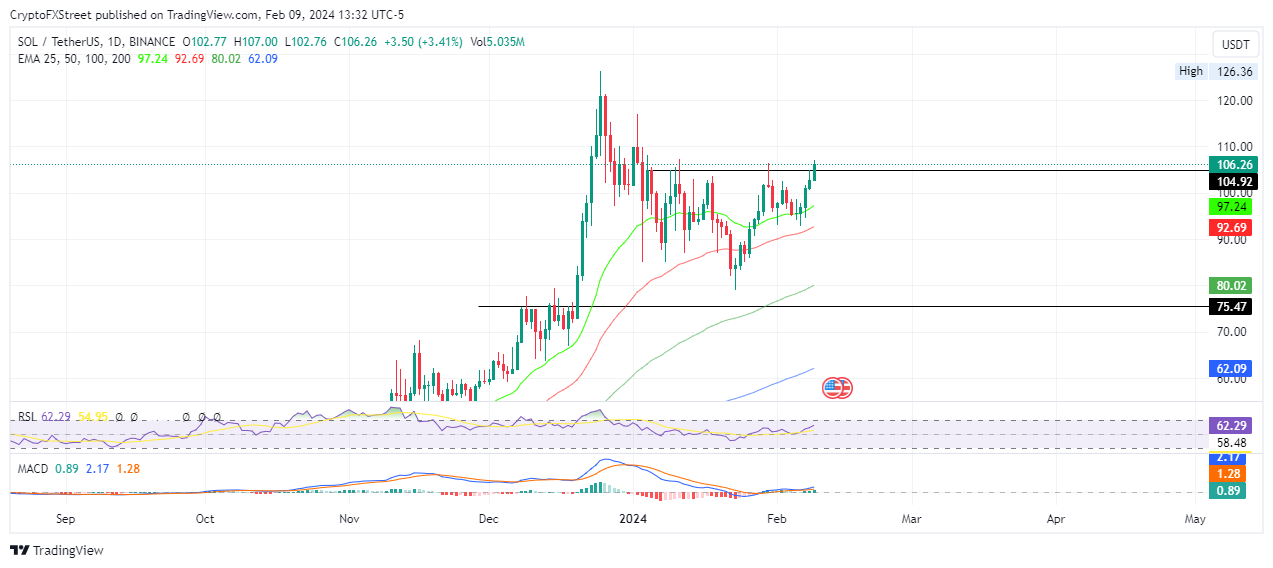
SOL/USDT 1-day chart
A rejection from the $104.92 resistance level could see Solana price drop to test the 25-day SMA at $97.24. A break and close below this level would invalidate the bullish thesis. This could send SOL lower to the 50-day SMA at $92.69.
In a dire case, Solana price would extend the fall to the 100-day SMA at $80.02, or worse, the $75.47 support floor.
บทความที่เกี่ยวข้อง


