


Bitcoin Price Forecast: BTC stalls as persistent ETF outflows and hawkish Fed minutes weigh on risk appetite
- Bitcoin stalls around $63,500 on Thursday after dropping to the weekend low of $62,000 the previous day.
- US-listed spot ETFs recorded an outflow of $306.42 million on Wednesday, marking the second consecutive day of outflows this week.
- Hawkish signals in the Federal Reserve’s FOMC minutes reinforce concerns that interest rates could remain elevated for longer, weighing on risk appetite.
Bitcoin (BTC) stalls around $63,500 on Thursday after dropping to a low near $62,000 on Wednesday, near its weekend low. Persistent outflows from spot Bitcoin Exchange-Traded Funds (ETFs) and a hawkish tone in the Federal Reserve’s (Fed) latest Federal Open Market Committee (FOMC) minutes are weighing on investor sentiment, raising concerns about tighter liquidity conditions, and limiting Crypto King’s recovery.
Hawkish Fed weighs on BTC
The much-awaited minutes from the Fed’s October monetary policy meeting, released late Wednesday, came in hawkish. The meeting showed that most officials favored no rate change in October but considered additional hikes roughly acceptable based on their September estimates. Some policymakers cautioned that inflation might force them to adopt a tighter policy, with some even considering a bigger hike in December if the data worsened.
Against this macroeconomic backdrop, most participants observed that AI-related debt had grown rapidly and that much of this growth had occurred through complex, opaque financing structures. Some Fed officials were concerned that AI exposure was being concentrated in a “small number” of companies.
These observations weren’t a total surprise, as market participants had already been pricing in a December hike, but the minutes made the rate path look a little steeper and longer. This continues to support the US Dollar (USD) and keeps Bitcoin under pressure, with BTC sliding toward the weekend low of $62,000 on Wednesday.
Institutional demand continues to weaken
Institutional demand for Bitcoin continues to deteriorate, adding to selling pressure. SoSoValue data shows BTC spot ETFs recorded net outflows of $306.42 million on Wednesday, marking the second consecutive day of outflows this week following a billion-dollar withdrawal last week. If the trend of outflows continues and intensifies this week, it could push BTC lower again.
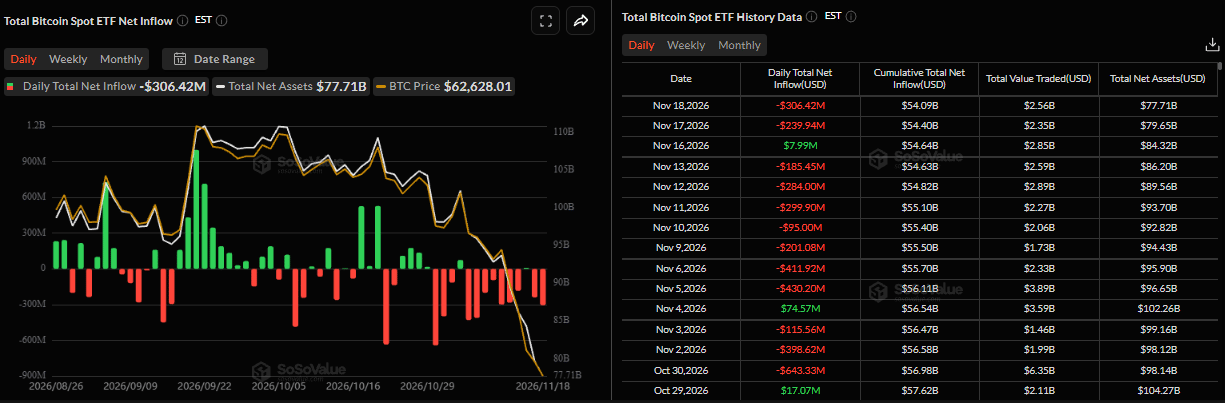
Bitfinex told FXStreet that investors who bought Bitcoin through ETFs in the third quarter now face substantial unrealized losses. Weighting each day’s net flow by the Bitfinex daily close gives an average entry price of around $80,070 for that period. This leaves third-quarter ETF buyers around 19% underwater. Meanwhile, the flow-weighted average entry price across the entire quarter stands at $78,300, implying an unrealized loss of approximately 17%
“We expect Bitcoin to remain inside the July Base, between about $60,100 and $68,600, the range implied by options for the 27 November expiry, with risks still skewed towards a retest of $62,029 and the $61,300 lower edge of the Base," the Bitfinex analyst said. "To the upside, three consecutive sessions of ETF inflows with CME OI stabilizing and STH-SOPR recovering towards 1 would indicate that institutional selling has ended and bring $69,400 and then $72,700 into view. To the downside, acceptance below $61,300 with ETF outflows above $300 million a day would point to the $57,803 cycle low,” the analyst said.
Long-term holder spending clusters between $62,000 and $65,000
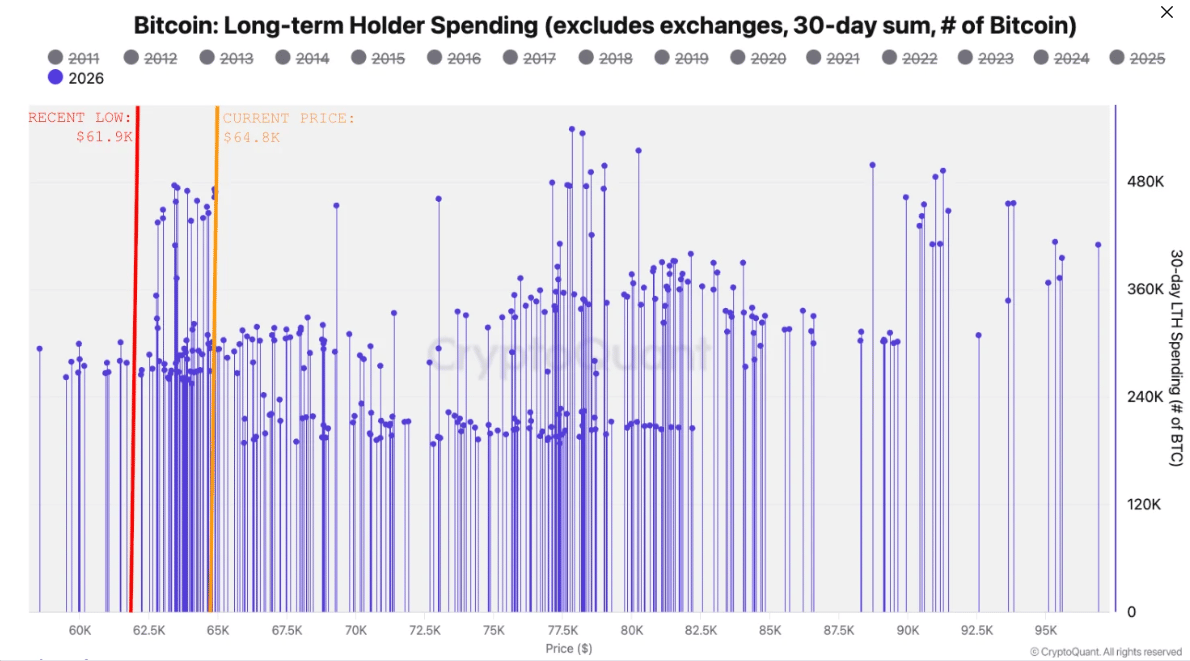
CryptoQuant’s Tuesday report highlighted that a significant concentration of long-term holder spending or buying by new investors is between $62,000 and $65,000, a zone that could act as support for Bitcoin.
The chart below shows the 30-day sum of long-term holder spending, excluding exchanges, against the price at which that spending took place during 2026. Each point represents a daily reading, with the densest concentration falling between $62,000 and $65,000. This is the range in which Bitcoin traded for much of the period from June to mid-August, before the rally began.
“Investors tend to defend their cost basis, which is why a dense cluster of this kind may act as a price support,” the CryptoQuant analyst said.
Bitcoin technical outlook: Bears still in control
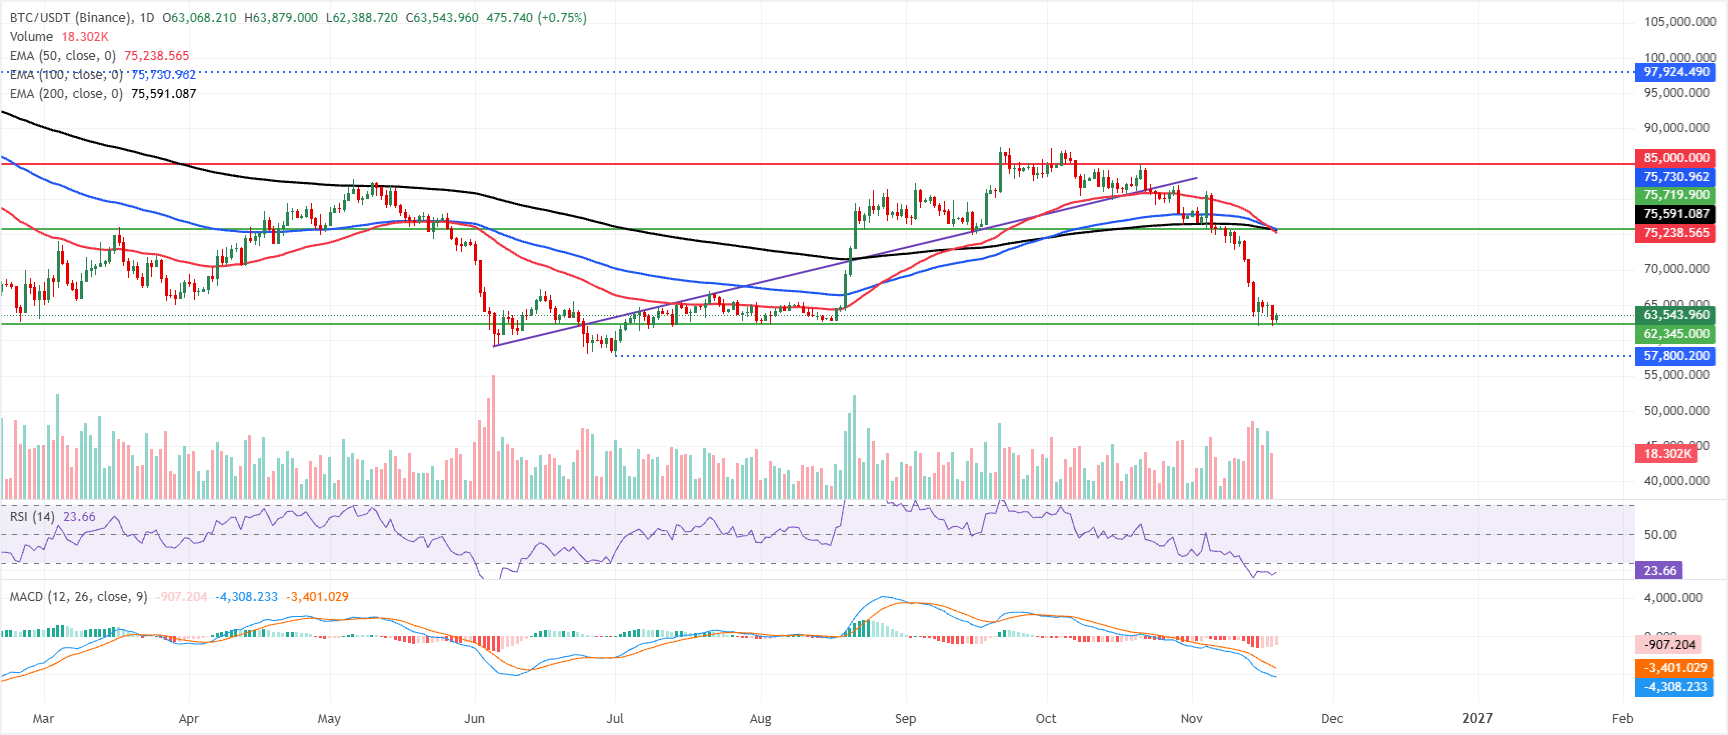
Bitcoin price trades at $63,543 on Thursday, extending a bearish near-term bias as it holds well below the 50-day, 100-day and 200-day Exponential Moving Averages (EMAs) clustered between roughly $75,200 and $75,700.
The Moving Average Convergence Divergence (MACD) remains deeply negative, with the line below the signal and both under the zero line, while the Relative Strength Index (RSI) hovers in oversold territory near 24, hinting that downside momentum is strong even if stretched.
On the topside, initial resistance comes from the 50-day EMA at $75,238, followed by the 200-day EMA at $75,591 and the 100-day EMA at $75,730, which together define a dense cap above current levels. A more distant barrier is horizontal resistance around $85,000, where selling pressure could intensify if a broader rebound materializes.
(The technical analysis of this story was written with the help of an AI tool. Know more.)
Bitcoin, altcoins, stablecoins FAQs
Bitcoin is the largest cryptocurrency by market capitalization, a virtual currency designed to serve as money. This form of payment cannot be controlled by any one person, group, or entity, which eliminates the need for third-party participation during financial transactions.
Altcoins are any cryptocurrency apart from Bitcoin, but some also regard Ethereum as a non-altcoin because it is from these two cryptocurrencies that forking happens. If this is true, then Litecoin is the first altcoin, forked from the Bitcoin protocol and, therefore, an “improved” version of it.
Stablecoins are cryptocurrencies designed to have a stable price, with their value backed by a reserve of the asset it represents. To achieve this, the value of any one stablecoin is pegged to a commodity or financial instrument, such as the US Dollar (USD), with its supply regulated by an algorithm or demand. The main goal of stablecoins is to provide an on/off-ramp for investors willing to trade and invest in cryptocurrencies. Stablecoins also allow investors to store value since cryptocurrencies, in general, are subject to volatility.
Bitcoin dominance is the ratio of Bitcoin's market capitalization to the total market capitalization of all cryptocurrencies combined. It provides a clear picture of Bitcoin’s interest among investors. A high BTC dominance typically happens before and during a bull run, in which investors resort to investing in relatively stable and high market capitalization cryptocurrency like Bitcoin. A drop in BTC dominance usually means that investors are moving their capital and/or profits to altcoins in a quest for higher returns, which usually triggers an explosion of altcoin rallies.
บทความแนะนำ


