


Top Altcoins Price Forecast: Ripple and Solana under pressure as Hyperliquid recovers
- Ripple is down over 2% on Thursday, extending losses below $1.30 and capped below crucial moving averages.
- Solana drops 2% so far, testing its 200-day EMA and the $100 psychological level amid mounting selling pressure.
- Hyperliquid is up 7%, reclaiming its 50-day EMA at $81.21, suggesting renewed bullish momentum.
Institutional demand shakes
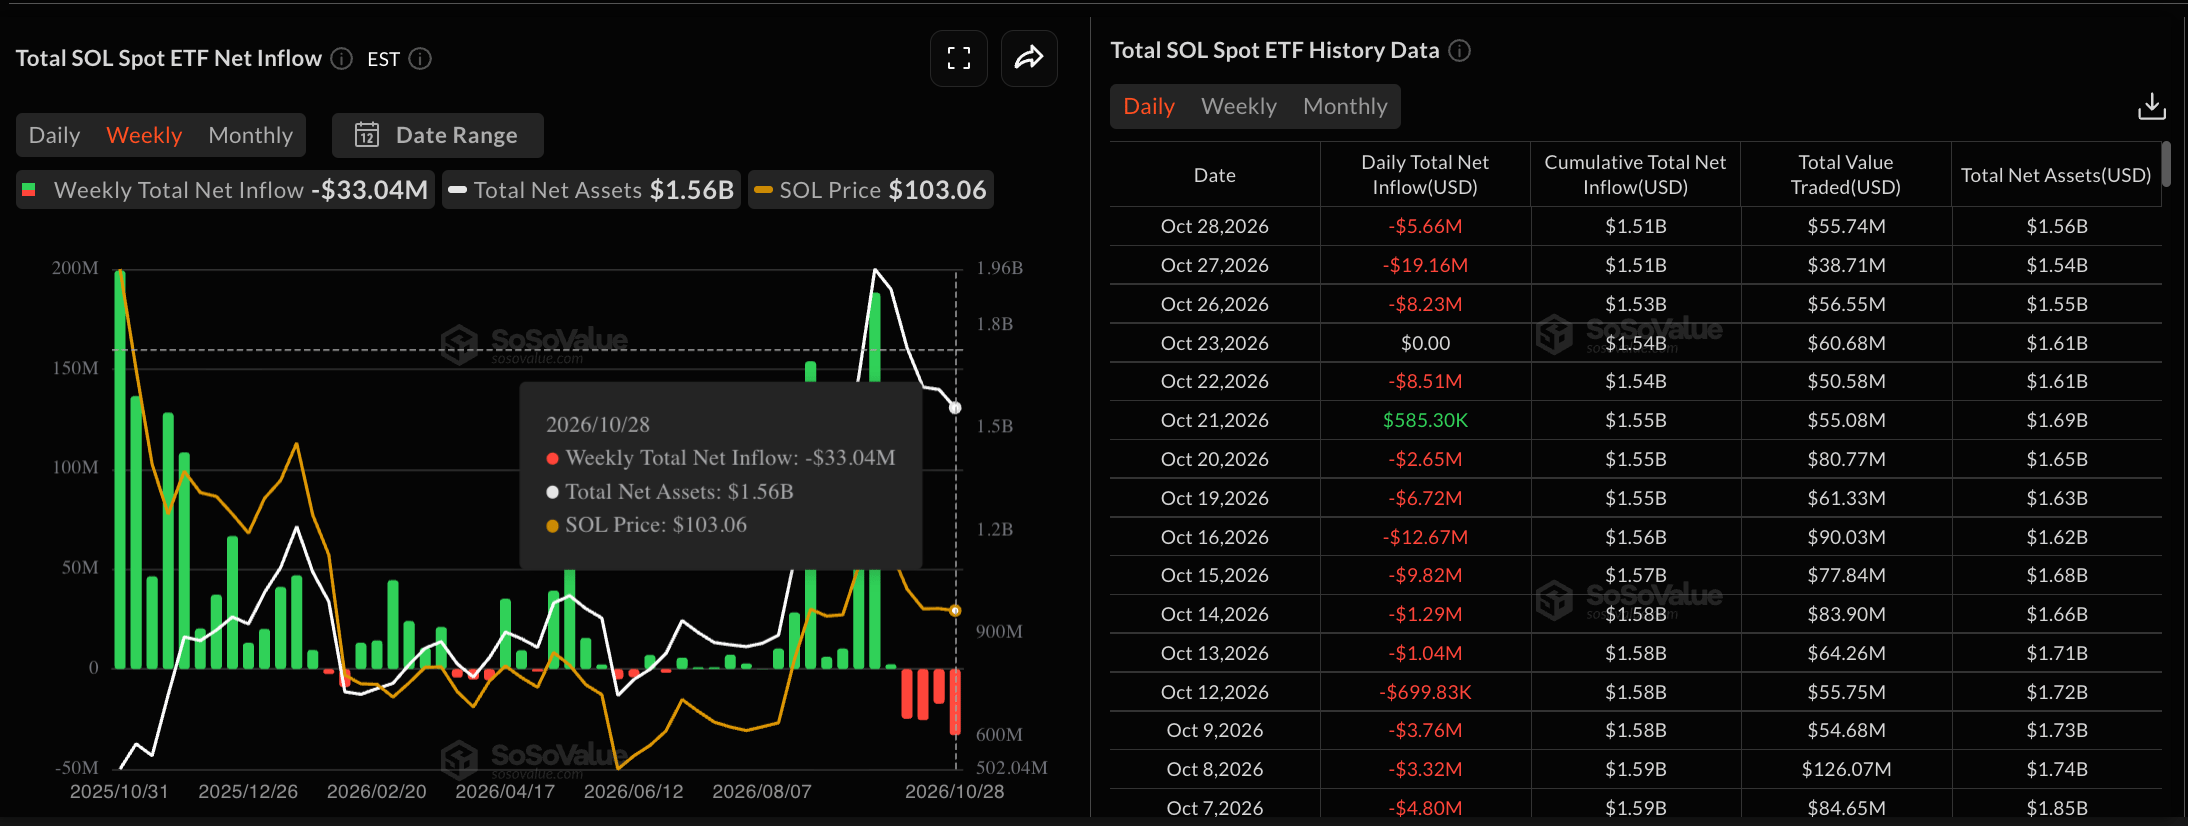
Institutional demand for altcoins is weak in the near term. Solana-focused ETFs record $5.66 million in outflows on Wednesday, after over $19 million and $8 million in outflows earlier this week, bringing the total to $33.04 million. A negative close to this week would mark its fourth consecutive weekly outflow, suggesting intense selling pressure from institutional investors.
Meanwhile, XRP and HYPE are facing institutional silence, with zero inflows on Wednesday, with weekly outflows of $3.61 million and $4.30 million, respectively.

Ripple risks breaking the key support floor
Ripple trades at $1.2924 at press time on Thursday, keeping a bearish near-term tone. XRP sits well below the 50-day and 200-day Exponential Moving Averages (EMAs) at $1.3574 and $1.3891, respectively.
The price has also retreated beneath the downward trendline barrier at $1.3216, suggesting that recent attempts to reclaim the resistance have failed.
Momentum is weak rather than washed out, with the Relative Strength Index (RSI) hovering near 40 on the daily chart, while the Moving Average Convergence Divergence (MACD) is flat in negative territory, hinting that any recovery could remain constrained.
A confirmed breakout below the $1.2588 level, set by the August 21 low, could extend the decline toward the August 2 high around $1.0933.
On the topside, initial resistance appears at the trendline break zone around $1.3216, followed by the 50-day EMA at $1.3574 and the denser structural cap provided by the 200-day EMA at $1.3891.
Solana tests the 200-day EMA support
Solana hovers around $100 on Thursday, keeping a bearish near-term bias. The SOL price remains below the 50-day EMA at $105 while holding above the longer-term 200-day EMA at $98.36.
The RSI around 35 hovers just above oversold territory, and the MACD stays negative, together suggesting waning but still dominant downside momentum.
A sustained close below the 200-day EMA at $98.36 could result in another test of the rising support trendline near $87.26.
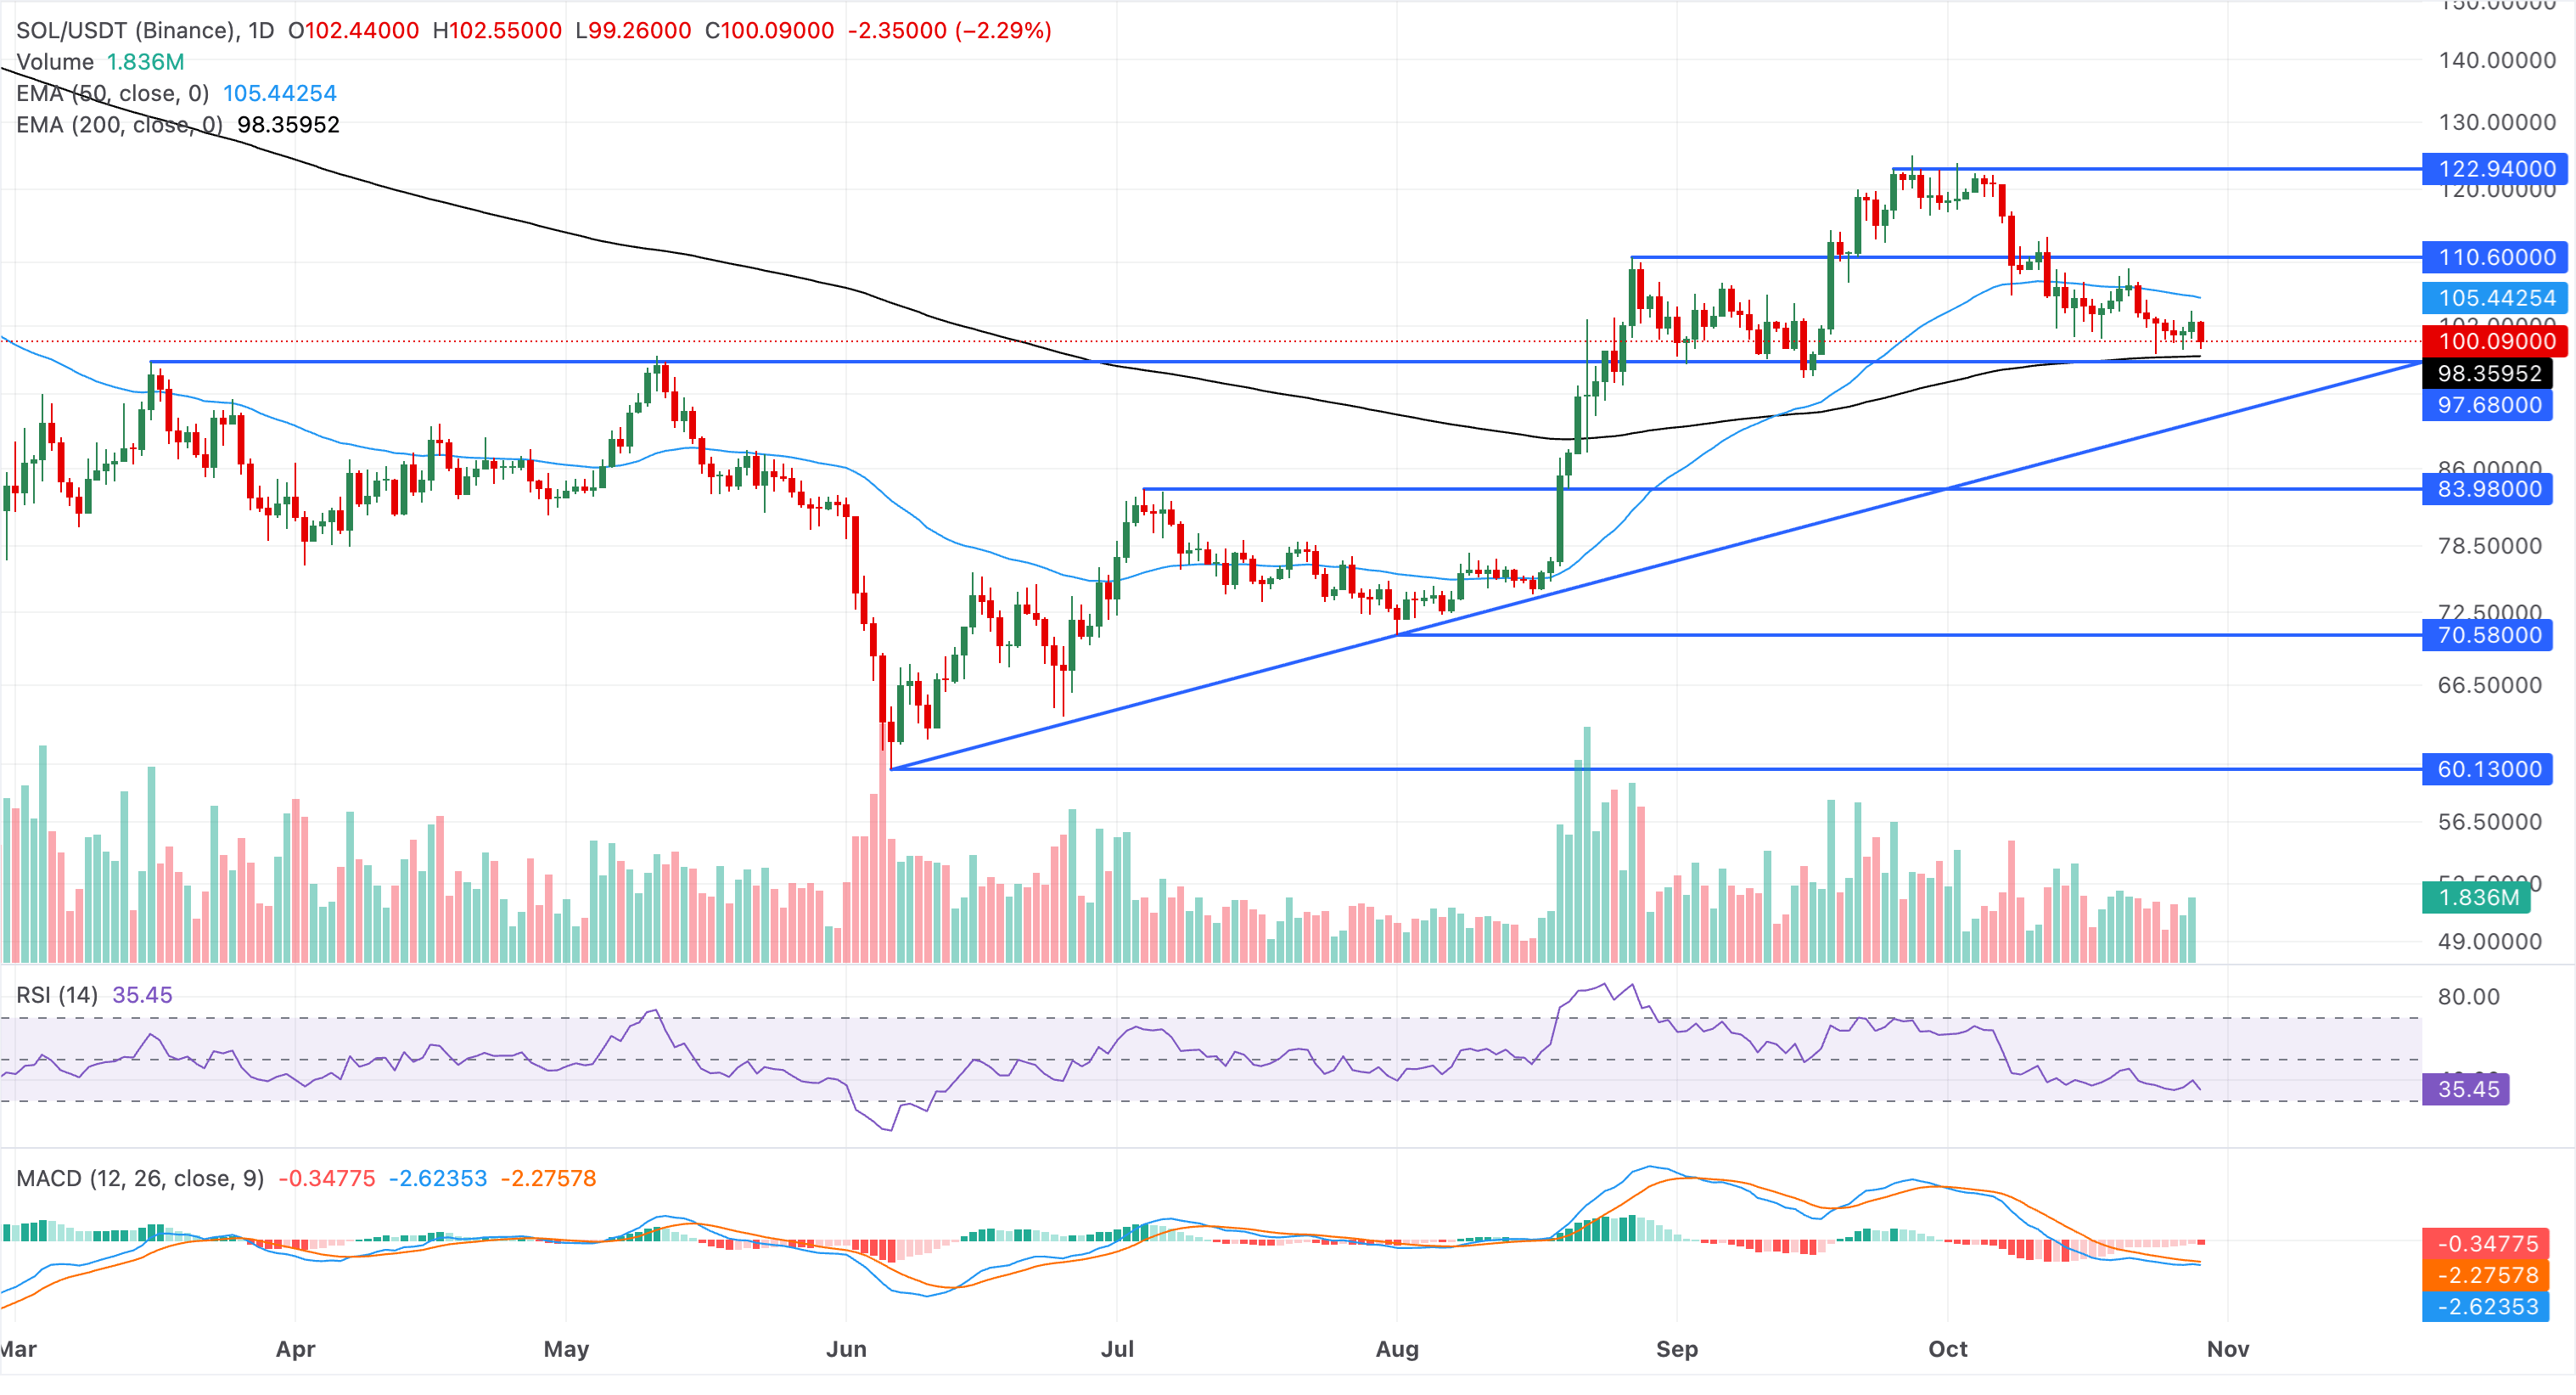
Immediate resistance is located at the 50-day EMA near $105.44, which caps recovery attempts and would need to be reclaimed to open a more constructive bullish phase.
Hyperliquid capped below 50-day EMA
Hyperliquid hovers above $86.00 on Thursday, maintaining a bullish near-term bias. HYPE holds well above the 50-day EMA at $81.82 and the 200-day EMA at $67.77, keeping the broader uptrend intact despite recent volatility.
Momentum conditions are constructive, with the RSI near 59 and the MACD in positive territory, hinting that buyers remain in control.
The immediate resistance for HYPE aligns with the September 3 high around $88.14, which could open the path toward the September 23 high around $98.30 and the $100 psychological threshold.
On the downside, immediate support is defined by the 50-day EMA near $81.82. Below that, the longer-term bullish structure is supported by the rising trendline around $76.07 and the 200-day EMA at $67.77, with deeper pullbacks expected to attract dip-buying interest.
(The technical analysis of this story was written with the help of an AI tool. Know more.)
บทความแนะนำ


