


Crypto Today: Bitcoin, Ethereum, XRP recover ahead of Fed decision
- Bitcoin builds recovery momentum, trading above $81,000 as attention turns to upcoming Fed interest rate decision.
- Ethereum gains for the second consecutive day, backed by rising momentum indicators.
- XRP bulls push to regain trend control, as the MACD indicator teases a buy signal.
Bitcoin (BTC) has renewed its advance above $81,000 on Wednesday, lifting sentiment across the cryptocurrency market ahead of the upcoming Federal Reserve’s (Fed) interest rate decision.
Ethereum (ETH) follows in Bitcoin’s footsteps, rising toward $2,400 as bulls appear to increase exposure. Ripple (XRP) is similarly edging higher above $1.33, backed by improving momentum indicators.
Crypto market advances ahead of Fed decision
The Federal Open Market Committee (FOMC) will later on Wednesday announce its interest rate decision amid heightened inflation concerns and elevated Oil and energy prices amid sticky geopolitical tensions in the Middle East.
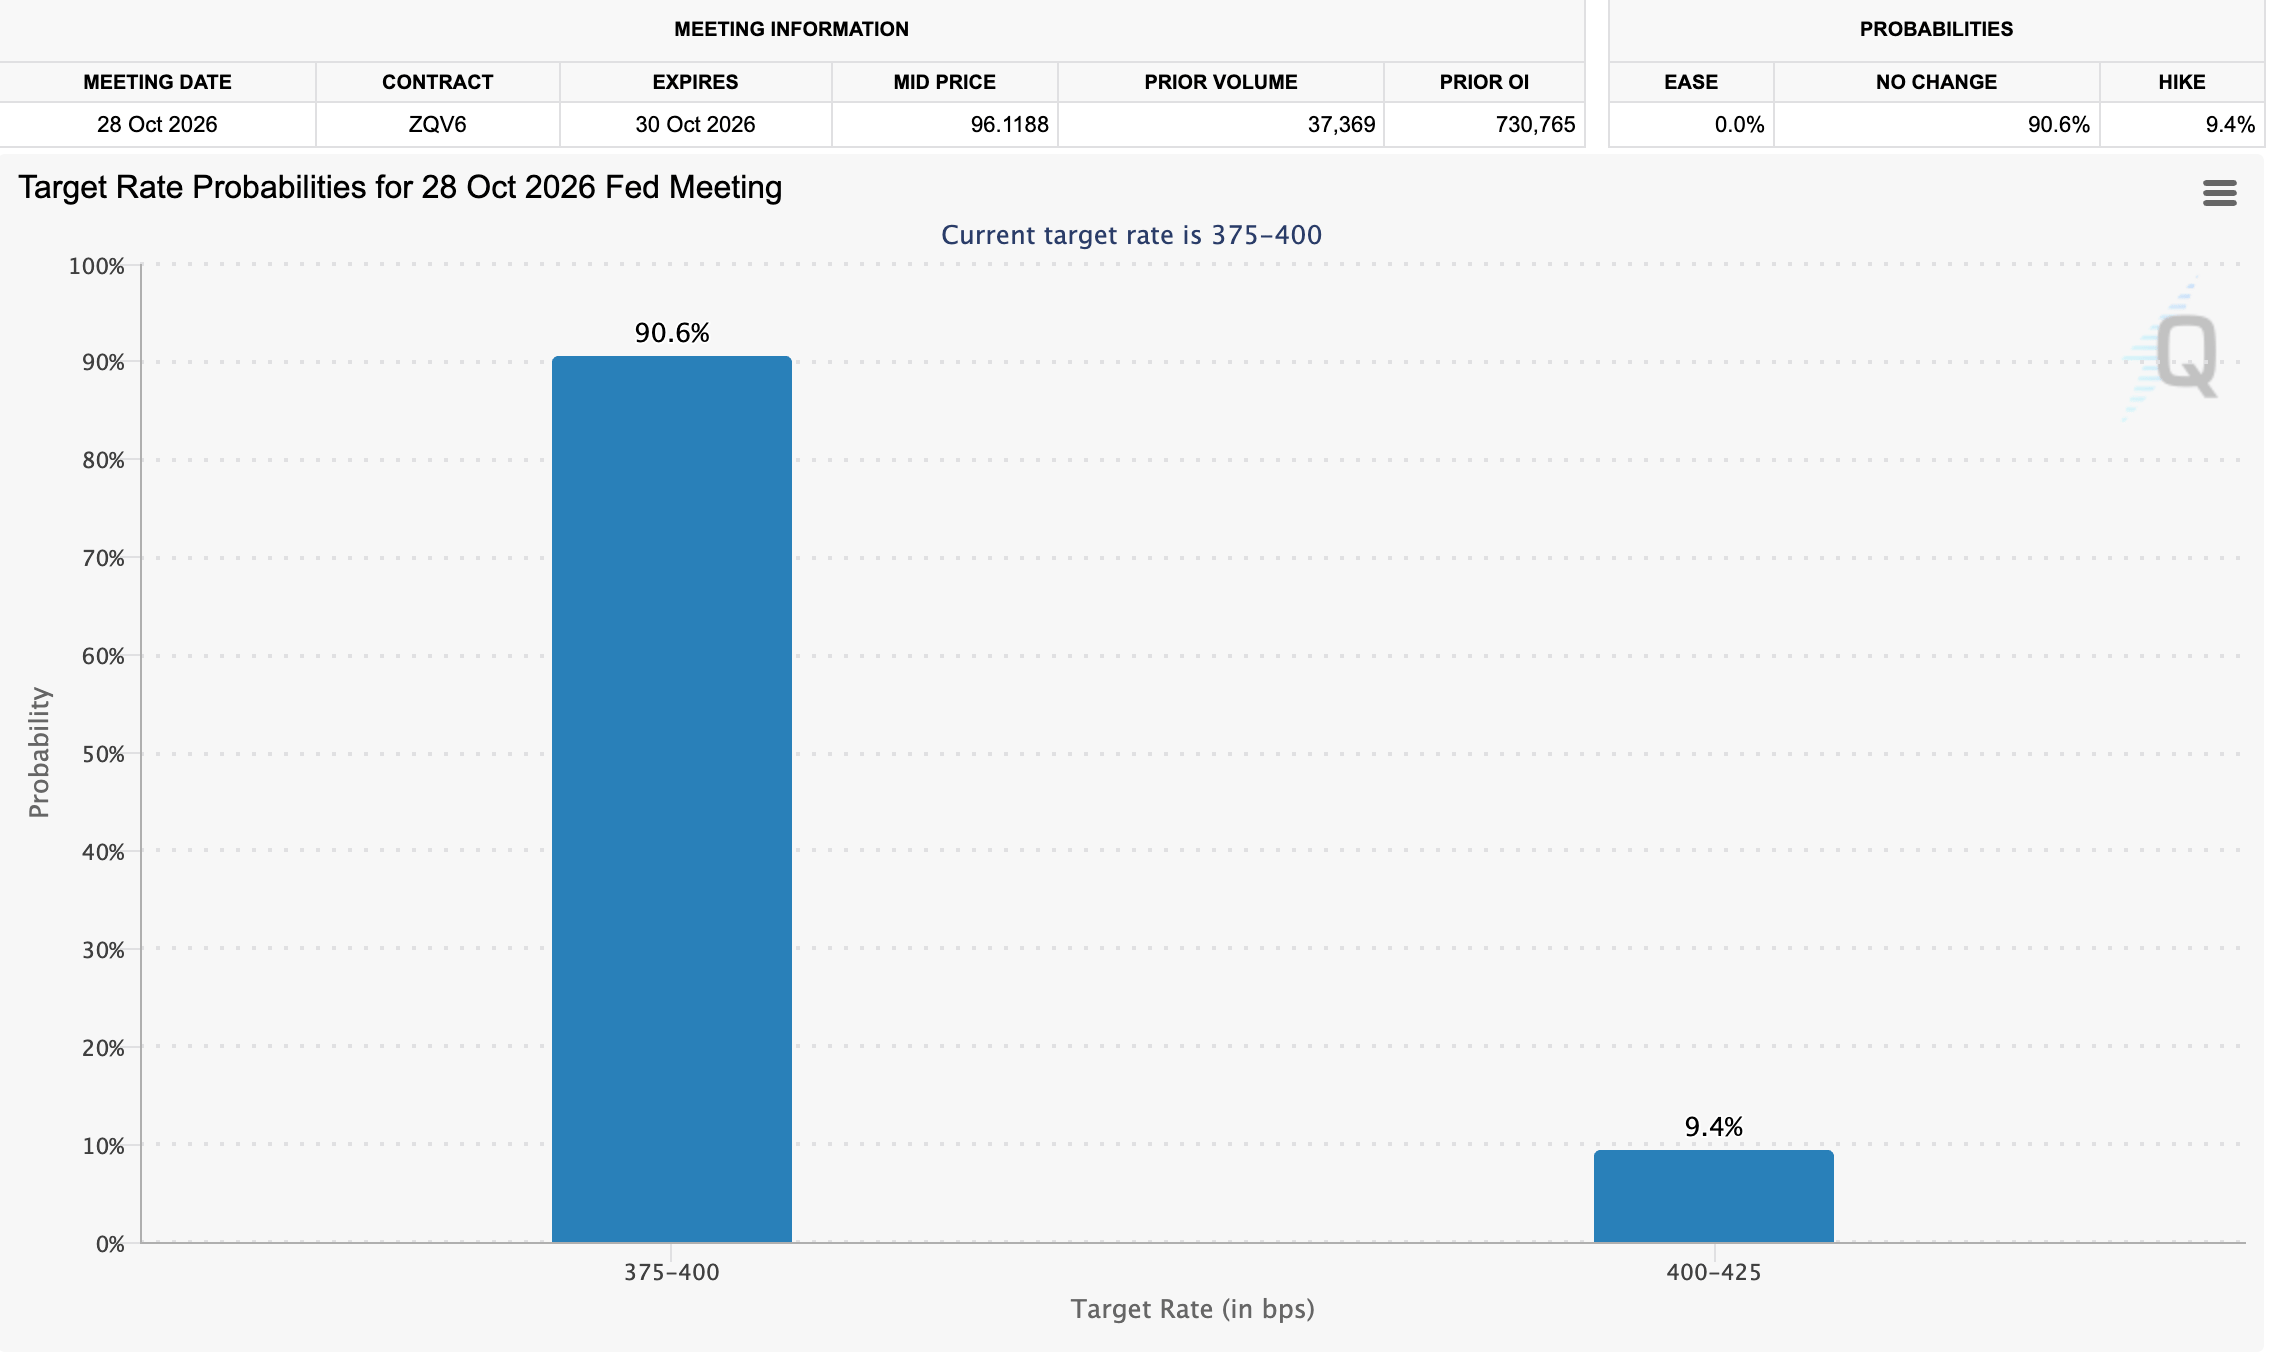
Although the central bank is widely expected to keep interest rates unchanged (91% odds per the CME’s FedWatch Tool), traders will focus on Fed Chair Kevin Warsh's post-meeting press conference, searching for clues on policy direction.
Persistent price pressures, with inflation above the 2% long-term target, remain one of the Fed’s primary pain points. Warsh consistently emphasized the regulator’s determination to bring inflation down. Nonetheless, the US economy remains resilient.
“This is a nervy week for crypto. In the space of three days, traders face a Fed rate decision, results from the biggest tech companies in the world, and around $12 billion worth of bitcoin bets expiring on Friday,” Ian Weisberger, Co-founder and CEO of CoinRoutes, said in an emailed commentary, adding, “Then the US midterms land next Tuesday.”
Technical analysis: Bitcoin attempts recovery
Bitcoin trades at $81,494, consolidating in the upper half of its recent Bollinger Bands envelope with a broadly neutral near-term bias. Price holds above the 50-day Exponential Moving Average (EMA) at $80,831, which lends underlying support, but it remains just under the Bollinger middle band at $81,941, suggesting upside momentum is tentative.
The Relative Strength Index (RSI) at 48 sits close to the neutral line, while the Moving Average Convergence Divergence (MACD) stays in negative territory, hinting that bullish pressure is not yet dominant.
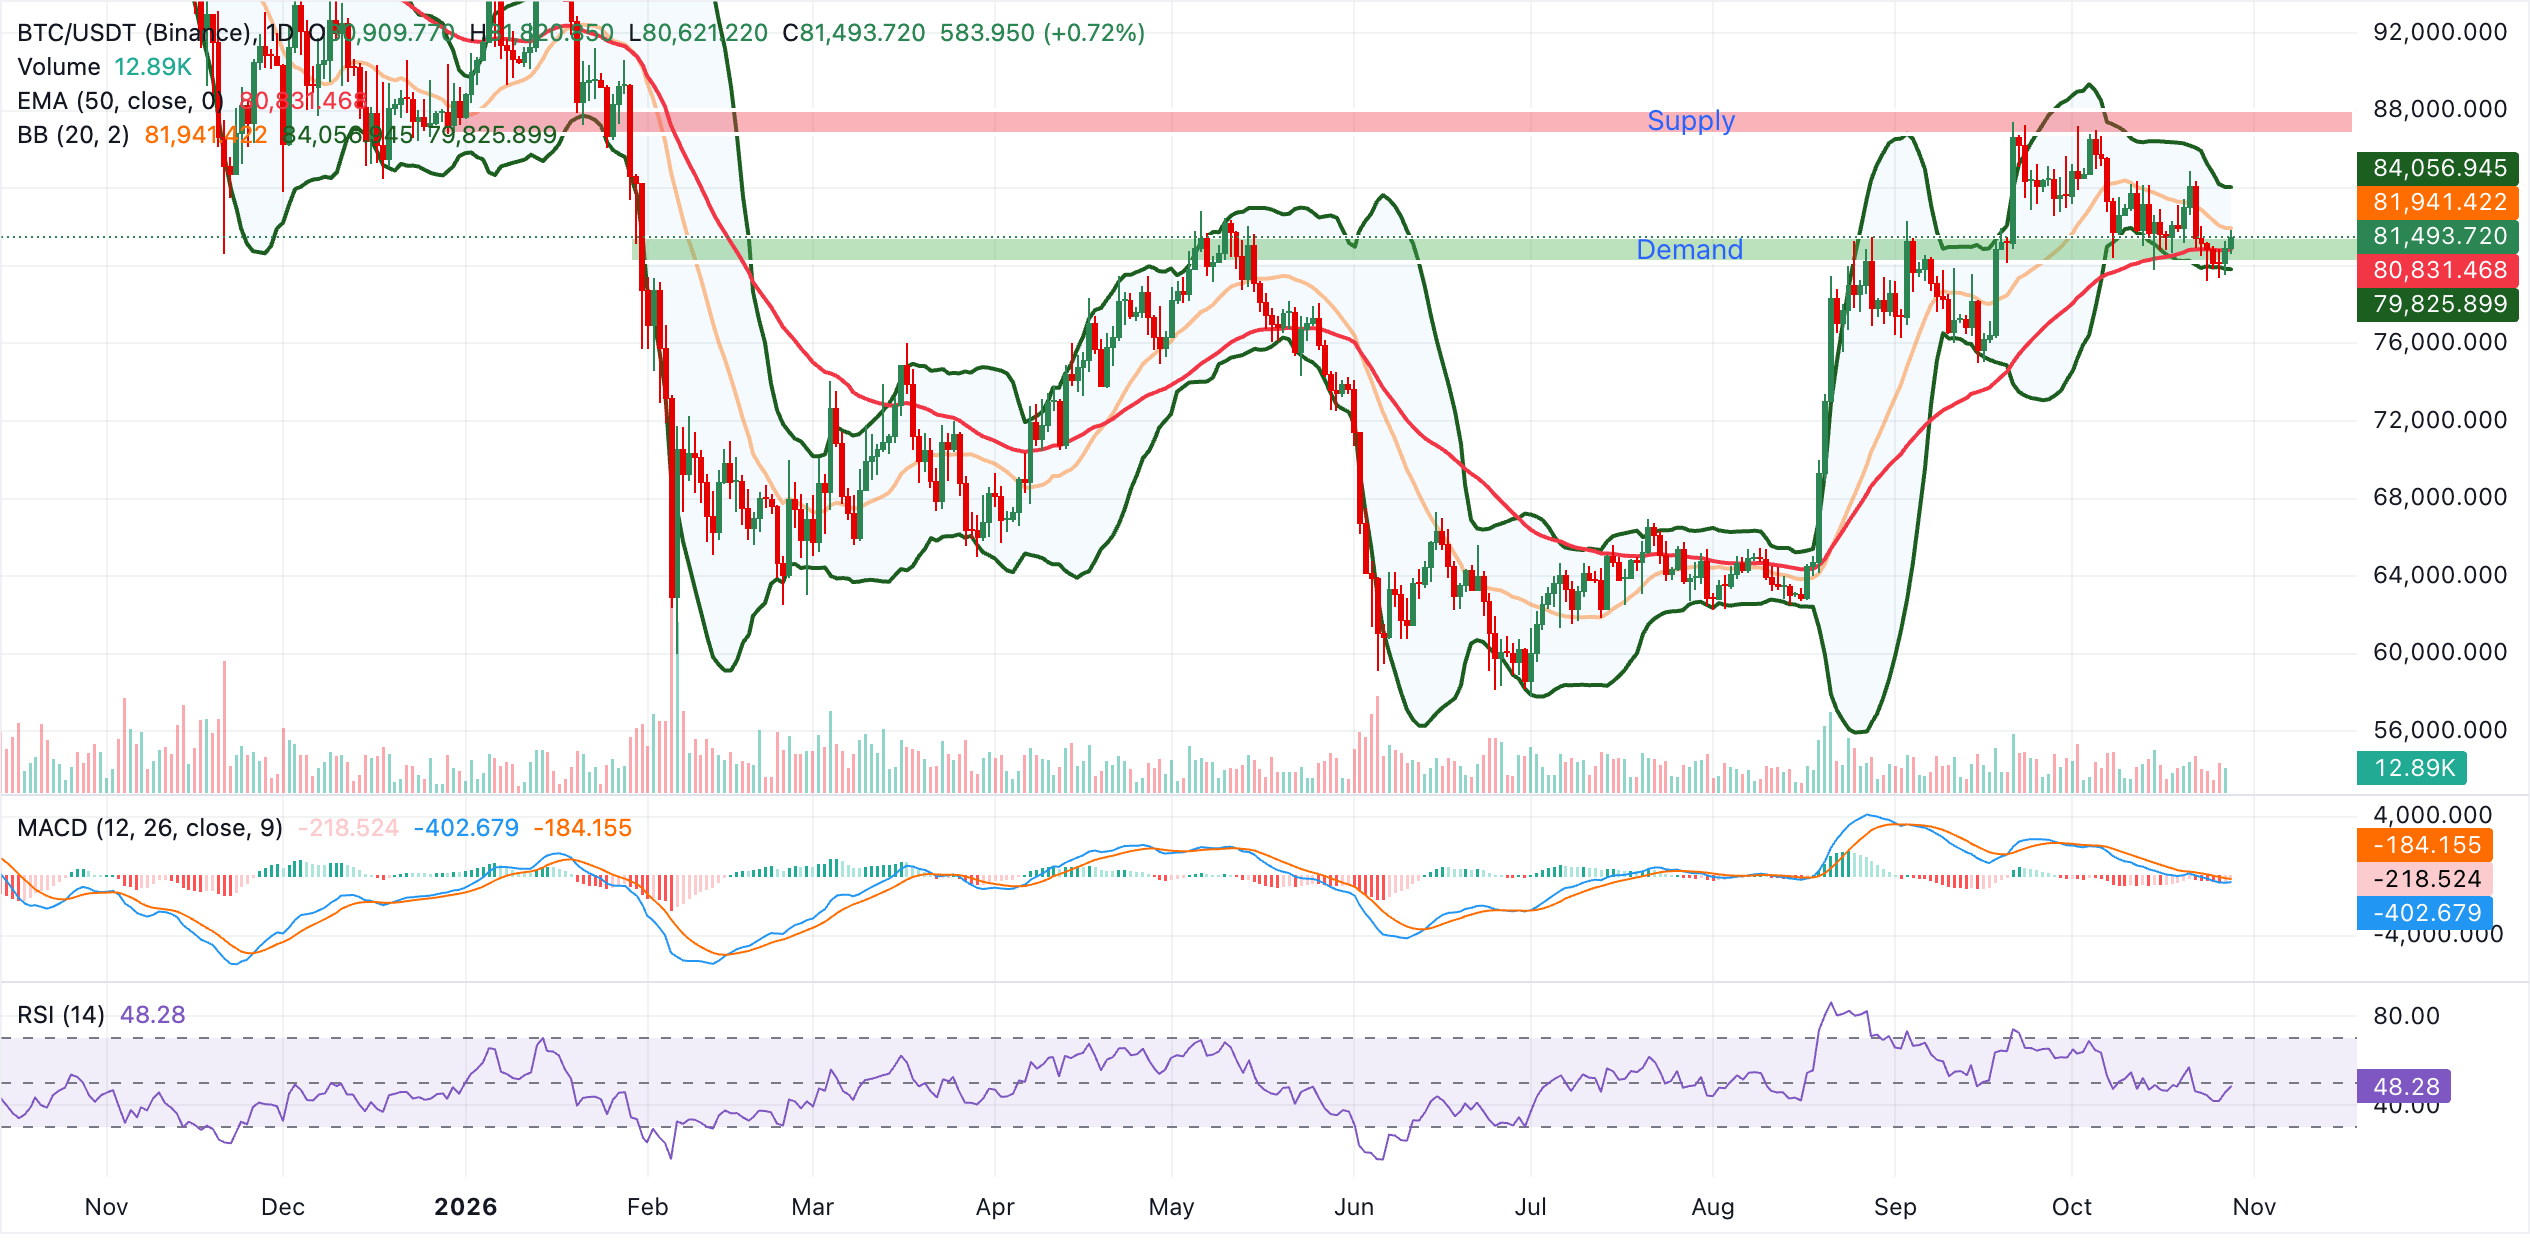
Initial resistance is the Bollinger middle band around $81,941, and a sustained break above this level would expose the upper Bollinger band near $84,056 as the next hurdle. On the downside, immediate support is the 50-day EMA around $80,831, with the lower Bollinger band near $79,826 coming into play on a deeper pullback, where buyers would be expected to show more decisive interest if the current consolidation resolves lower.
Technical analysis: Ethereum bulls stage a comeback
Ethereum trades at $2,374, keeping a cautious bearish bias despite rising for the second straight day. The spot price sits below the Bollinger middle band around $2,421 and the 50-day EMA near $2,452.
At the same time, the pair holds just above an upward-sloping support trendline near $2,369 and above the lower Bollinger Band at roughly $2,305, indicating that while the broader structure is soft, sellers are not in full control.
The RSI near 41 underscores subdued bullish conviction, and although the MACD remains negative, its contracting downside readings suggest that bearish momentum is starting to wane rather than accelerate.
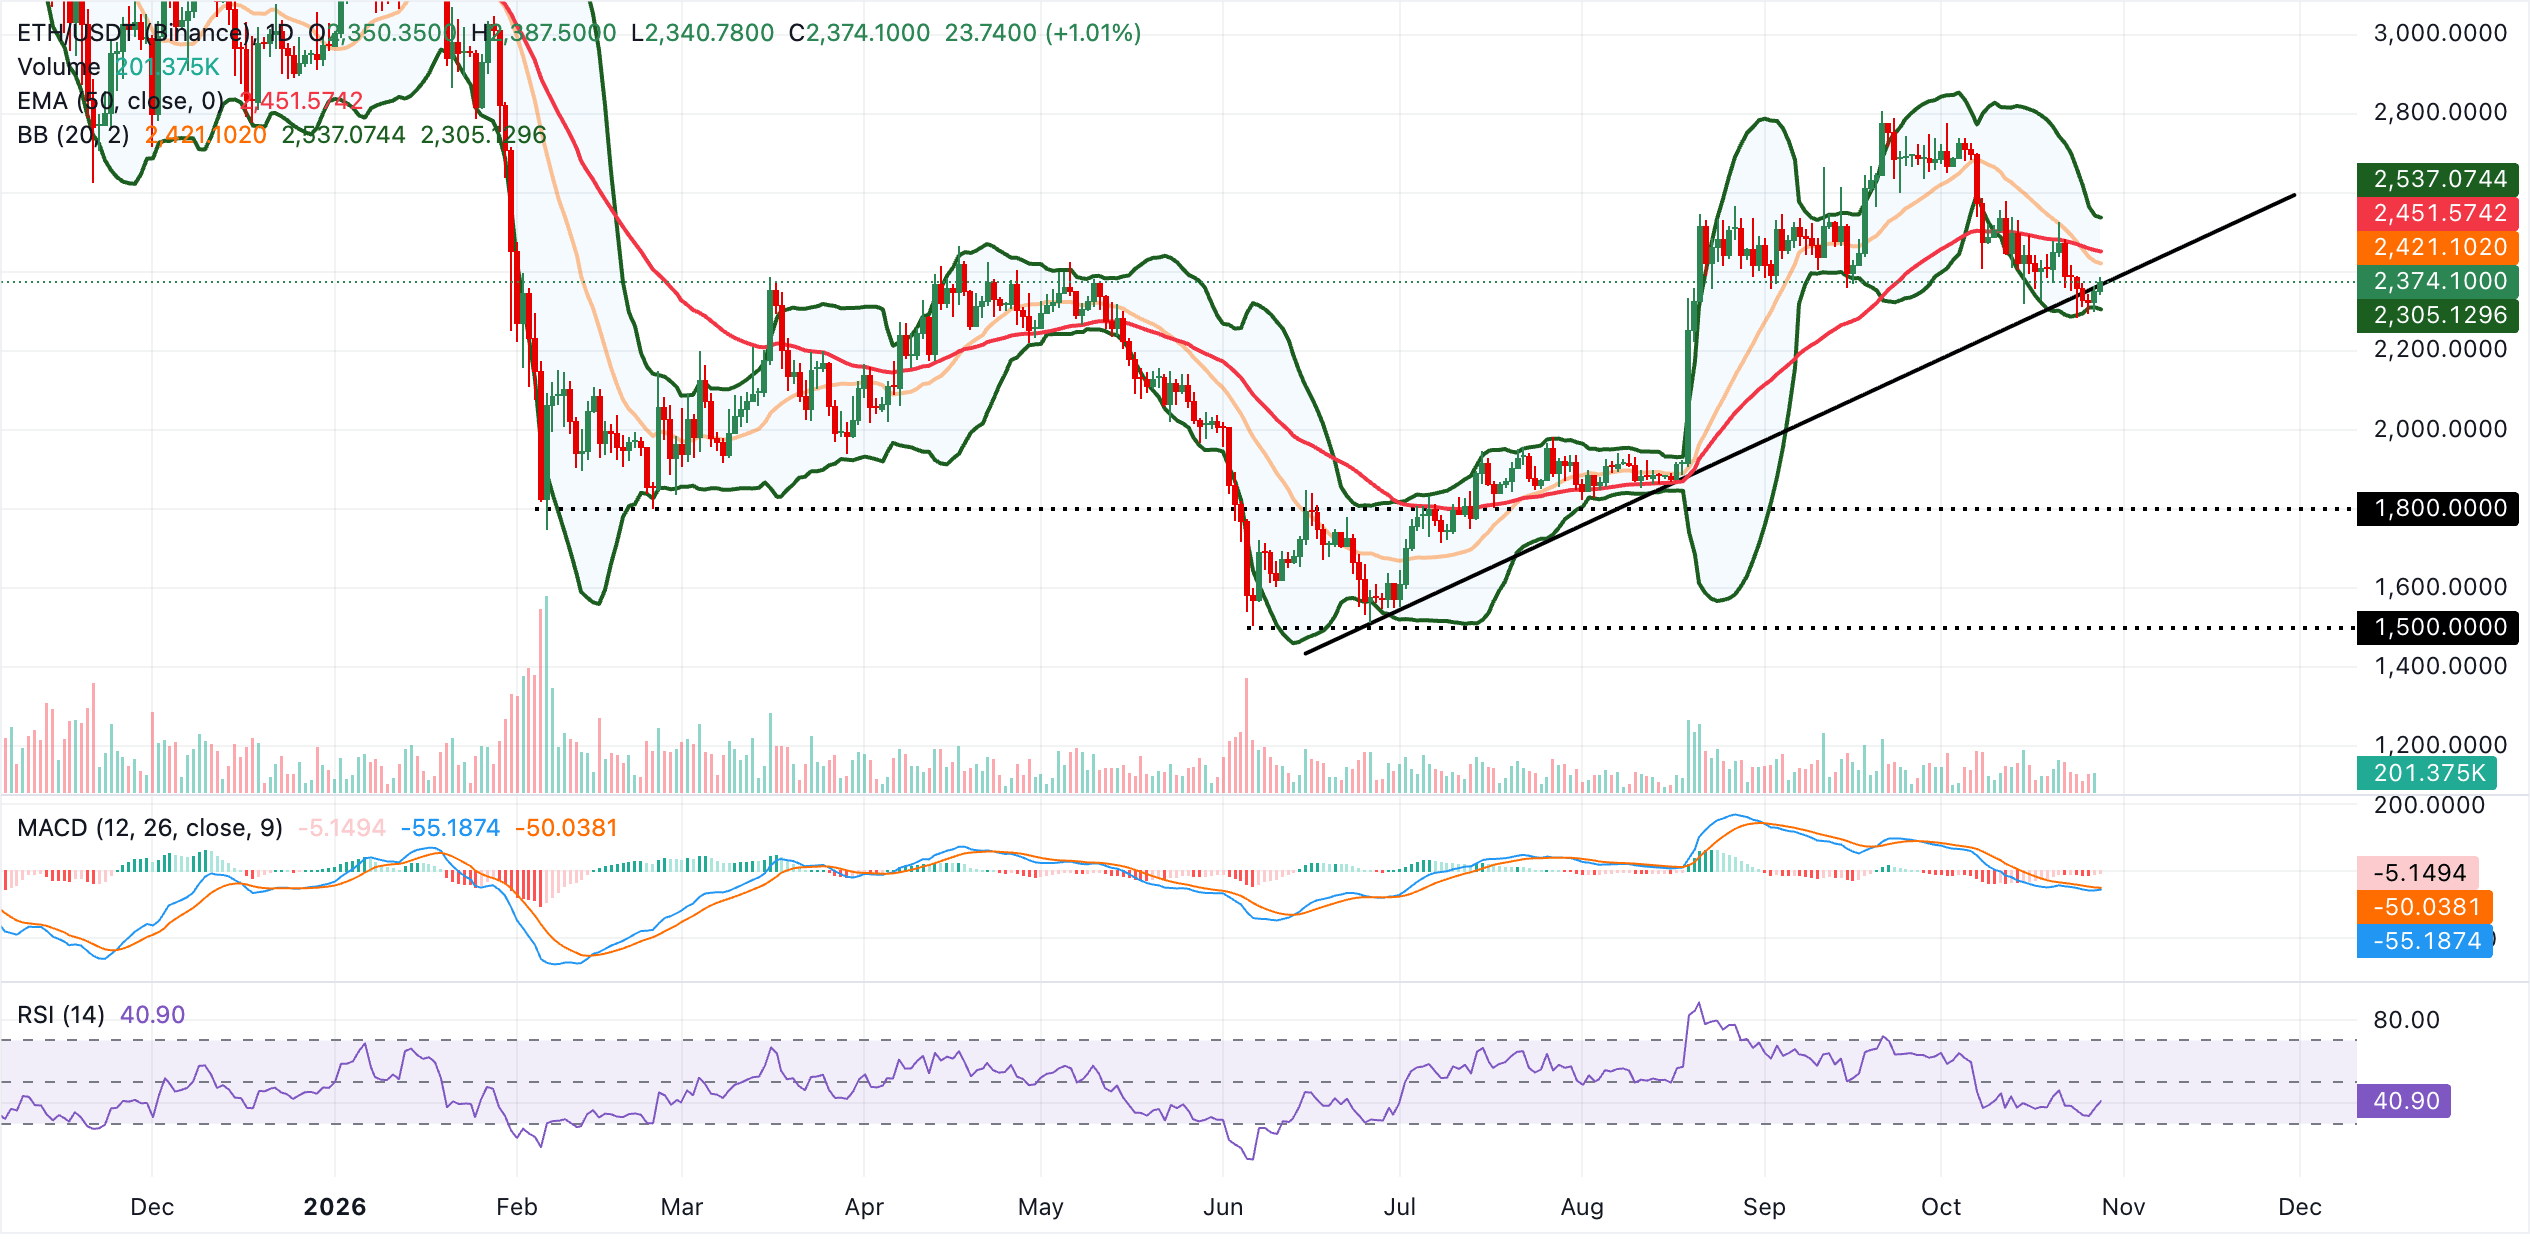
Initial resistance emerges at the Bollinger Band middle layer around $2,421, with a sustained break needed to open the way toward the 50-day EMA near $2,452. Beyond that, the upper Bollinger Band around $2,537 marks a more ambitious barrier where rallies could stall. On the downside, immediate support lies at the reclaimed trendline zone near $2,369, ahead of the lower Bollinger Band support around $2,305, where a daily close below would likely expose ETH to a deeper corrective phase.
Technical analysis: XRP bulls defend lifeline support
XRP trades above $1.33 as bulls tighten their grip, aiming to take back trend control. Still, the pair remains capped in the near term, with price sitting just under the 20-day Bollinger middle band around $1.33 and holding below the 50-day EMA near $1.36, keeping the broader tone mildly bearish despite a marginally positive MACD reading.
The RSI around 46 suggests directionless momentum, hinting at consolidation rather than an impulsive breakout, while the long-standing downward resistance trendline, projected from above $1.70, continues to dominate the medium-term structure.
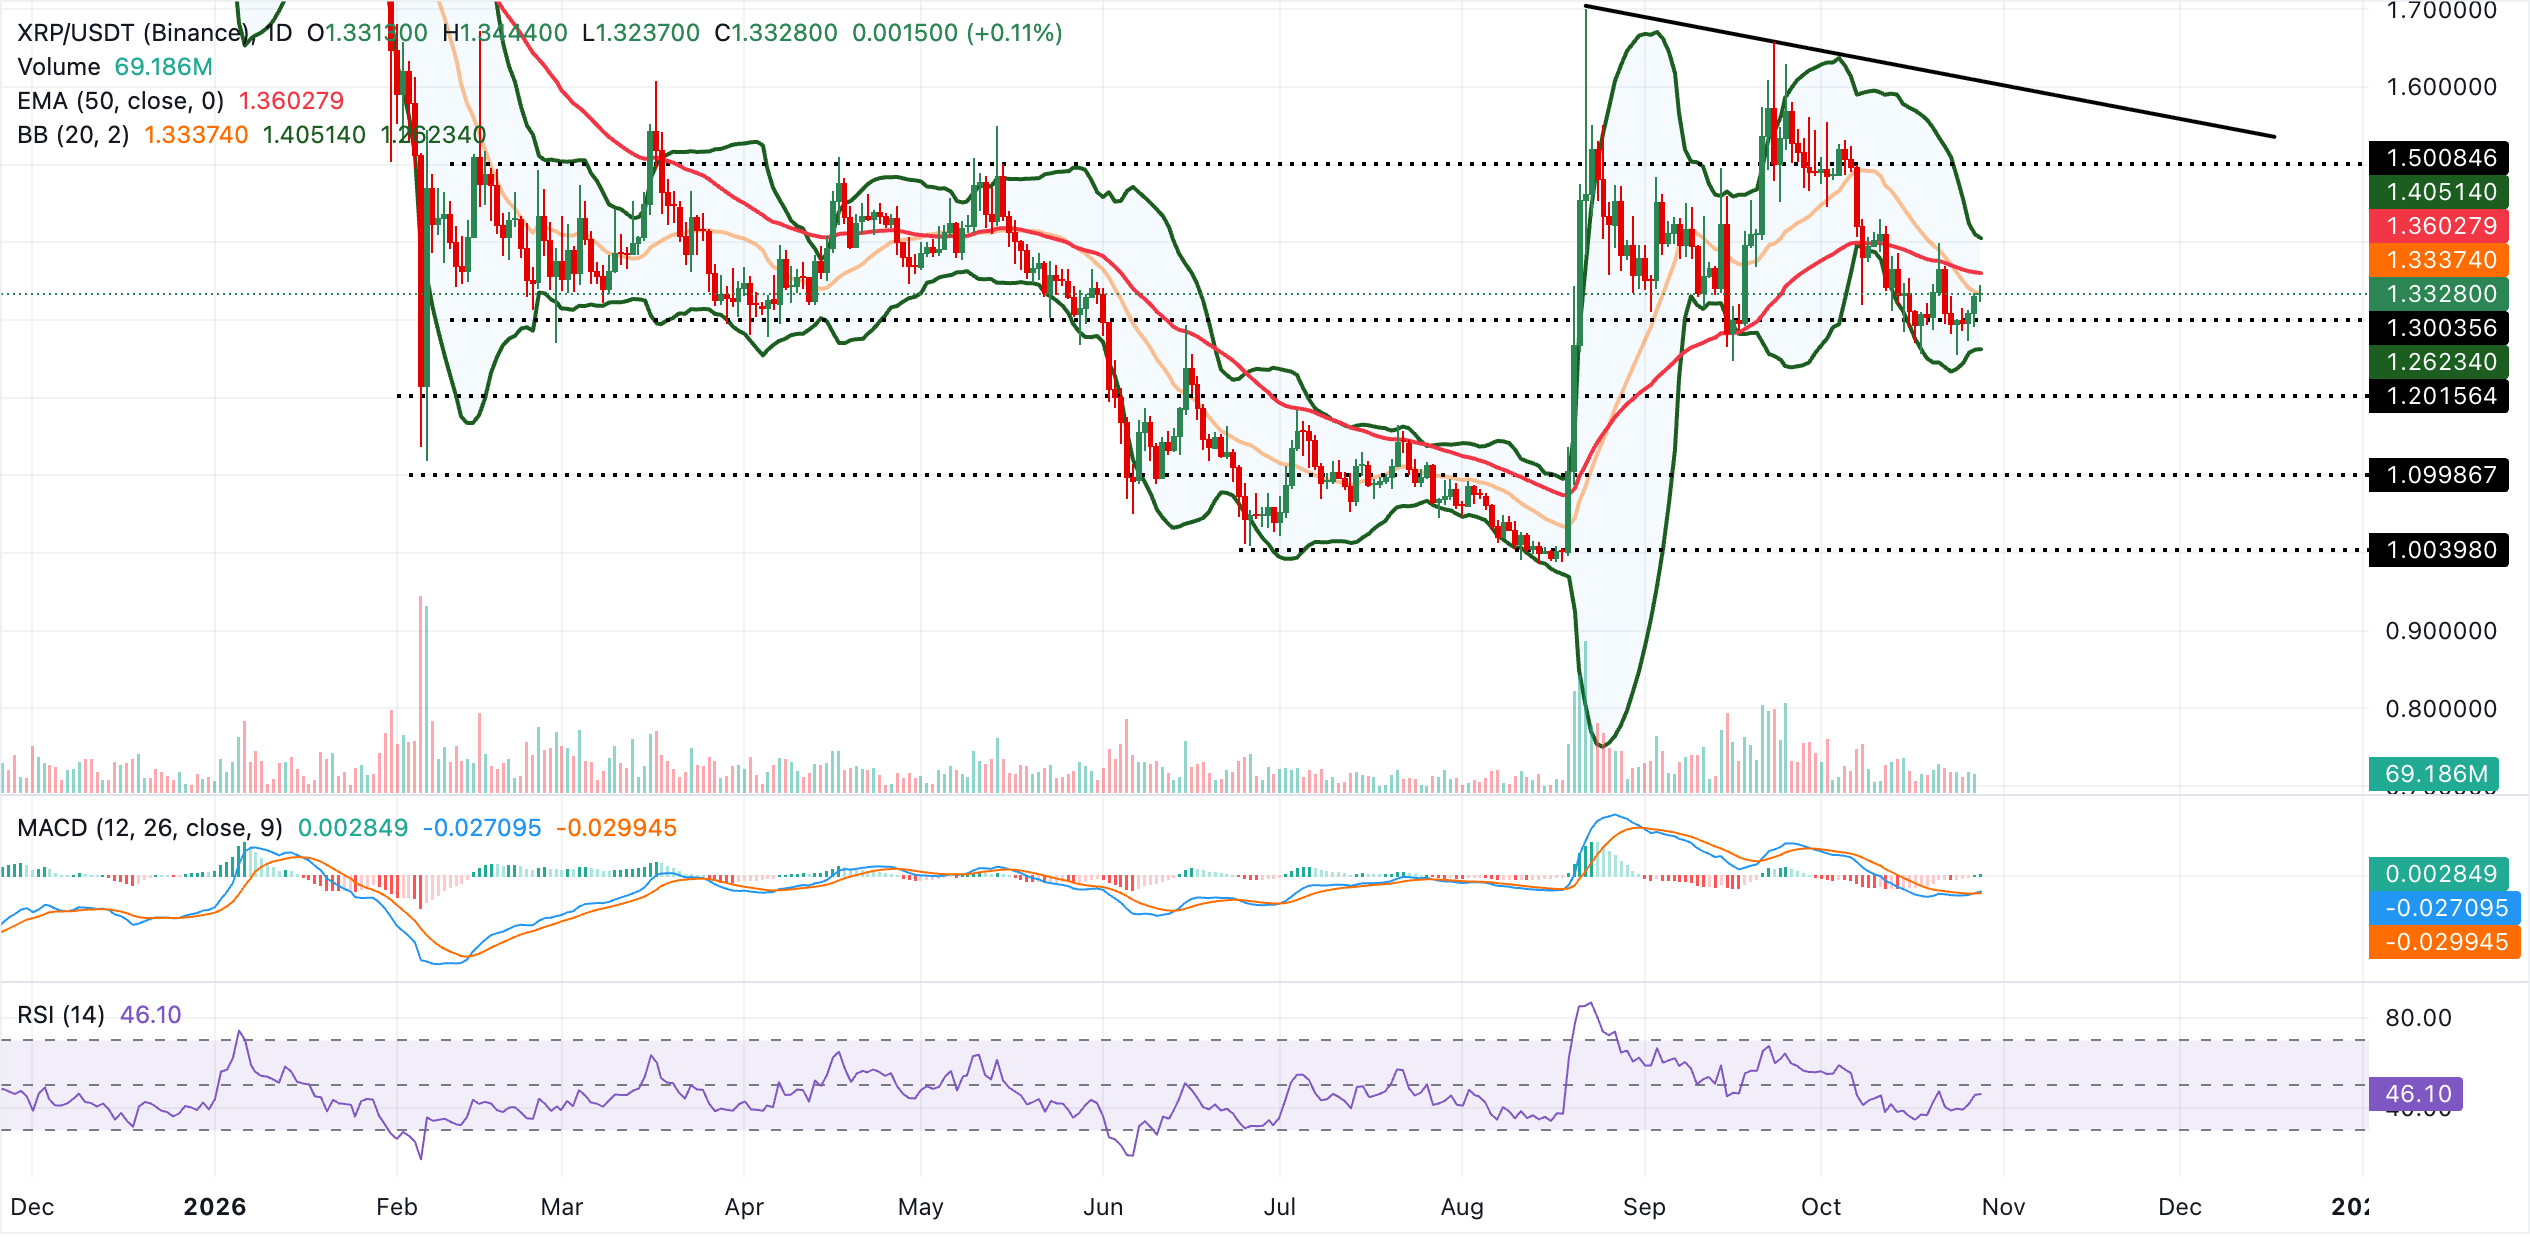
Initial resistance is the Bollinger middle band at $1.33, and a daily close above this pivot would expose the 50-day EMA near $1.36, followed by the upper Bollinger band around $1.41 as the next bullish target. On the downside, the first notable technical floor appears at the lower Bollinger band near $1.26. A break would likely re-energize sellers and reopen the path toward deeper retracement within the prevailing downtrend channel defined by the descending resistance line.
(The technical analysis of this story was written with the help of an AI tool. Know more.)
Bitcoin, altcoins, stablecoins FAQs
Bitcoin is the largest cryptocurrency by market capitalization, a virtual currency designed to serve as money. This form of payment cannot be controlled by any one person, group, or entity, which eliminates the need for third-party participation during financial transactions.
Altcoins are any cryptocurrency apart from Bitcoin, but some also regard Ethereum as a non-altcoin because it is from these two cryptocurrencies that forking happens. If this is true, then Litecoin is the first altcoin, forked from the Bitcoin protocol and, therefore, an “improved” version of it.
Stablecoins are cryptocurrencies designed to have a stable price, with their value backed by a reserve of the asset it represents. To achieve this, the value of any one stablecoin is pegged to a commodity or financial instrument, such as the US Dollar (USD), with its supply regulated by an algorithm or demand. The main goal of stablecoins is to provide an on/off-ramp for investors willing to trade and invest in cryptocurrencies. Stablecoins also allow investors to store value since cryptocurrencies, in general, are subject to volatility.
Bitcoin dominance is the ratio of Bitcoin's market capitalization to the total market capitalization of all cryptocurrencies combined. It provides a clear picture of Bitcoin’s interest among investors. A high BTC dominance typically happens before and during a bull run, in which investors resort to investing in relatively stable and high market capitalization cryptocurrency like Bitcoin. A drop in BTC dominance usually means that investors are moving their capital and/or profits to altcoins in a quest for higher returns, which usually triggers an explosion of altcoin rallies.
บทความแนะนำ


