

Solana Price Forecast: ETF inflows, bullish derivatives signal more upside

แหล่งที่มา Fxstreet
  • Solana price steadies at $78 on Wednesday, up over 2% so far this week.
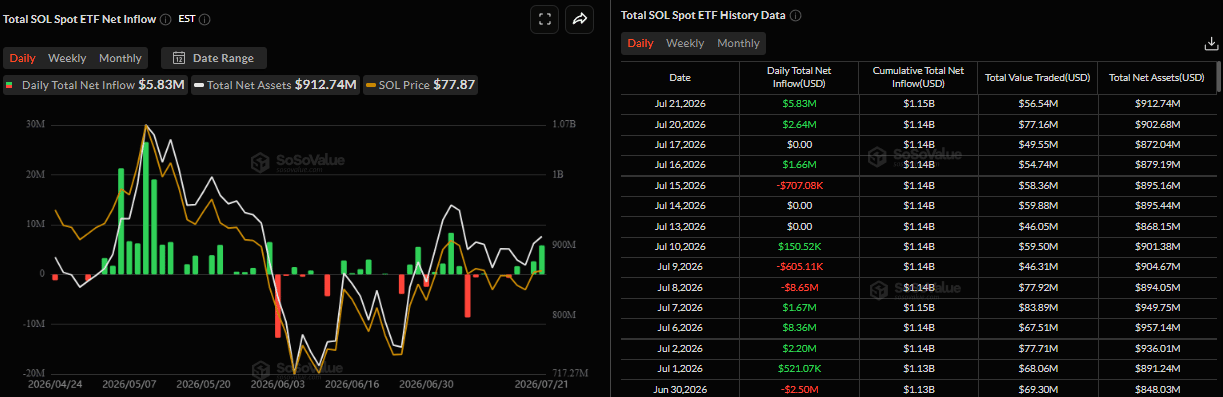
  • US-listed spot ETFs recorded an inflow of $5.83 million on Tuesday, marking the second consecutive day of inflow this week.
  • Derivatives data backs the bullish sentiment, with long bets rising among traders.

Solana (SOL) steadies at $78 on Wednesday, up over 2% so far this week. Institutional demand shows positive signs with SOL spot Exchange Traded Funds (ETFs) recording a second consecutive day of inflow this week. In addition, strengthening derivatives metrics support further gains ahead.

Institutional demand shows a bullish bias

SoSoValue data shows that spot ETFs recorded an inflow of $5.83 million on Tuesday, the highest single-day inflow since July 6 and marking the second consecutive day of inflows this week. If this inflow continues and strengthens throughout the week, the SOL price could rally.
On the derivatives front, rising long bets among the traders further support the bullish bias. CoinGlass’ long-to-short ratio reads 1.12 on Wednesday, nearing the highest level over a month. A ratio below 1 indicates bullish sentiment, as traders bet that asset prices will rise. 
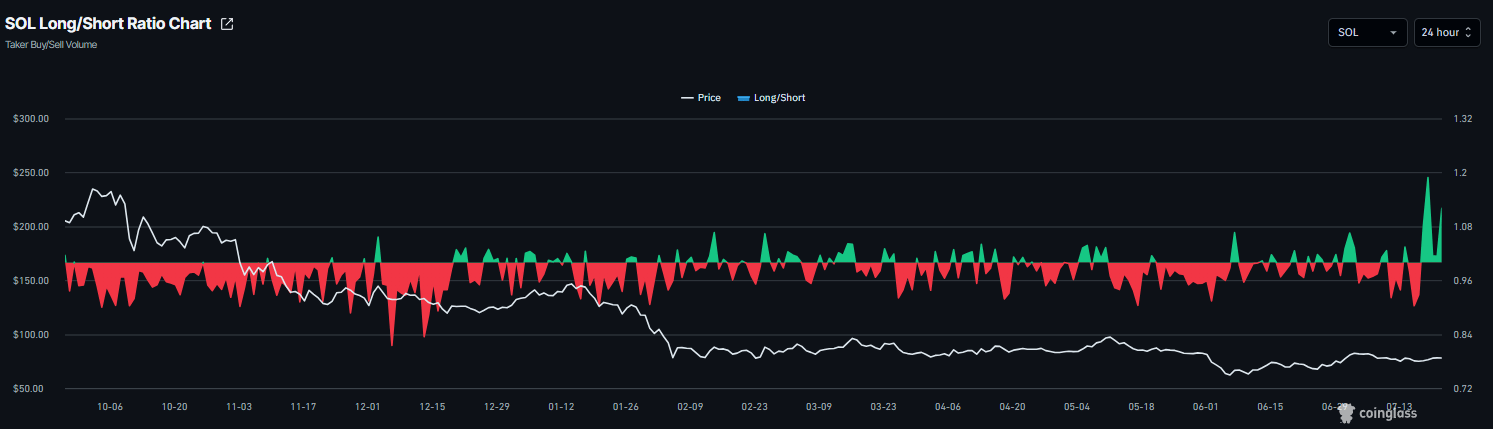
Solana long-to-short ratio chart. Source: Coinglass

Solana Price Forecast: Closes above 50-day EMA

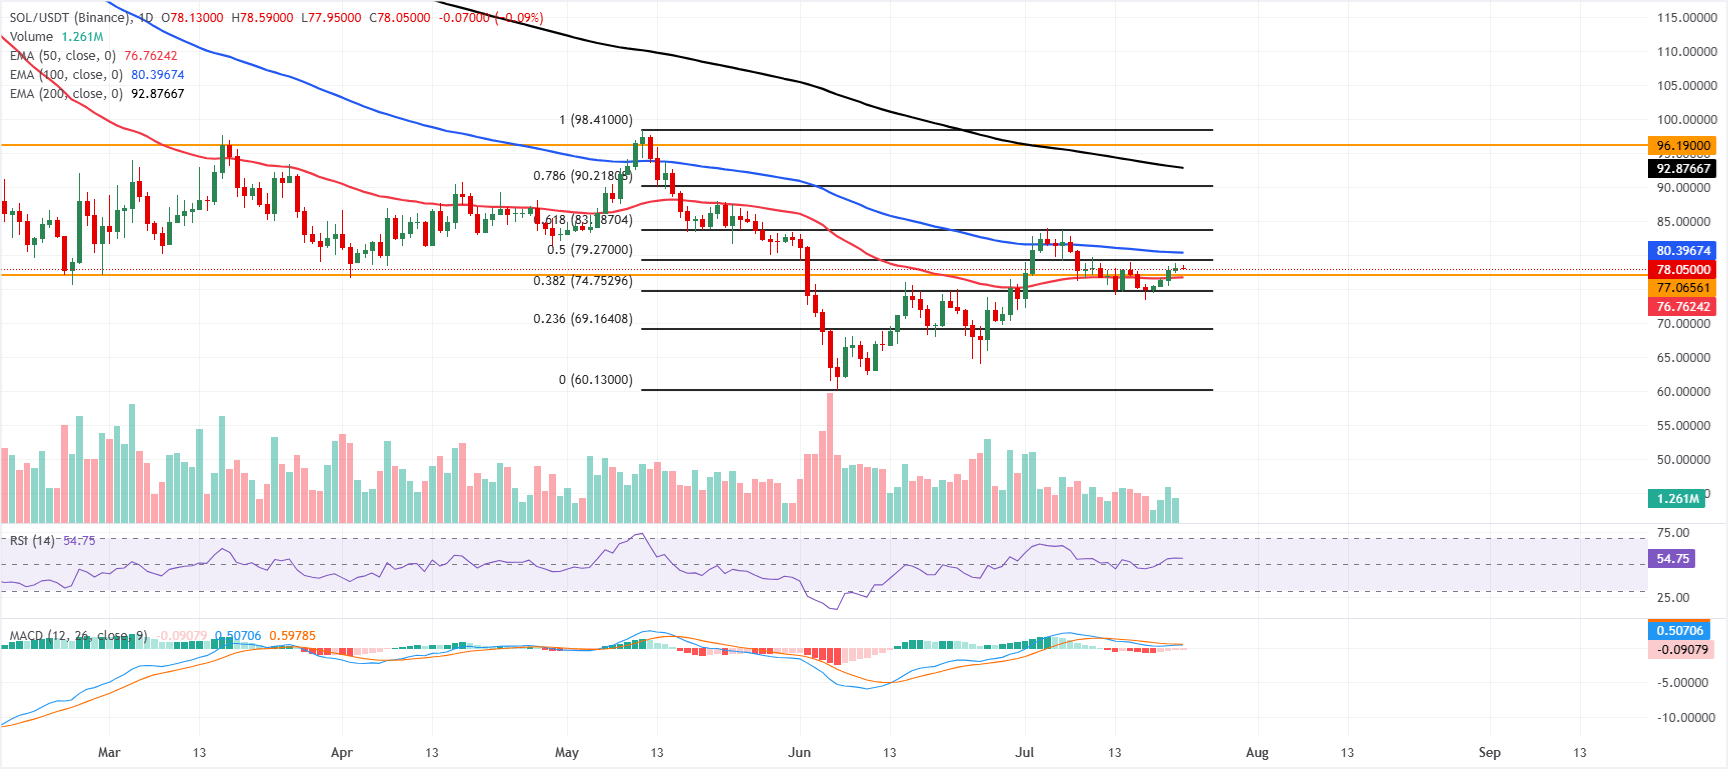
Solana price trades at $78.05 on Wednesday, maintaining a capped near-term tone as it holds below the 100-day Exponential Moving Average (EMA) at $80.39 and well under the 200-day EMA at $92.87. Price remains just above a local support cluster defined by the 50-period EMA at $76.76 and the horizontal line at $77.06, suggesting ongoing consolidation rather than a clear bullish breakout. 

The Relative Strength Index (RSI) at 54 remains in neutral-to-positive territory. At the same time, the Moving Average Convergence Divergence (MACD) indicator is still slightly negative, suggesting that upside attempts are tentative and vulnerable to renewed selling pressure, with these higher averages capping the pair.

On the topside, immediate resistance is seen at the 50% retracement at $79.27, followed by the 100-day EMA at $80.39; a daily close above this band would open the way toward the 61.8% Fibonacci retracement at $83.78.

On the downside, initial support is found at the horizontal line at $77.06, reinforced by the 50-day EMA at $76.76; a break below this zone would expose the 38.2% Fibonacci retracement at $74.75, with deeper floors at $69.16 and $60.13 only likely to be tested if sellers regain firm control of the daily trend.
(The technical analysis of this story was written with the help of an AI tool. Know more.)

ข้อจำกัดความรับผิดชอบ: เพื่อการอ้างอิงเท่านั้น ผลการดำเนินงานในอดีตไม่ได้บ่งบอกถึงผลลัพธ์ในอนาคต
placeholder
ข่าวหุ้นวันนี้ น้ำมัน-ยีลด์บีบตลาด แต่ SET ยังมีแรงพยุงจากพลังงานและหุ้นเลือกตัวทันทุกกระแสการเงิน สรุปข่าวเด่น Forex หุ้น ทองคำ คริปโตฯ และเศรษฐกิจรอบวัน วิเคราะห์แนวโน้มตลาดด้วยข้อมูลเชิงลึก อ่านง่าย เข้าใจไว อัปเดตล่าสุดที่นี่
ผู้เขียน  Mitrade
7 เดือน 20 วัน จันทร์
ทันทุกกระแสการเงิน สรุปข่าวเด่น Forex หุ้น ทองคำ คริปโตฯ และเศรษฐกิจรอบวัน วิเคราะห์แนวโน้มตลาดด้วยข้อมูลเชิงลึก อ่านง่าย เข้าใจไว อัปเดตล่าสุดที่นี่
placeholder
ข่าวหุ้นวันนี้ น้ำมันกับยีลด์ยังบีบตลาด หุ้น AI รอสอบงบ ส่วน SET มีแบงก์-พลังงานช่วยพยุงทันทุกกระแสการเงิน สรุปข่าวเด่น Forex หุ้น ทองคำ คริปโตฯ และเศรษฐกิจรอบวัน วิเคราะห์แนวโน้มตลาดด้วยข้อมูลเชิงลึก อ่านง่าย เข้าใจไว อัปเดตล่าสุดที่นี่
ผู้เขียน  Mitrade
เมื่อวาน 06: 20
ทันทุกกระแสการเงิน สรุปข่าวเด่น Forex หุ้น ทองคำ คริปโตฯ และเศรษฐกิจรอบวัน วิเคราะห์แนวโน้มตลาดด้วยข้อมูลเชิงลึก อ่านง่าย เข้าใจไว อัปเดตล่าสุดที่นี่
placeholder
แนวโน้มราคาโลหะเงิน: XAG จะทะลุแนวต้านแนวโน้ม ขณะที่จับตาที่ระดับ $60ราคาของโลหะเงิน (XAG/USD) พุ่งขึ้นมากกว่า 4.50% ในวันอังคาร แตะระดับสูงสุดในรอบห้าวัน ทะลุ $59.00 ขณะที่ผู้ซื้อผลักดันโลหะเงินให้ทดสอบเส้นแนวต้านเทรนด์ไลน์ขาลงใกล้ช่วง $59.65/$50.75 กำลังจะทะลุระดับ $60.00
ผู้เขียน  FXStreet
6 ชั่วโมงที่แล้ว
ราคาของโลหะเงิน (XAG/USD) พุ่งขึ้นมากกว่า 4.50% ในวันอังคาร แตะระดับสูงสุดในรอบห้าวัน ทะลุ $59.00 ขณะที่ผู้ซื้อผลักดันโลหะเงินให้ทดสอบเส้นแนวต้านเทรนด์ไลน์ขาลงใกล้ช่วง $59.65/$50.75 กำลังจะทะลุระดับ $60.00
placeholder
ราคาทองคำพุ่งขึ้นท่ามกลางการโจมตีในสงครามอ่าวและดอลลาร์สหรัฐที่แข็งแกร่งราคาทองคำพุ่งขึ้นในวันอังคารในช่วงเซสชันอเมริกาเหนือ เพิ่มขึ้นมากกว่า 1.50% ท่ามกลางการโจมตีด้วยขีปนาวุธอย่างต่อเนื่องระหว่างสหรัฐฯ และอิหร่าน แม้จะมีความพยายามของตัวกลางในการยุติสงคราม XAU/USD ซื้อขายที่ $4,071
ผู้เขียน  FXStreet
5 ชั่วโมงที่แล้ว
ราคาทองคำพุ่งขึ้นในวันอังคารในช่วงเซสชันอเมริกาเหนือ เพิ่มขึ้นมากกว่า 1.50% ท่ามกลางการโจมตีด้วยขีปนาวุธอย่างต่อเนื่องระหว่างสหรัฐฯ และอิหร่าน แม้จะมีความพยายามของตัวกลางในการยุติสงคราม XAU/USD ซื้อขายที่ $4,071
placeholder
อัตราเงินเฟ้อ CPI ของสหราชอาณาจักรคาดจะแสดงการลดลงในเดือนมิถุนายน ขณะที่ GBP/USD ไม่สามารถผ่านระดับสูงสุดของเดือนพฤษภาคมได้สำนักงานสถิติแห่งชาติของสหราชอาณาจักร (ONS) จะเผยแพร่ตัวเลขดัชนีราคาผู้บริโภค (CPI) ประจำเดือนมิถุนายนในวันพุธ เวลา 06:00 GMT ซึ่งตัวเลขนี้จะมีความสำคัญต่อตลาด โดยฉันทามติคาดการณ์ว่าแรงกดดันเงินเฟ้อยังคงสูงกว่าตัวเลขเป้าหมายของธนาคารกลางอังกฤษ (BoE) แม้ว่าจะมีการสูญเสียโมเมนตัมเพิ่มเติม
ผู้เขียน  FXStreet
4 ชั่วโมงที่แล้ว
สำนักงานสถิติแห่งชาติของสหราชอาณาจักร (ONS) จะเผยแพร่ตัวเลขดัชนีราคาผู้บริโภค (CPI) ประจำเดือนมิถุนายนในวันพุธ เวลา 06:00 GMT ซึ่งตัวเลขนี้จะมีความสำคัญต่อตลาด โดยฉันทามติคาดการณ์ว่าแรงกดดันเงินเฟ้อยังคงสูงกว่าตัวเลขเป้าหมายของธนาคารกลางอังกฤษ (BoE) แม้ว่าจะมีการสูญเสียโมเมนตัมเพิ่มเติม
ตราสารที่เกี่ยวข้อง
goTop
quote