


Dogecoin Price Forecast: DOGE pulls back as momentum indicators falter
- Dogecoin corrects from its Wednesday peak of $0.0956 amid a broader crypto market decline.
- Momentum indicators decline, signaling a weakening short-term trend.
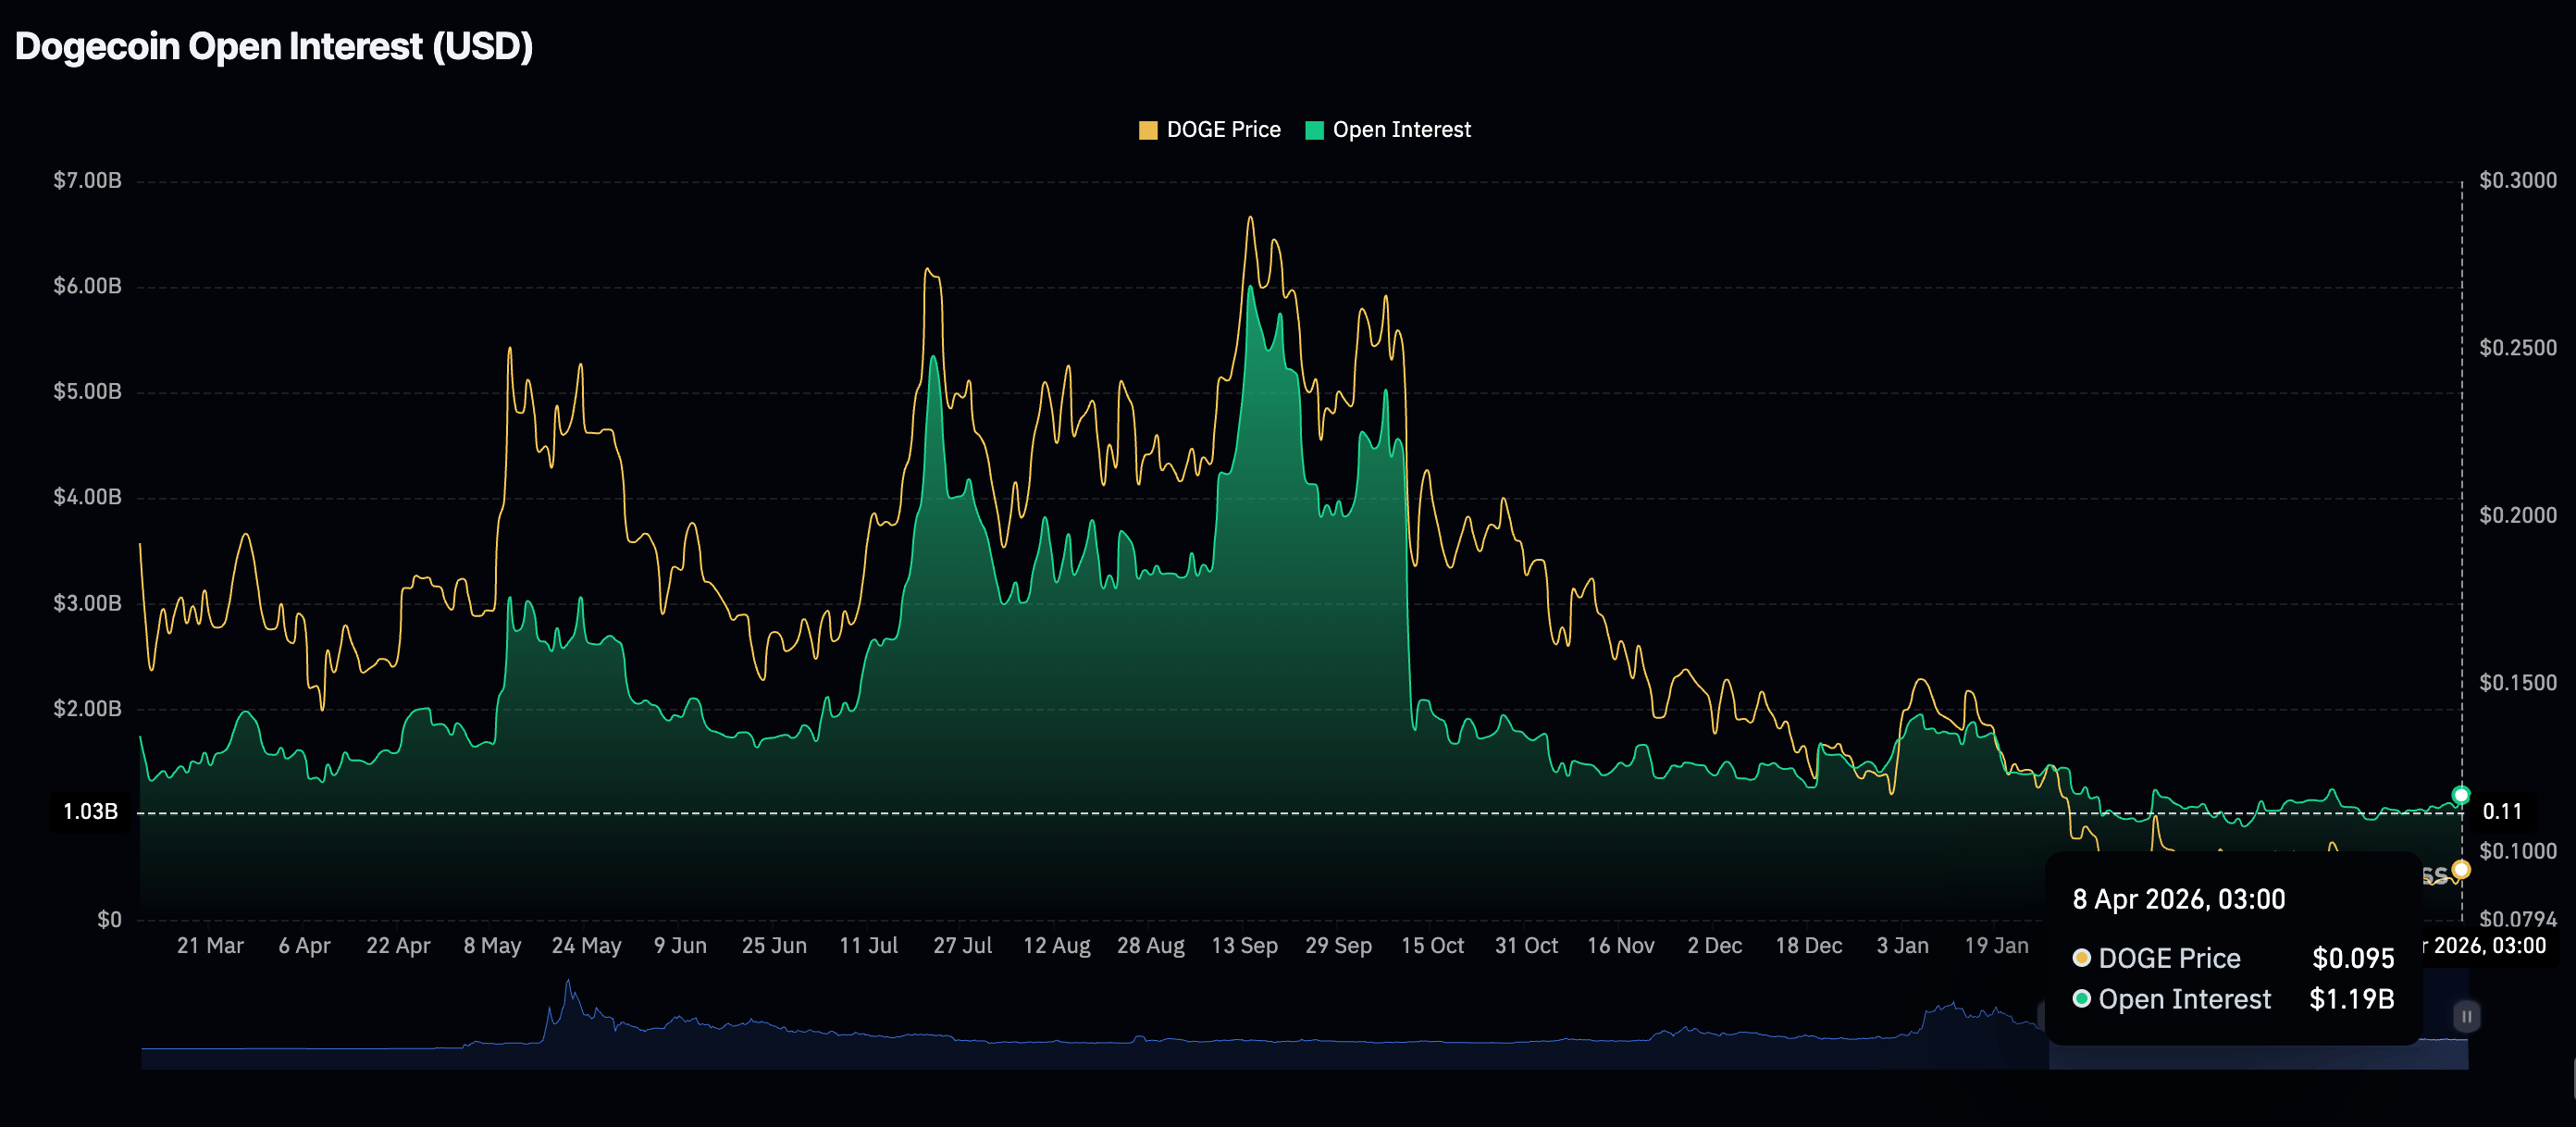
- DOGE eyes support at $0.0900 despite futures Open Interest climbing to $1.19 billion.
Dogecoin (DOGE) edges lower at the time of writing on Wednesday, extending losses from its daily high of $0.0956. A broader outlook shows crypto prices correcting from gains driven by Iran’s tentative ceasefire deal with the United States (US), which saw Bitcoin (BTC) trade above $72,200 and Ethereum (ETH) above $2,200.
Retail demand mildly increases as Dogecoin wobbles
Retail demand for Dogecoin shows signs of a potential comeback, with futures Open Interest (OI) rising to $1.19 billion on Wednesday, from $1.07 billion the previous day. A steady increase in the OI supports a sustainable uptrend as investors increase their risk exposure.
For context, Open Interest previously peaked near $6 billion, coinciding with Dogecoin’s rally to $0.31 and highlighting strong investor risk appetite.
Technical outlook: Dogecoin upside capped amid weak technicals
Dogecoin is trading around $0.0930 as headwinds weigh on the memecoin, possibly due to early profit-taking. Before the current intraday correction, DOGE pushed back above a prior downward trendline, supported by growing risk-on sentiment as reported. The 200 Exponential Moving Average (EMA) caps Dogecoin's upside at $0.094 on the 4-hour chart, reinforcing the pullback from the daily peak of $0.0956.
Meanwhile, DOGE sits on a confluence of support around $0.0923, where the 100 EMA aligns with the broken trendline, while the 50 EMA at $0.0920 adds a secondary floor just beneath. This positioning keeps the broader structure constrained, as the Relative Strength Index (RSI) declines and holds at 54 on the daily chart, while the Moving Average Convergence Divergence (MACD) upholds modest positive momentum.
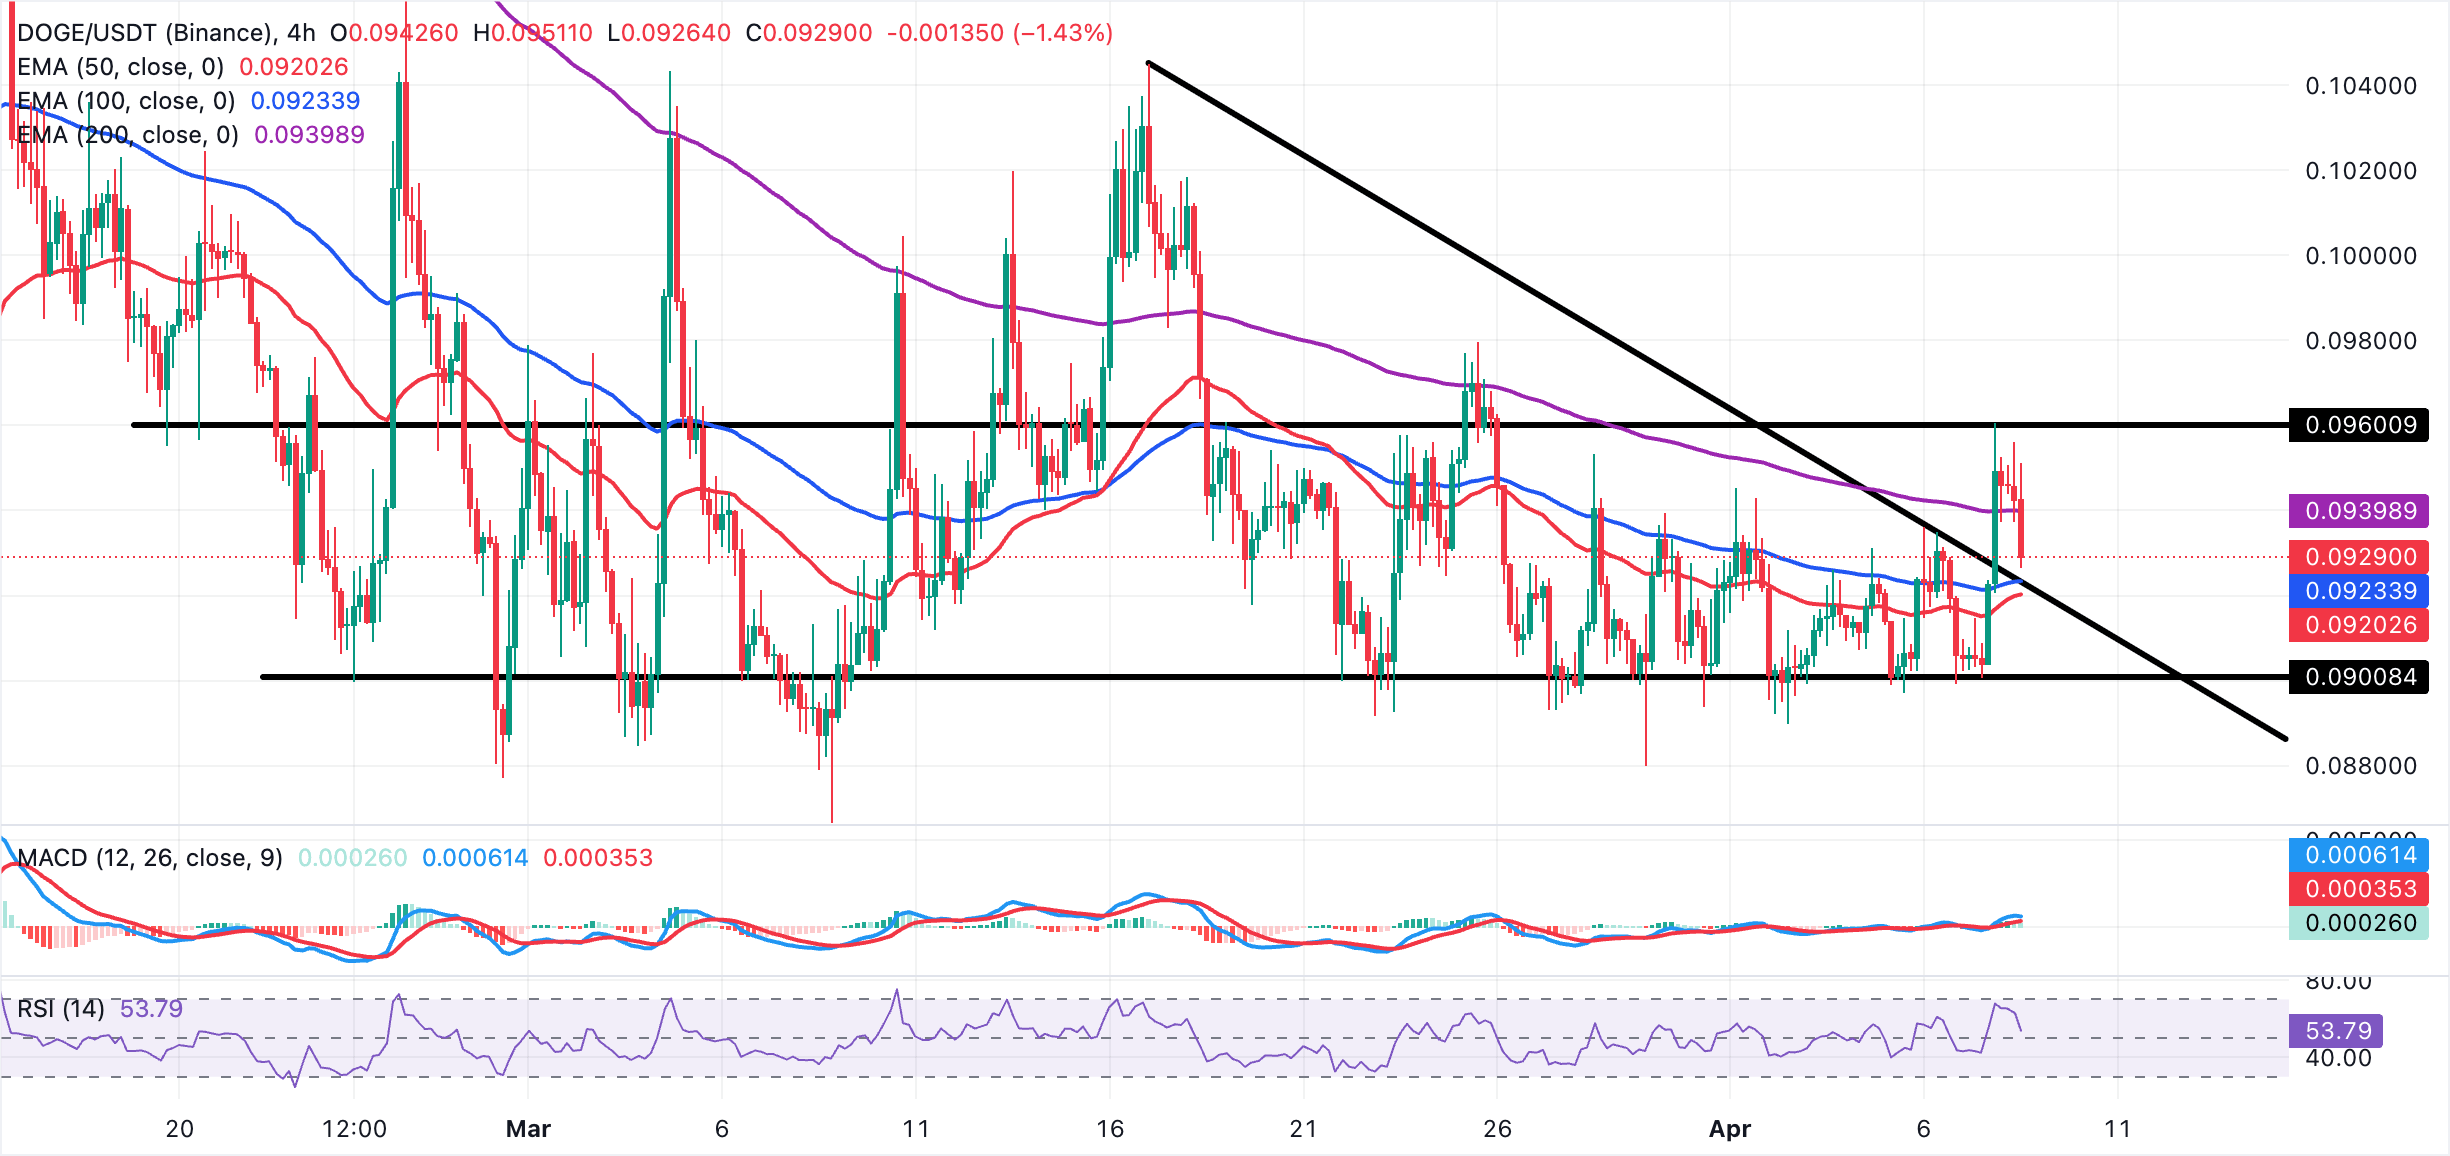
On the topside, immediate resistance lies at the 200 EMA around $0.0940. A sustained break above this barrier would be needed to suggest a more convincing bullish extension. On the downside, initial support lies at the clustered $0.0923 zone defined by the reclaimed trendline break, followed by the 50 EMA near $0.0920. A break of this band is likely to expose the pair to a deeper corrective phase toward the lower end of the range at $0.0900.
Open Interest, funding rate FAQs
Higher Open Interest is associated with higher liquidity and new capital inflow to the market. This is considered the equivalent of increase in efficiency and the ongoing trend continues. When Open Interest decreases, it is considered a sign of liquidation in the market, investors are leaving and the overall demand for an asset is on a decline, fueling a bearish sentiment among investors.
Funding fees bridge the difference between spot prices and prices of futures contracts of an asset by increasing liquidation risks faced by traders. A consistently high and positive funding rate implies there is a bullish sentiment among market participants and there is an expectation of a price hike. A consistently negative funding rate for an asset implies a bearish sentiment, indicating that traders expect the cryptocurrency’s price to fall and a bearish trend reversal is likely to occur.
(The technical analysis of this story was written with the help of an AI tool.)
บทความแนะนำ


