


Dogecoin Price Forecast: DOGE short-term bullish momentum improves as retail interest surges
- Dogecoin extends gains on Friday, testing key resistance trendline and shrugging off tensions over the US-Iran war.
- Retail interest in Dogecoin is improving as futures Open Interest rises amid positive funding rates.
- DOGE shows renewed short-term bullish momentum, with rising RSI and MACD suggesting a trend reversal attempt.
Dogecoin (DOGE) rises over 2% at press time on Friday, extending its recovery toward the $0.1000 psychological level. Speculation surrounding Dogecoin is rising, leading to increased trader participation in the derivatives market. Technically, the outlook for DOGE remains cautiously optimistic, with momentum suggesting a short-term bullish skew.
Retail interest in Dogecoin resurfaces
The cryptocurrency market has shown steady recovery so far this week, with Bitcoin (BTC) rising above $71,000 at press time on Friday, despite the US-Iran war. Dogecoin, the leading meme coin by market capitalization, is up roughly 10% over the same period, reaffirming that selling pressure is briefly weakening. Still, the global financial and crypto markets stand on shaky ground amid escalating conflict in the Middle East.
The DOGE futures Open Interest (OI) has been broadly flat since the October 10 liquidation event. The ongoing flat-trending OI weighs down on Dogecoin, but a steady increase in OI could confirm a renewed upside recovery cycle.
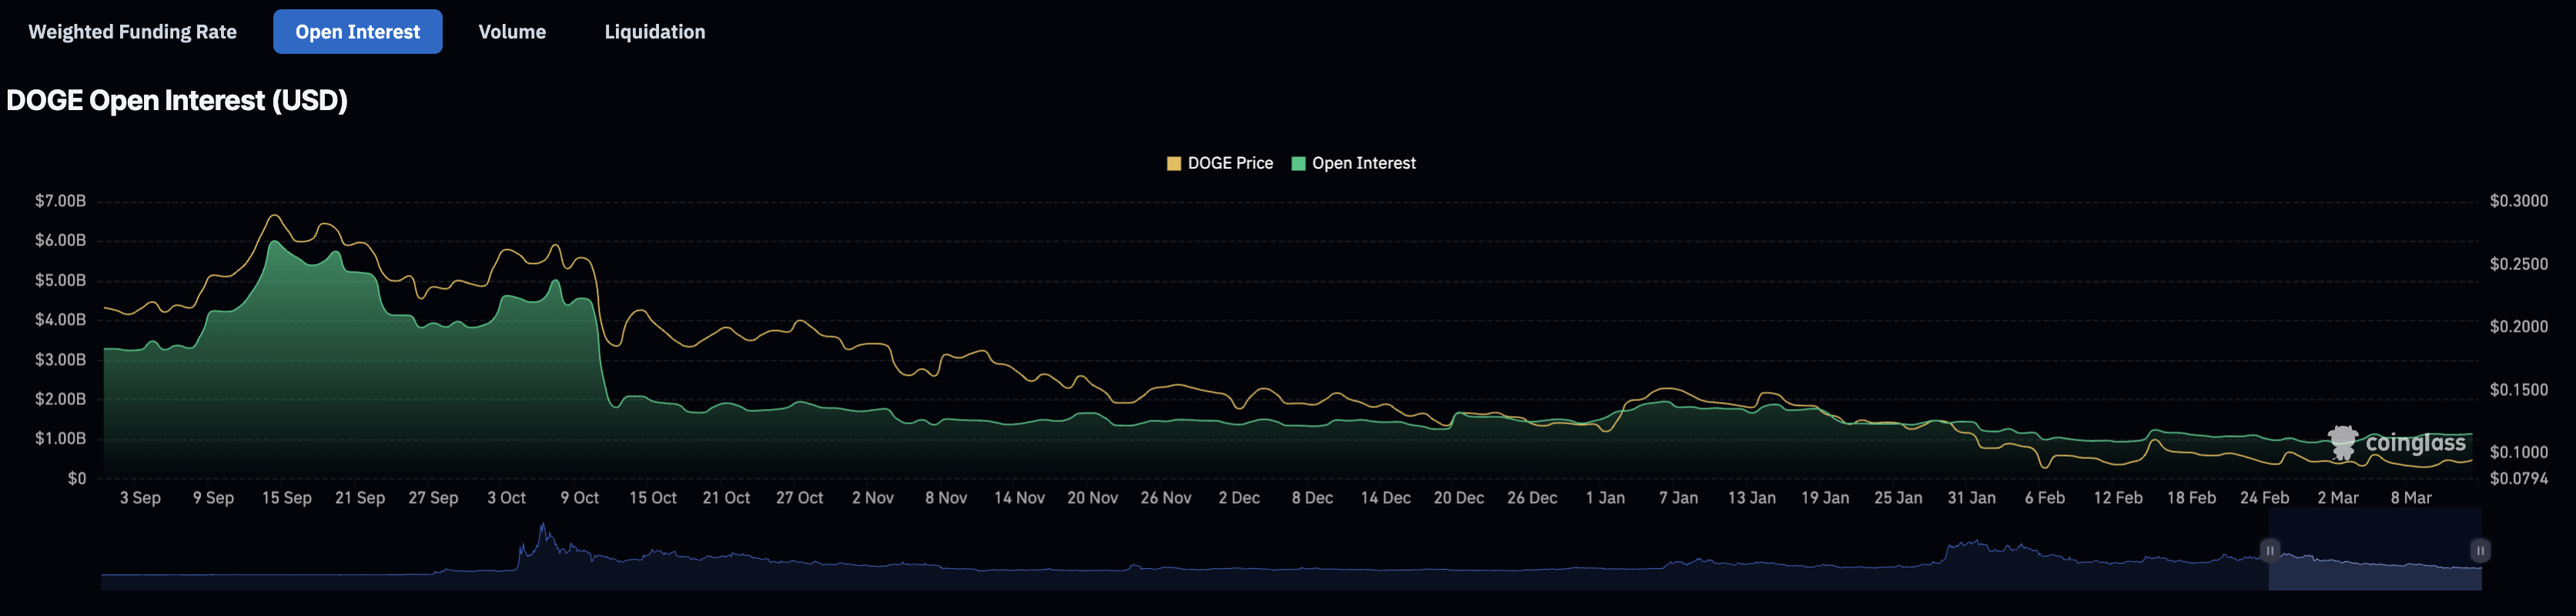
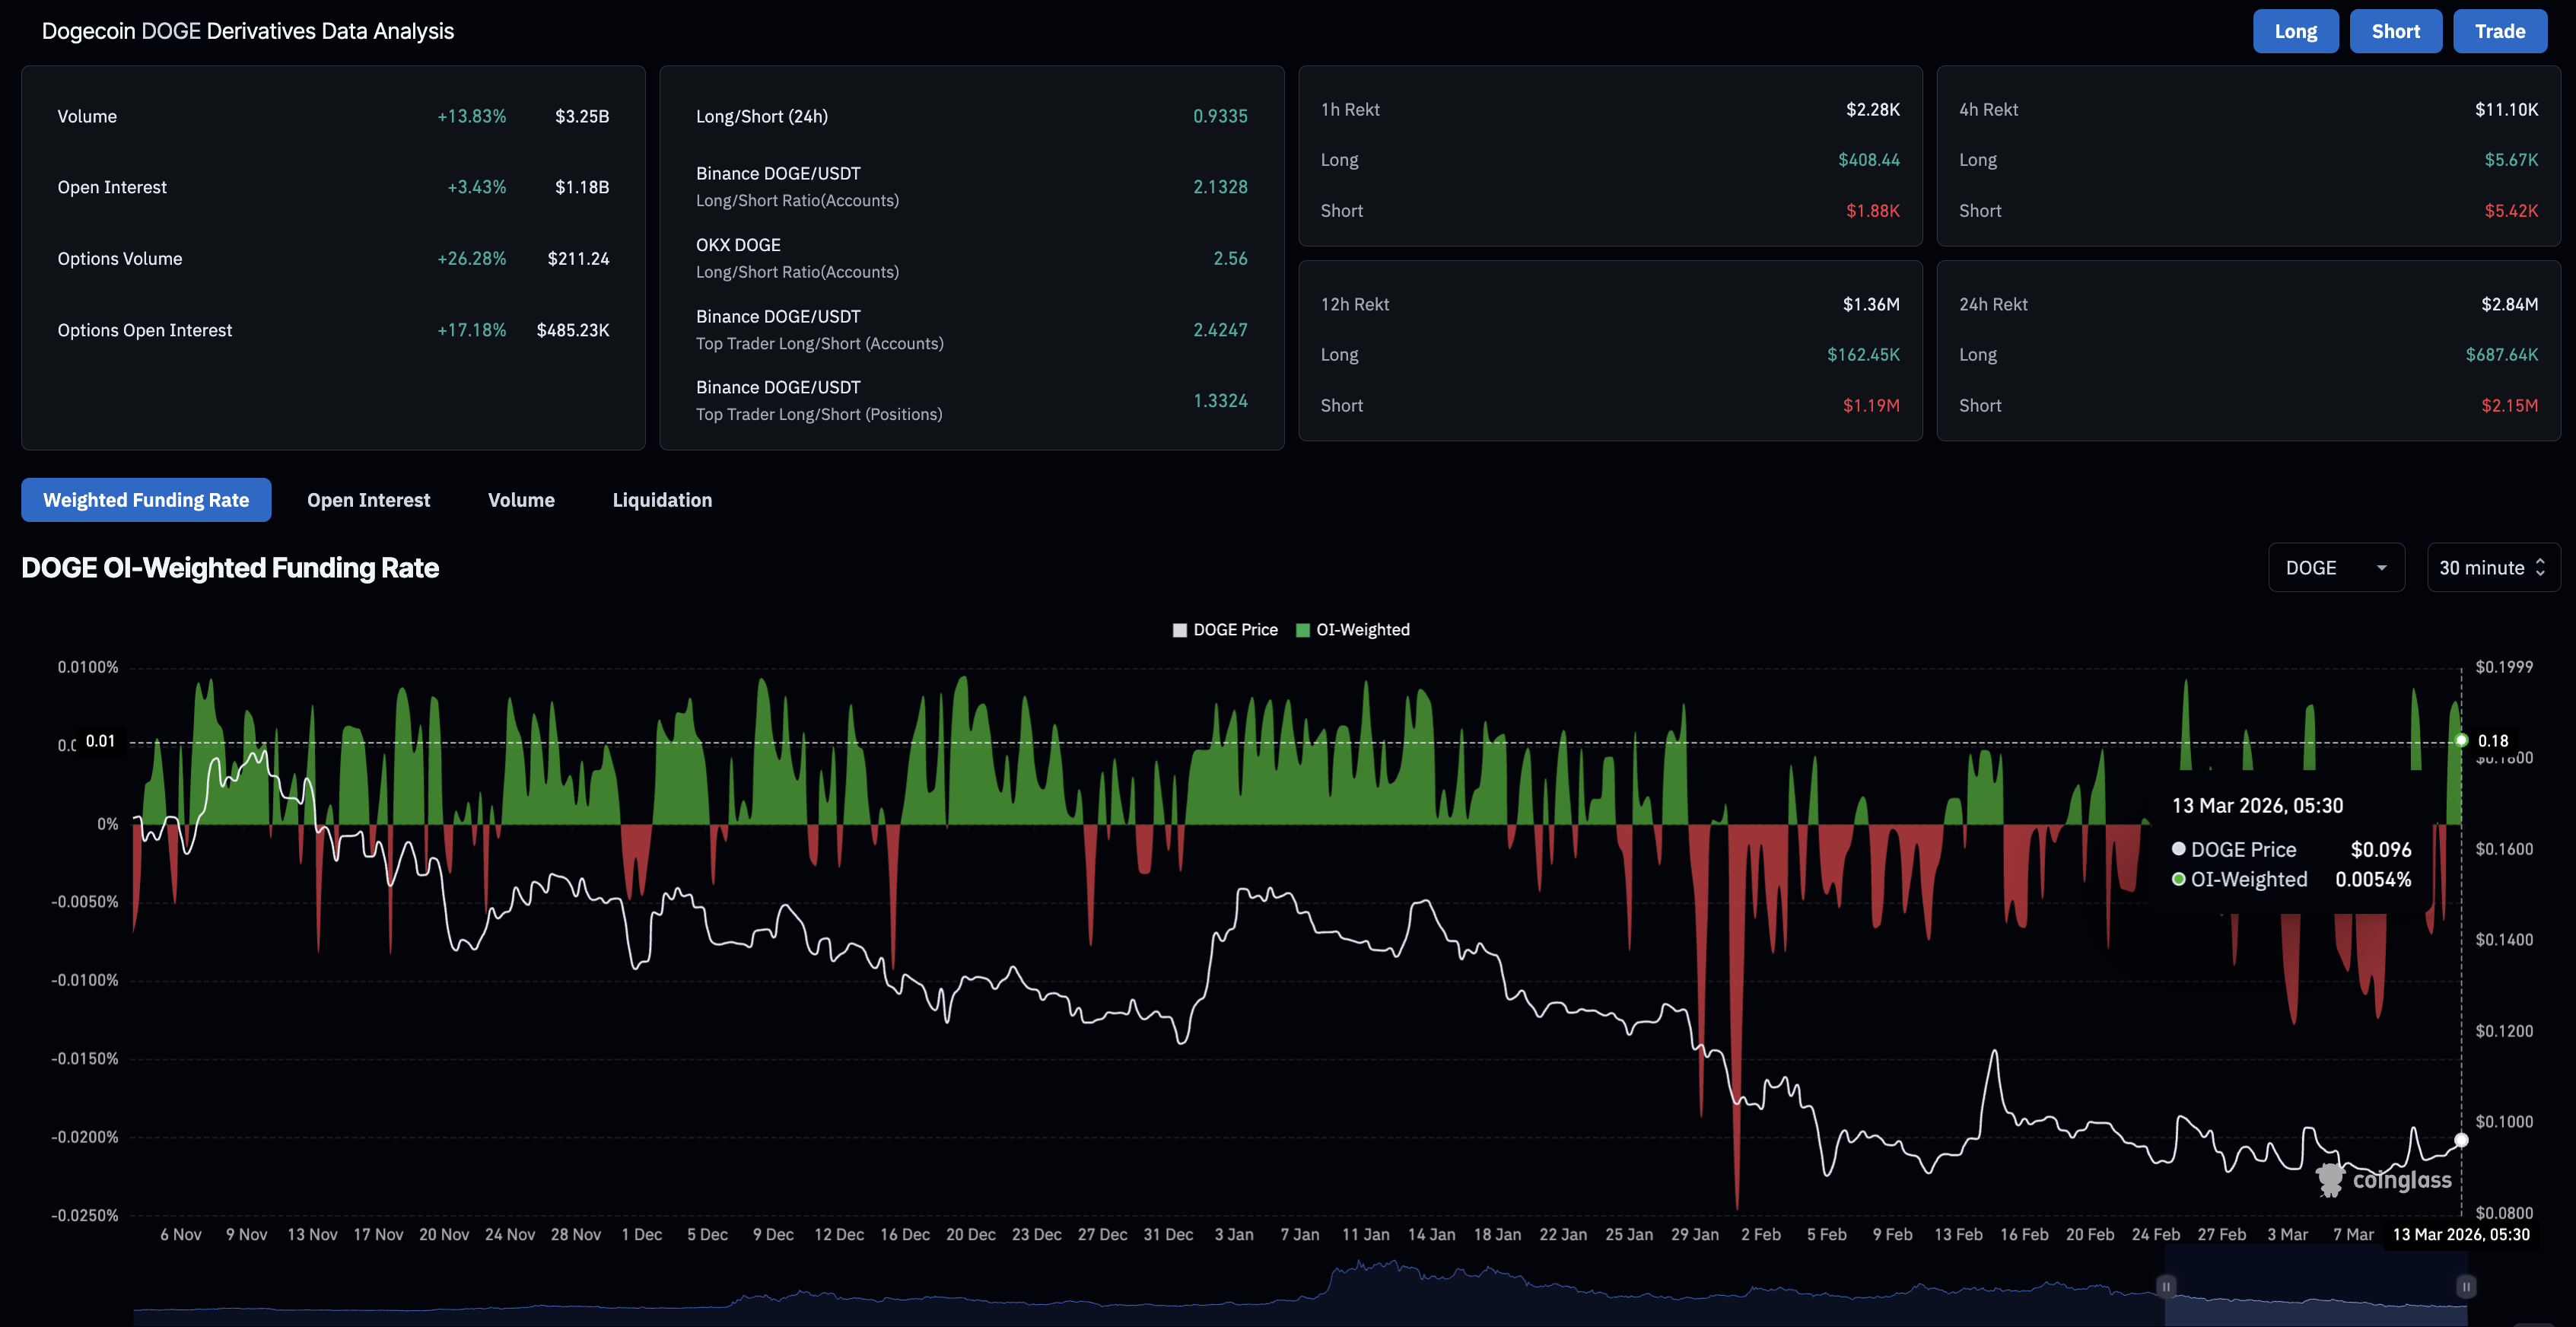
Dogecoin derivatives data reflect a softened risk-off sentiment, with futures OI rising to $1.18 billion, up over 3% in the last 24 hours. from $1.05 billion on Sunday. Meanwhile, the positive funding rate of 0.0054% on Friday reaffirms traders' short-term bullish interest.
Technical outlook: Downside pressure eases on Dogecoin
Dogecoin is trading near $0.09700 at press time on Friday, with technical indicators on the 4-hour chart leaning bullish. The meme coin is testing the 200 Exponential Moving Average (EMA) at $0.09773 on the same chart, slightly below the declining trendline connecting the March 4 and 10 peaks.
The upswing in the 50- and 100-period EMA on the 4-hour chart suggests an improvement in the upside momentum and a Golden Cross potential.
The Moving Average Convergence Divergence (MACD) rises above its signal line as positive histograms expand while the Relative Strength Index (RSI) at 63 shows firm positive momentum without yet entering overbought territory, reinforcing a bullish bias on the 4-hour time frame.
For a sustained recovery, DOGE should surpass the resistance trendline close to $0.09850 and the previous swing high at $0.10036 from Tuesday. This would shatter the prevailing lower-highs trend on the 4-hour chart and open the path to previous swing highs at $0.10603 and $0.11029 from February 25 and February 2, respectively.
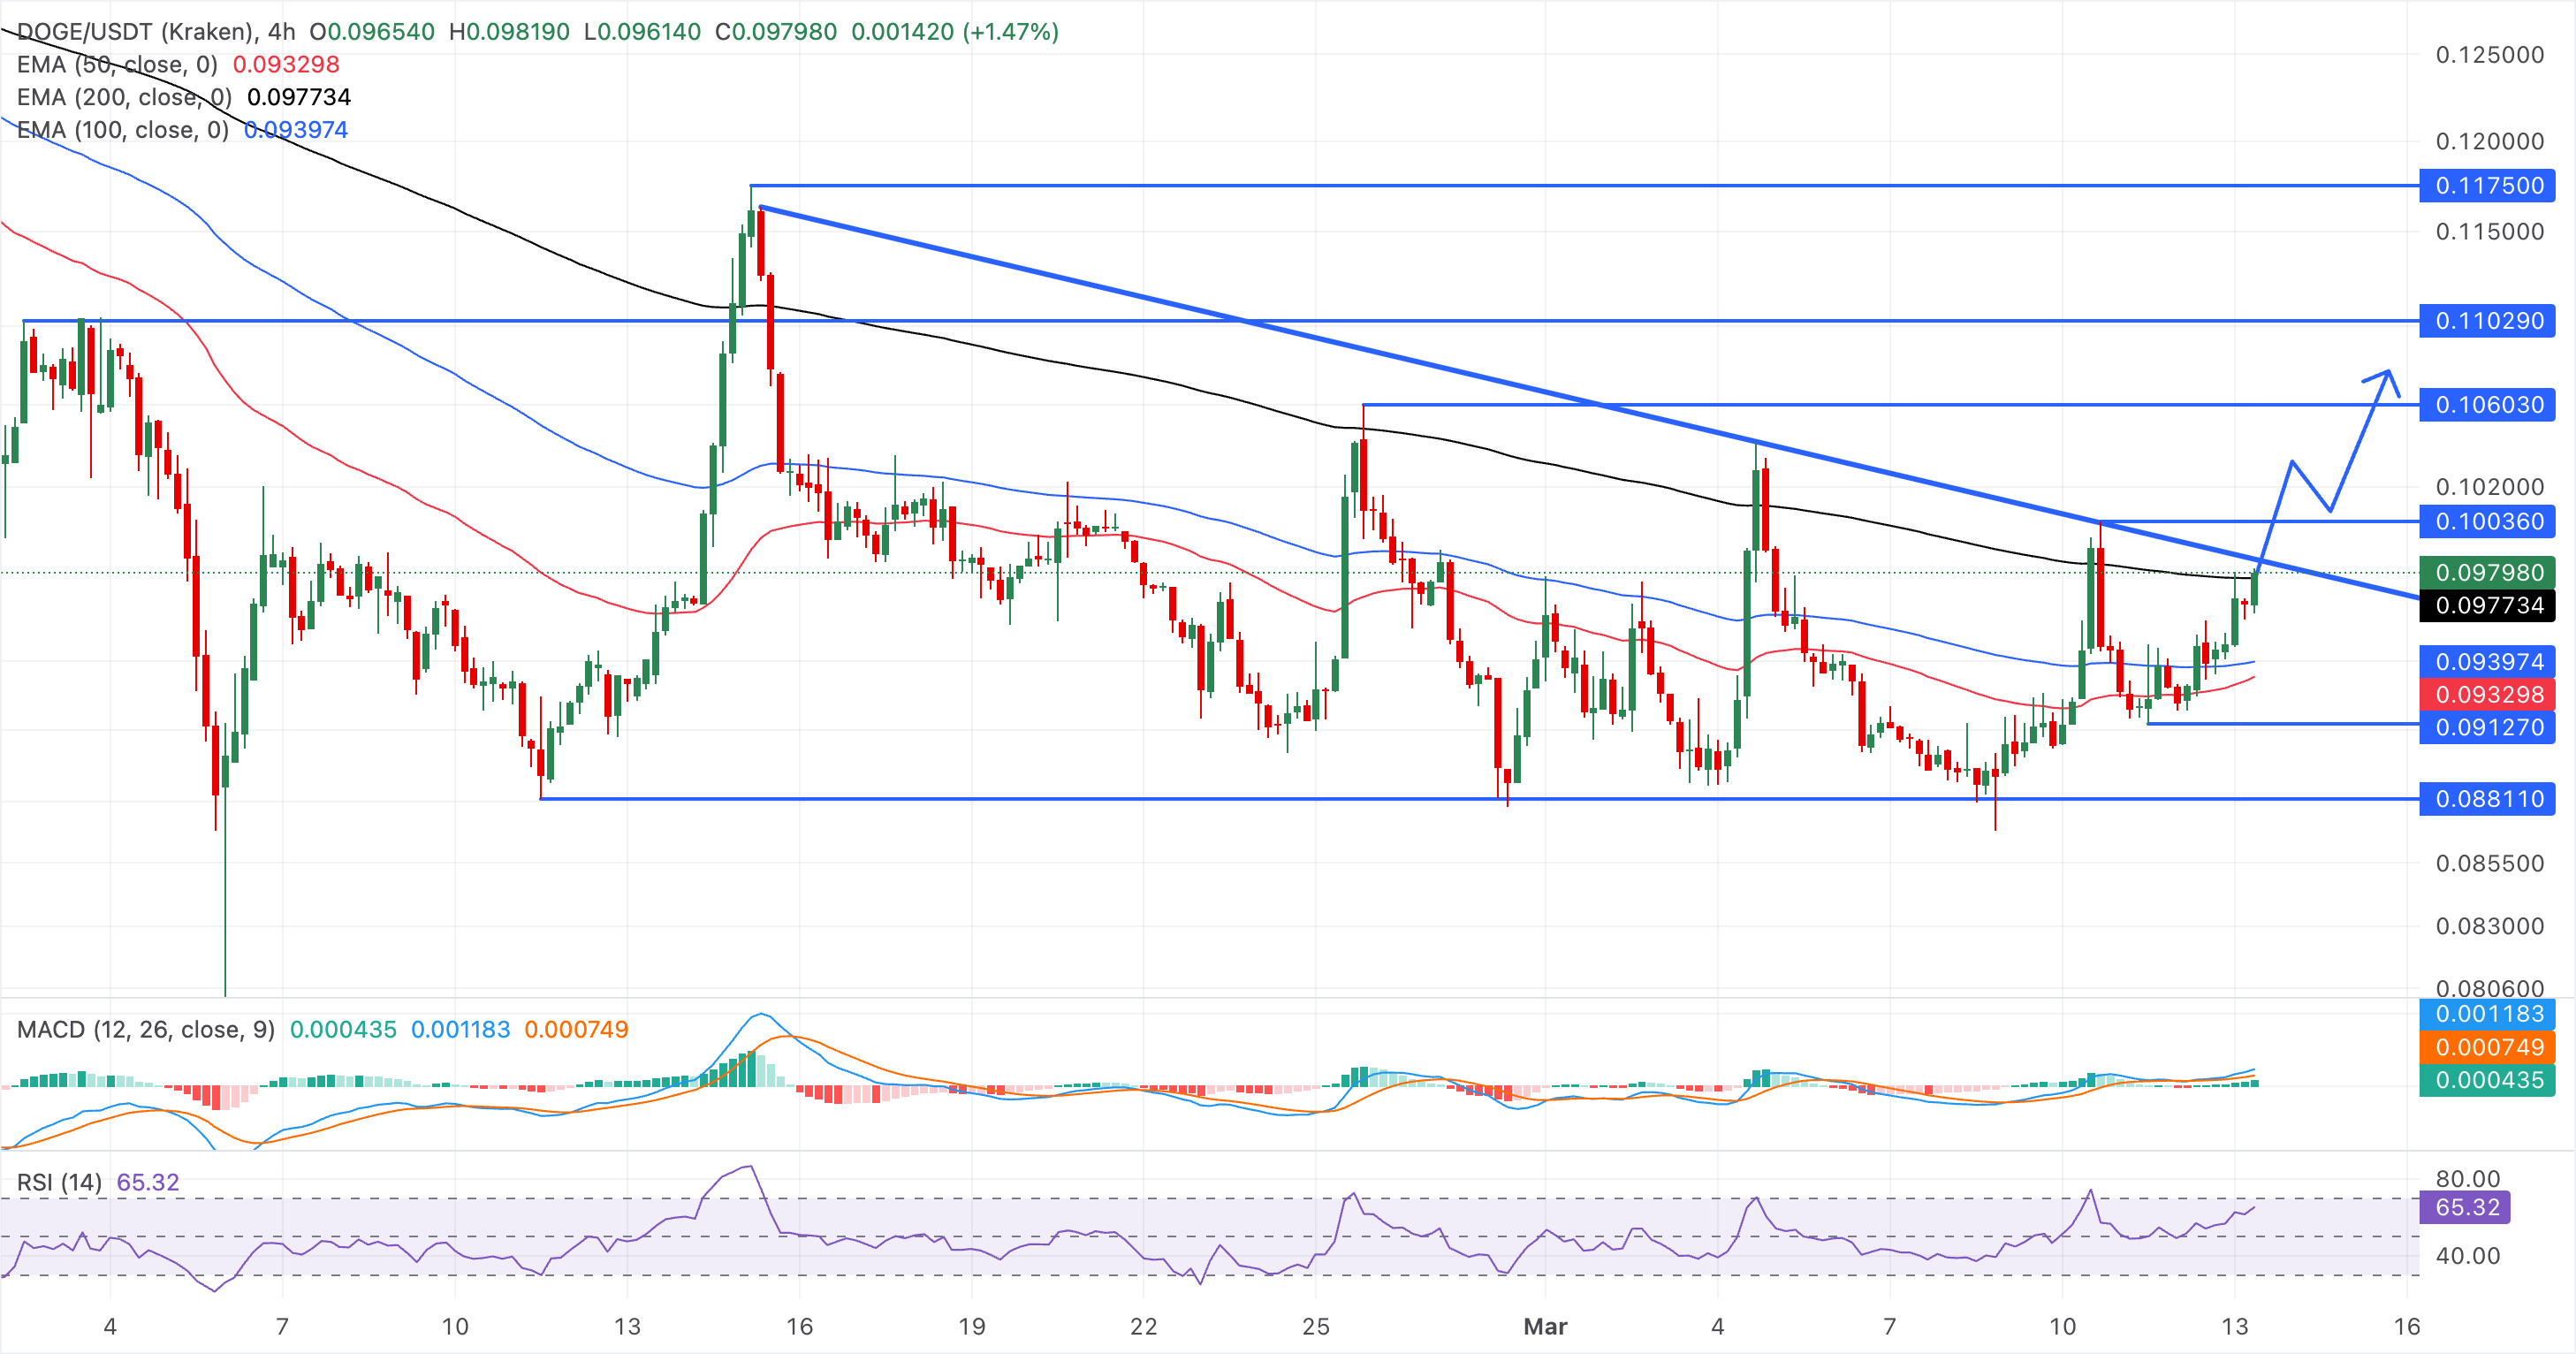
Looking down, the immediate support for DOGE emerges at the 100-period EMA at $0.09397, followed by the 50-period EMA at $0.09330. If Dogecoin slips below the shorter average, it could test the Wednesday's low at $0.09127.
(The technical analysis of this story was written with the help of an AI tool.)
บทความแนะนำ


