

Meme Coins Price Prediction: Dogecoin, Shiba Inu, and Pepe extend losses on bearish signals

แหล่งที่มา Fxstreet
  • Dogecoin price extends its correction on Tuesday, after falling over 3% in the previous day.
  • Shiba Inu is increasing the risk of a deeper correction, as its momentum indicators signal early bearish signs.
  • Pepe price trades lower after slipping by more than 8% in the previous week.

Meme coins are facing renewed selling pressure amid fading broad risk-on sentiment so far this week, with Dogecoin (DOGE), Shiba Inu (SHIB), and Pepe (PEPE) extending their losses after recent corrections. The technical outlook for these meme coins signals early bearish momentum, suggesting a potential for deeper losses in the coming days.

Dogecoin closes below key trendline support

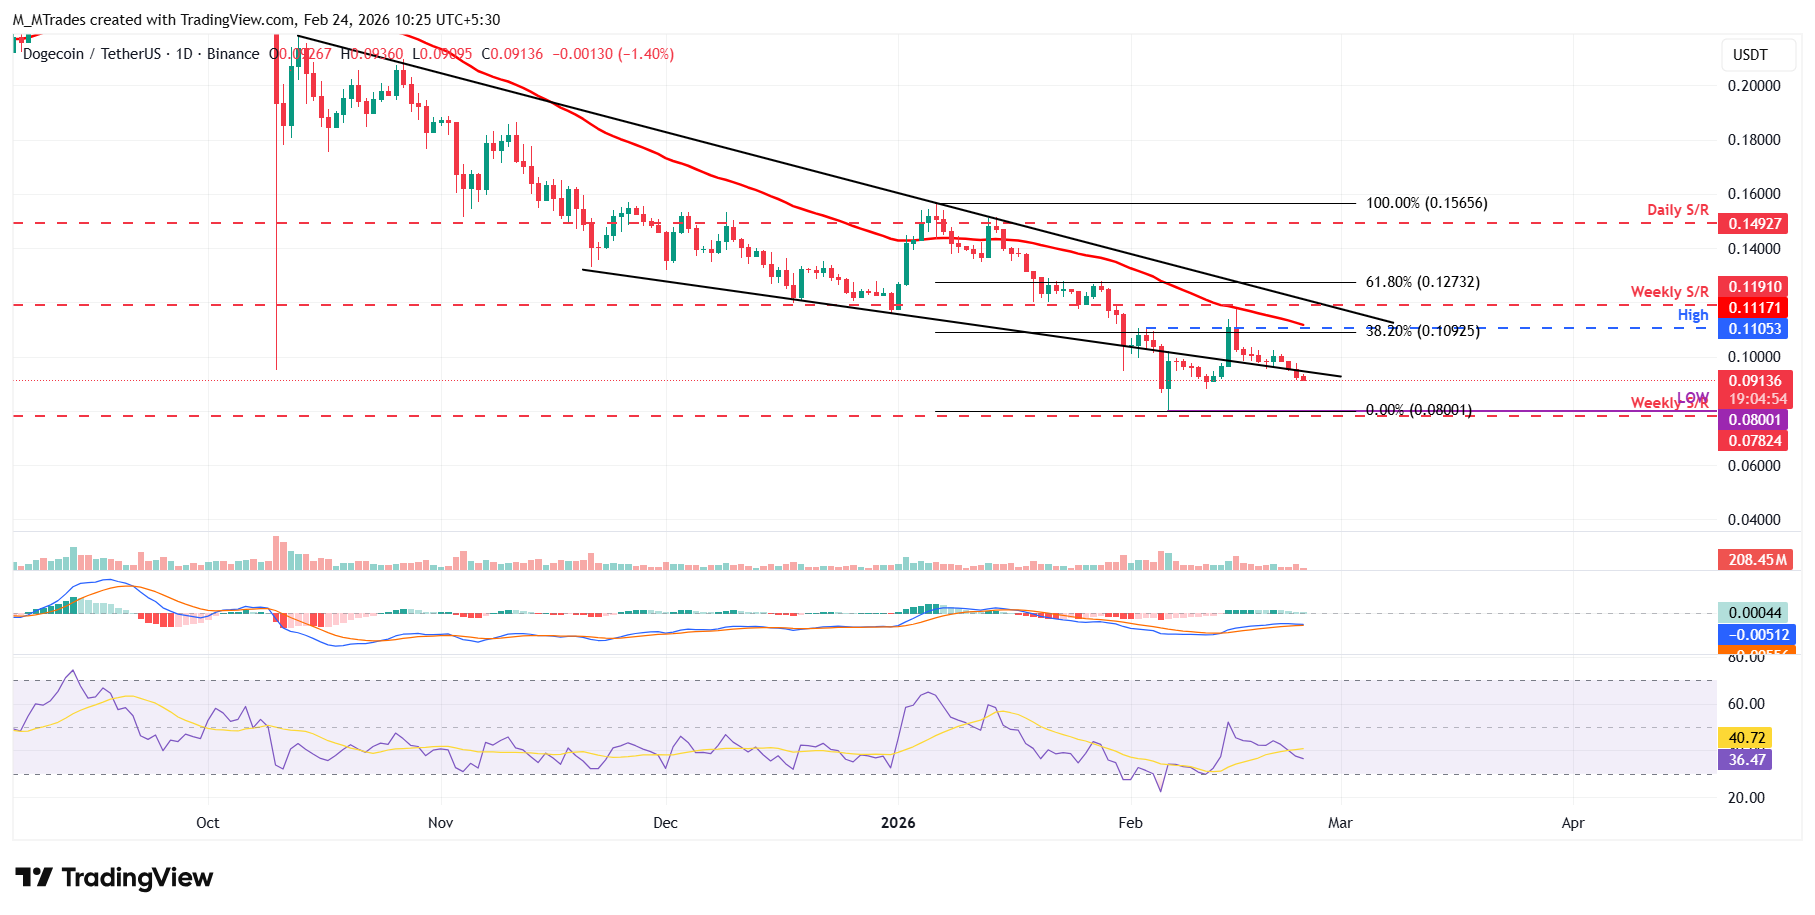
Dogecoin price declined more than 7% since Saturday, closing below the lower trendline of a falling wedge pattern on Monday. As of Tuesday, DOGE is trading down at $0.091.

If DOGE continues its downward trend, it could extend the correction toward the February 6 low of $0.080. A close below this level could extend losses toward the next weekly support at $0.078.

The Relative Strength Index (RSI) on the daily chart is at 36, below the neutral level of 50 and pointing downward, indicating bearish momentum gaining traction. The Moving Average Convergence Divergence (MACD) lines are converging, indicating indecision among traders. If the MACD flips a bearish crossover, it would further support the bearish thesis.
DOGE/USDT daily chart

On the other hand, if DOGE recovers, it could extend the recovery toward the trendline level around $0.100.

Shiba Inu extends correction after rejection from key resistance

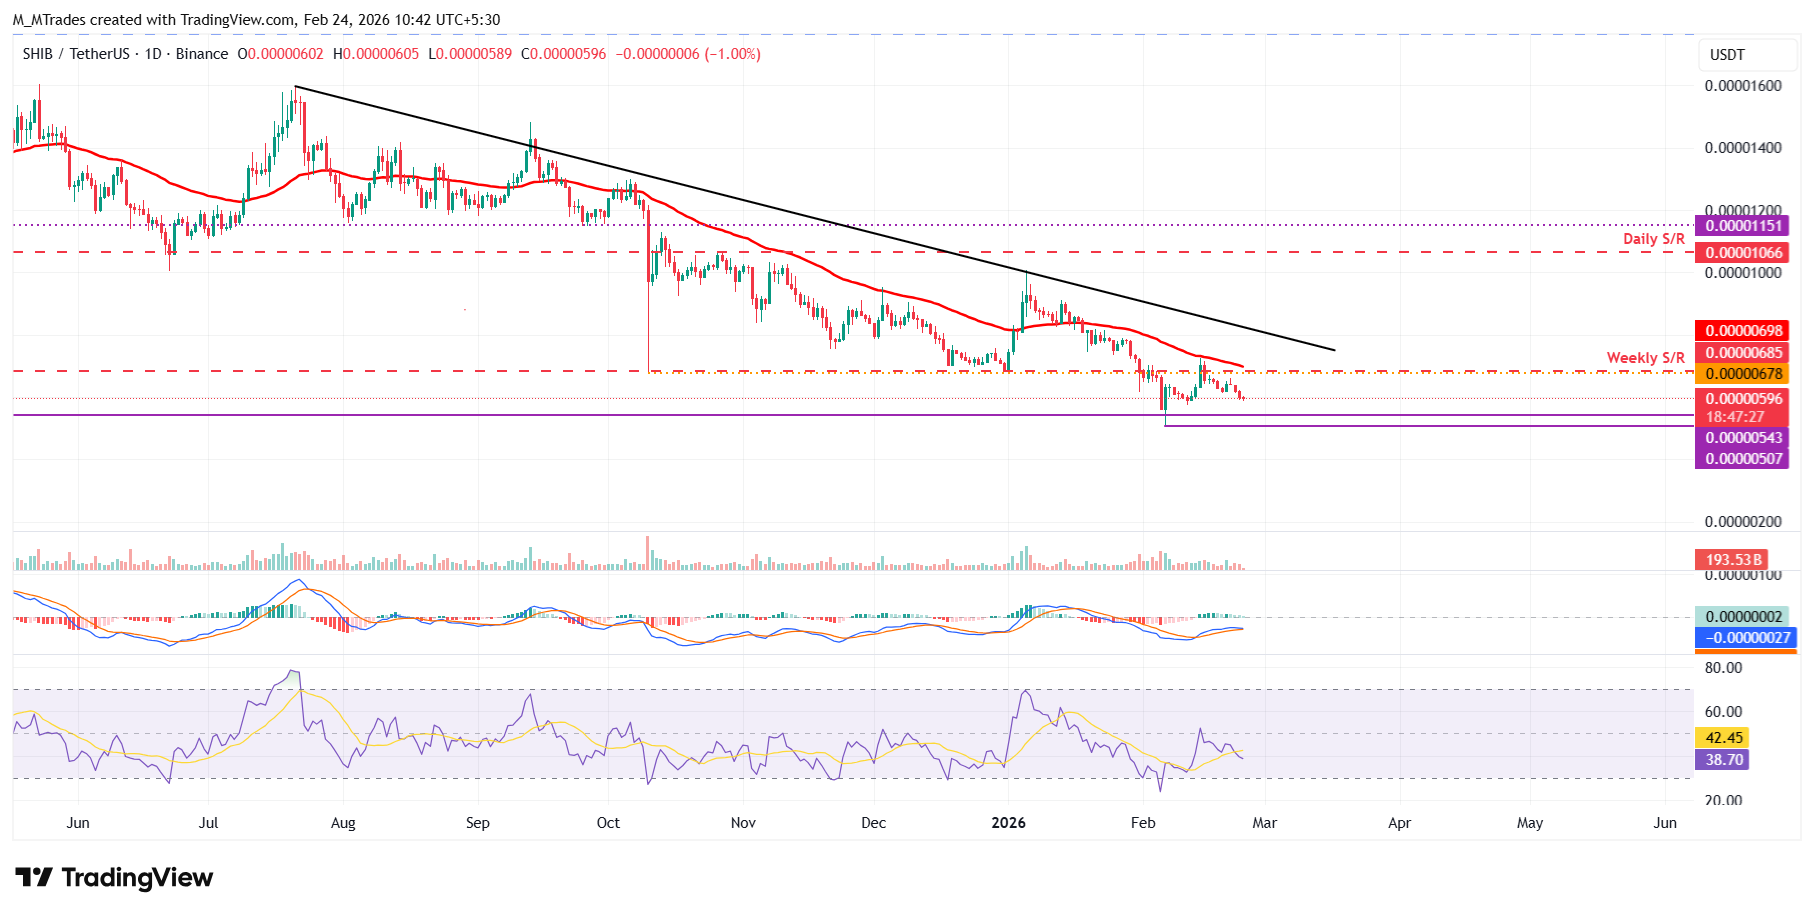
Shiba Inu price was rejected around the weekly resistance level at $0.0000068 on Saturday and declined by nearly 6% over the next two days. As of Tuesday, SHIB is extending its correction, trading at $0.0000059.

If SHIB continues its downward trend, it could extend the correction toward the February 6 low of $0.0000050.

Like Dogecoin, SHIB’s RSI shows bearish momentum gaining traction, while the MACD is poised to flip to a bearish crossover, further supporting the negative outlook.
SHIB/USDT daily chart

However, if SHIB recovers, it could extend the advance toward the weekly resistance at $0.0000067.

Pepe extends losses after rejection from the 50-day EMA

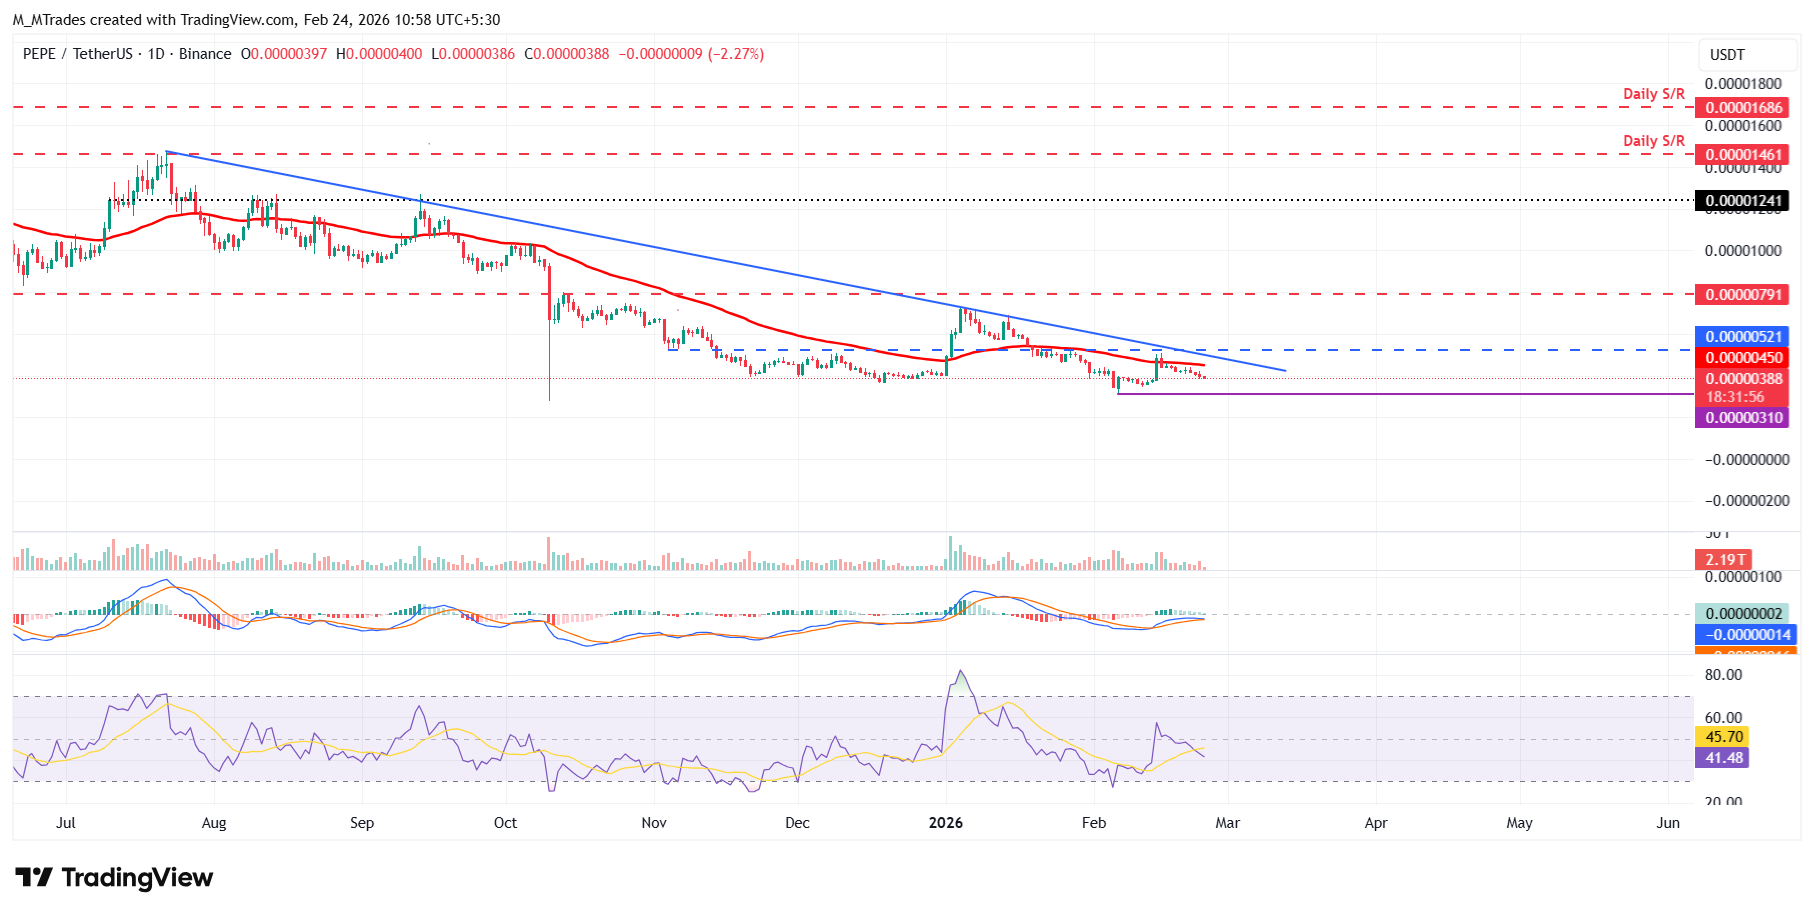
Pepe price closed below the 50-day EMA at $0.0000045 on February 15 and declined by over 11% through Monday. As of writing, PEPE is trading at $0.0000038.

If PEPE continues its correction, it could extend the decline toward the February 6 low of $0.0000031.

Like Dogecoin and Shiba Inu, PEPE momentum indicators, RSI and MACD indicators also support a negative outlook.
PEPE/USDT daily chart

Conversely, if Pepe recovers, it could extend the advance toward the 50-day EMA at $0.0000045.

ข้อจำกัดความรับผิดชอบ: เพื่อการอ้างอิงเท่านั้น ผลการดำเนินงานในอดีตไม่ได้บ่งบอกถึงผลลัพธ์ในอนาคต
placeholder
แนวโน้มราคาน้ำมันดิบ WTI: ราคาน้ำมันอาจดิ่งลง หลังอิหร่านยื่นเงื่อนไขการเจรจา 7 ข้อต่อสหรัฐฯTradingKey - ณ ราคาปิดเมื่อวันศุกร์ตามเวลาฝั่งตะวันออกของสหรัฐฯ ราคาน้ำมันดิบ WTI (USOIL) ดิ่งลง 5.58% ในระหว่างวัน โดยหลุดระดับ 100 ดอลลาร์อีกครั้งไปปิดที่ 95.46 ดอลลาร์ ก่อนหน้านี้ การหยุดชะงักของอุ
ผู้เขียน  TradingKey
11 ชั่วโมงที่แล้ว
TradingKey - ณ ราคาปิดเมื่อวันศุกร์ตามเวลาฝั่งตะวันออกของสหรัฐฯ ราคาน้ำมันดิบ WTI (USOIL) ดิ่งลง 5.58% ในระหว่างวัน โดยหลุดระดับ 100 ดอลลาร์อีกครั้งไปปิดที่ 95.46 ดอลลาร์ ก่อนหน้านี้ การหยุดชะงักของอุ
placeholder
WTI ร่วงลง ขณะที่ความกังวลเกี่ยวกับอุปทานจากตะวันออกกลางคลี่คลายราคาน้ำมันดิบเวสต์เทกซัสอินเตอร์มีเดียต (WTI) ยังคงซบเซาเป็นวันที่สามติดต่อกัน เคลื่อนไหวอยู่ที่ประมาณ 96.40 ดอลลาร์ต่อบาร์เรลในช่วงเวลาการซื้อขายของเอเชียในวันศุกร์
ผู้เขียน  FXStreet
16 ชั่วโมงที่แล้ว
ราคาน้ำมันดิบเวสต์เทกซัสอินเตอร์มีเดียต (WTI) ยังคงซบเซาเป็นวันที่สามติดต่อกัน เคลื่อนไหวอยู่ที่ประมาณ 96.40 ดอลลาร์ต่อบาร์เรลในช่วงเวลาการซื้อขายของเอเชียในวันศุกร์
placeholder
Solana (SOLUSD) ปรับลง 2.12% อย่างกะทันหันในวันที่ 20 ก.ย.: สิ่งที่คุณต้องจับตาSolana (SOLUSD) ปรับลง 2.12% ณ วันที่ 20 ก.ย. เวลา 20:25(ET) อยู่ที่ $110.12 โดยมีการเคลื่อนไหวในช่วง 7 วันที่ผ่านมา ปรับขึ้น 9.59%อะไรเป็นแรงผลักดันให้ราคาหุ้น Solana (SOLUSD) ปรับตัว ลง ในวันนี้?Sol
ผู้เขียน  TradingKey
16 ชั่วโมงที่แล้ว
Solana (SOLUSD) ปรับลง 2.12% ณ วันที่ 20 ก.ย. เวลา 20:25(ET) อยู่ที่ $110.12 โดยมีการเคลื่อนไหวในช่วง 7 วันที่ผ่านมา ปรับขึ้น 9.59%อะไรเป็นแรงผลักดันให้ราคาหุ้น Solana (SOLUSD) ปรับตัว ลง ในวันนี้?Sol
placeholder
ปัจจัยลบจากการปรับขึ้นอัตราดอกเบี้ยของเฟดถูกสะท้อนในราคาไปแล้วหรือยัง? ทองคำดีดตัวขึ้นอย่างแข็งแกร่งมุ่งสู่ระดับ 4,400 ดอลลาร์ พร้อมเปิดฉากการปรับตัวขึ้นรอบใหม่ ณ ช่วงการซื้อขายในตลาดยุโรปของวันที่ 18 กันยายน ราคาทองคำ (XAUUSD) ได้เดินหน้าฟื้นตัวอย่างต่อเนื่องจากวันพฤหัสบดี โดยปรับตัวขึ้นอย่างแข็งแกร่งในการซื้อขายระหว่างวันสู่ระดับ 4,399.75 ดอลลา
ผู้เขียน  TradingKey
9 เดือน 18 วัน ศุกร์
ณ ช่วงการซื้อขายในตลาดยุโรปของวันที่ 18 กันยายน ราคาทองคำ (XAUUSD) ได้เดินหน้าฟื้นตัวอย่างต่อเนื่องจากวันพฤหัสบดี โดยปรับตัวขึ้นอย่างแข็งแกร่งในการซื้อขายระหว่างวันสู่ระดับ 4,399.75 ดอลลา
placeholder
ความผันผวนของ เงิน (XAGUSD) เพิ่มสูงขึ้นในวันที่ 18 ก.ย.: สิ่งที่ต้องจับตาเงิน (XAGUSD) ปรับขึ้น 2.23% ณ วันที่ 18 ก.ย. เวลา 01:40(ET) อยู่ที่ $66.561 โดยมีการเคลื่อนไหวในช่วง 7 วันที่ผ่านมา ปรับขึ้น 3.38%อะไรเป็นแรงผลักดันให้ราคาหุ้น เงิน (XAGUSD) ปรับตัว ขึ้น ในวันนี้?การ
ผู้เขียน  TradingKey
9 เดือน 18 วัน ศุกร์
เงิน (XAGUSD) ปรับขึ้น 2.23% ณ วันที่ 18 ก.ย. เวลา 01:40(ET) อยู่ที่ $66.561 โดยมีการเคลื่อนไหวในช่วง 7 วันที่ผ่านมา ปรับขึ้น 3.38%อะไรเป็นแรงผลักดันให้ราคาหุ้น เงิน (XAGUSD) ปรับตัว ขึ้น ในวันนี้?การ
ตราสารที่เกี่ยวข้อง
goTop
quote