

Bitcoin Cash Price Forecast: Retail interest sparks in BCH amid reversal chances

แหล่งที่มา Fxstreet
  • Bitcoin Cash hovers around $600 following Tuesday’s nearly 4% rise, forming a double bottom reversal pattern.
  • Derivatives data shows a spike in BCH Open Interest and positive funding rates reflecting bullish bias among traders.
  • The technical outlook for Bitcoin Cash is shifting bullish as the BCH rebound from the 100-day EMA gains traction.

Bitcoin Cash (BCH) is trading around $600 at press time on Wednesday, framing a potential double bottom reversal on the daily chart. The BCH token is witnessing renewed capital inflows into its futures contracts amid a positive funding rate cycle, signaling renewed investor interest. Technically, Bitcoin Cash could rally toward $655 if it sustains momentum.

Retail sentiment is changing for the better

Bitcoin Cash witnesses early signs of retail engagement, aligning with the recovery run seen so far this week. Typically, an alignment of positive funding rates and OI spike signals further upside for an asset. CoinGlass data shows a spike in BCH futures Open Interest (OI) to $746.29 million, up from $700.06 million on Tuesday, indicating increased risk exposure as investors anticipate further gains.
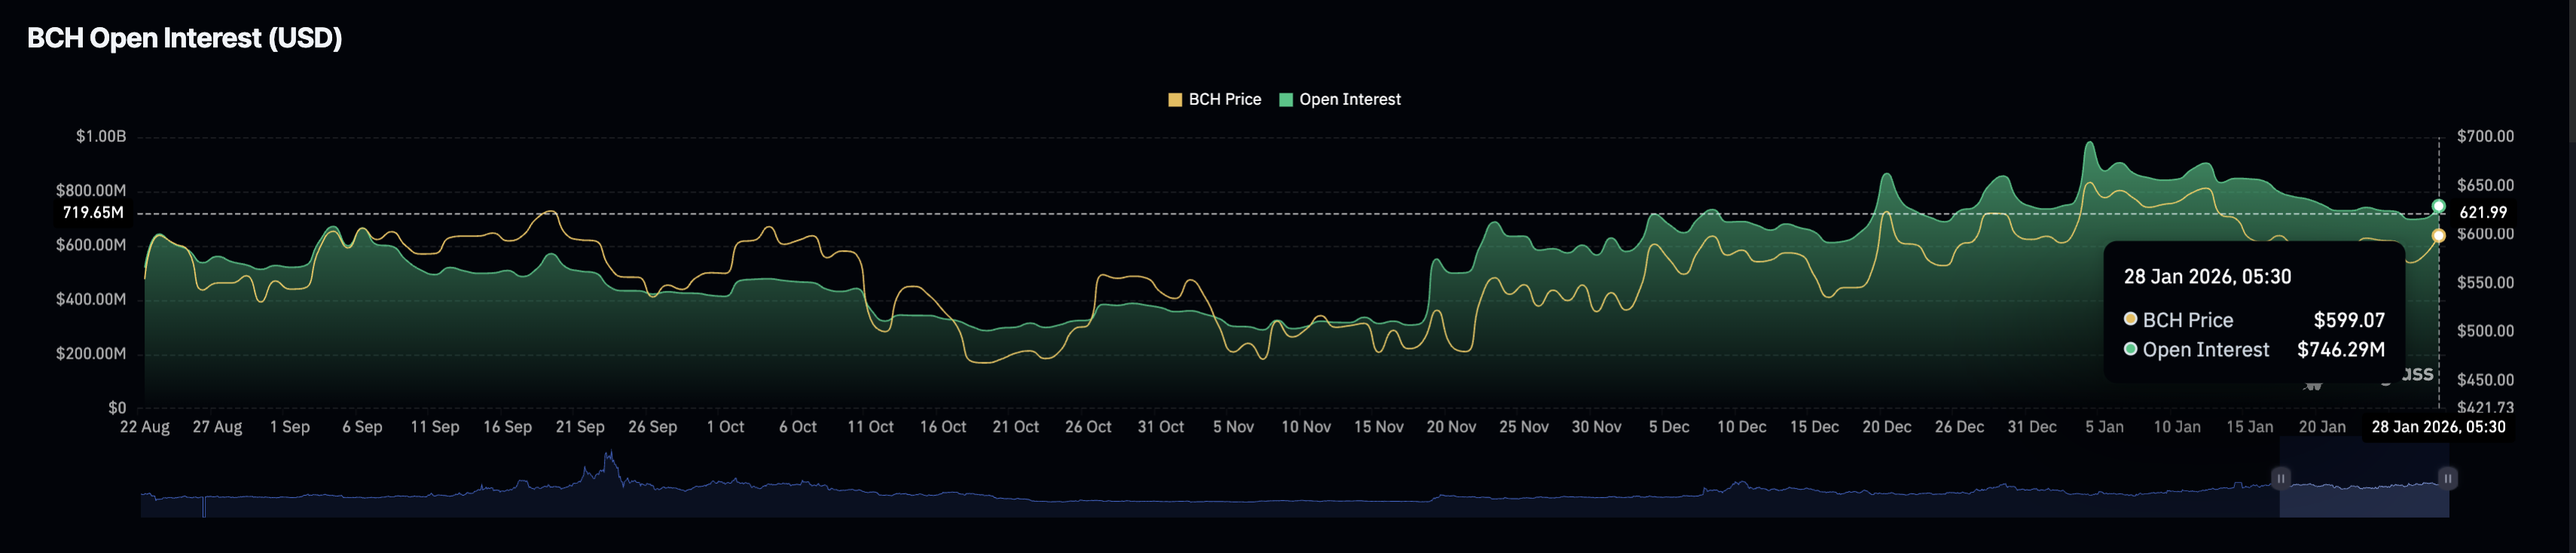
BCH Open Interest data. Source: CoinGlass

In line with the topside bias, the funding rate remains positive at 0.0028%, indicating a bullish tilt in new positional buildups. 
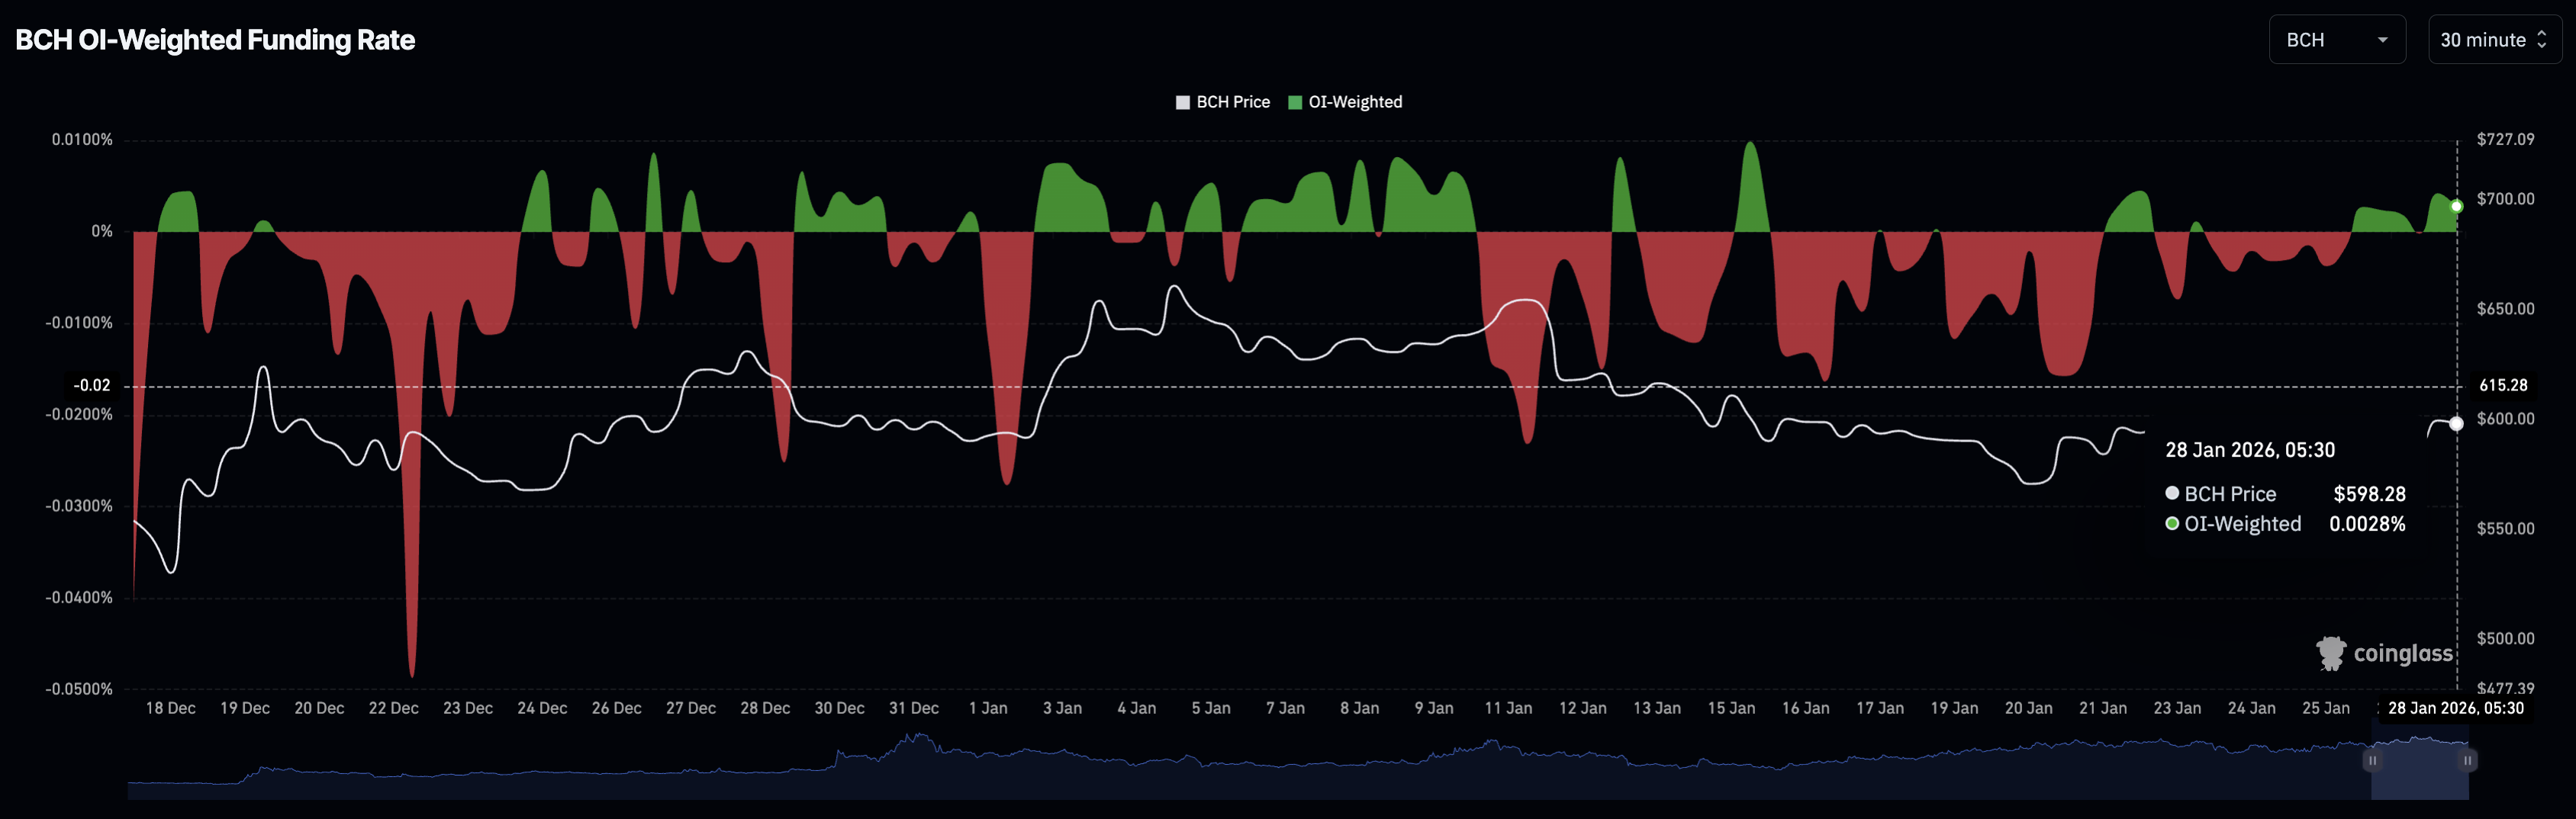
BCH funding rates. Source: CoinGlass

Bitcoin Cash recovery stalls near $600 amid momentum shift

Bitcoin Cash is trading around $600, holding above the 50-day Exponential Moving Average (EMA), which is now above the 100-day and 200-day EMAs, suggesting a long-term uptrend. The rebounds from the 100-day EMA at $575 form a double bottom pattern on the BCH daily price chart with the neckline at the January 16 high of $606. 

A decisive close above this level could extend the BCH rally toward the R1 Pivot Point at $655, which previously capped gains in early January.

The technical indicators on the daily chart suggest a decline in selling pressure and flash early signals of a potential bullish trend. The Relative Strength Index (RSI) is at 50, holding at the neutral level after a rebound, indicating reduced selling pressure. At the same time, the Moving Average Convergence Divergence (MACD) reverses higher toward the signal line, potentially leading to a crossover, while negative histograms contract. A rise in the MACD histogram above zero would confirm the crossover and trigger a buy signal. 
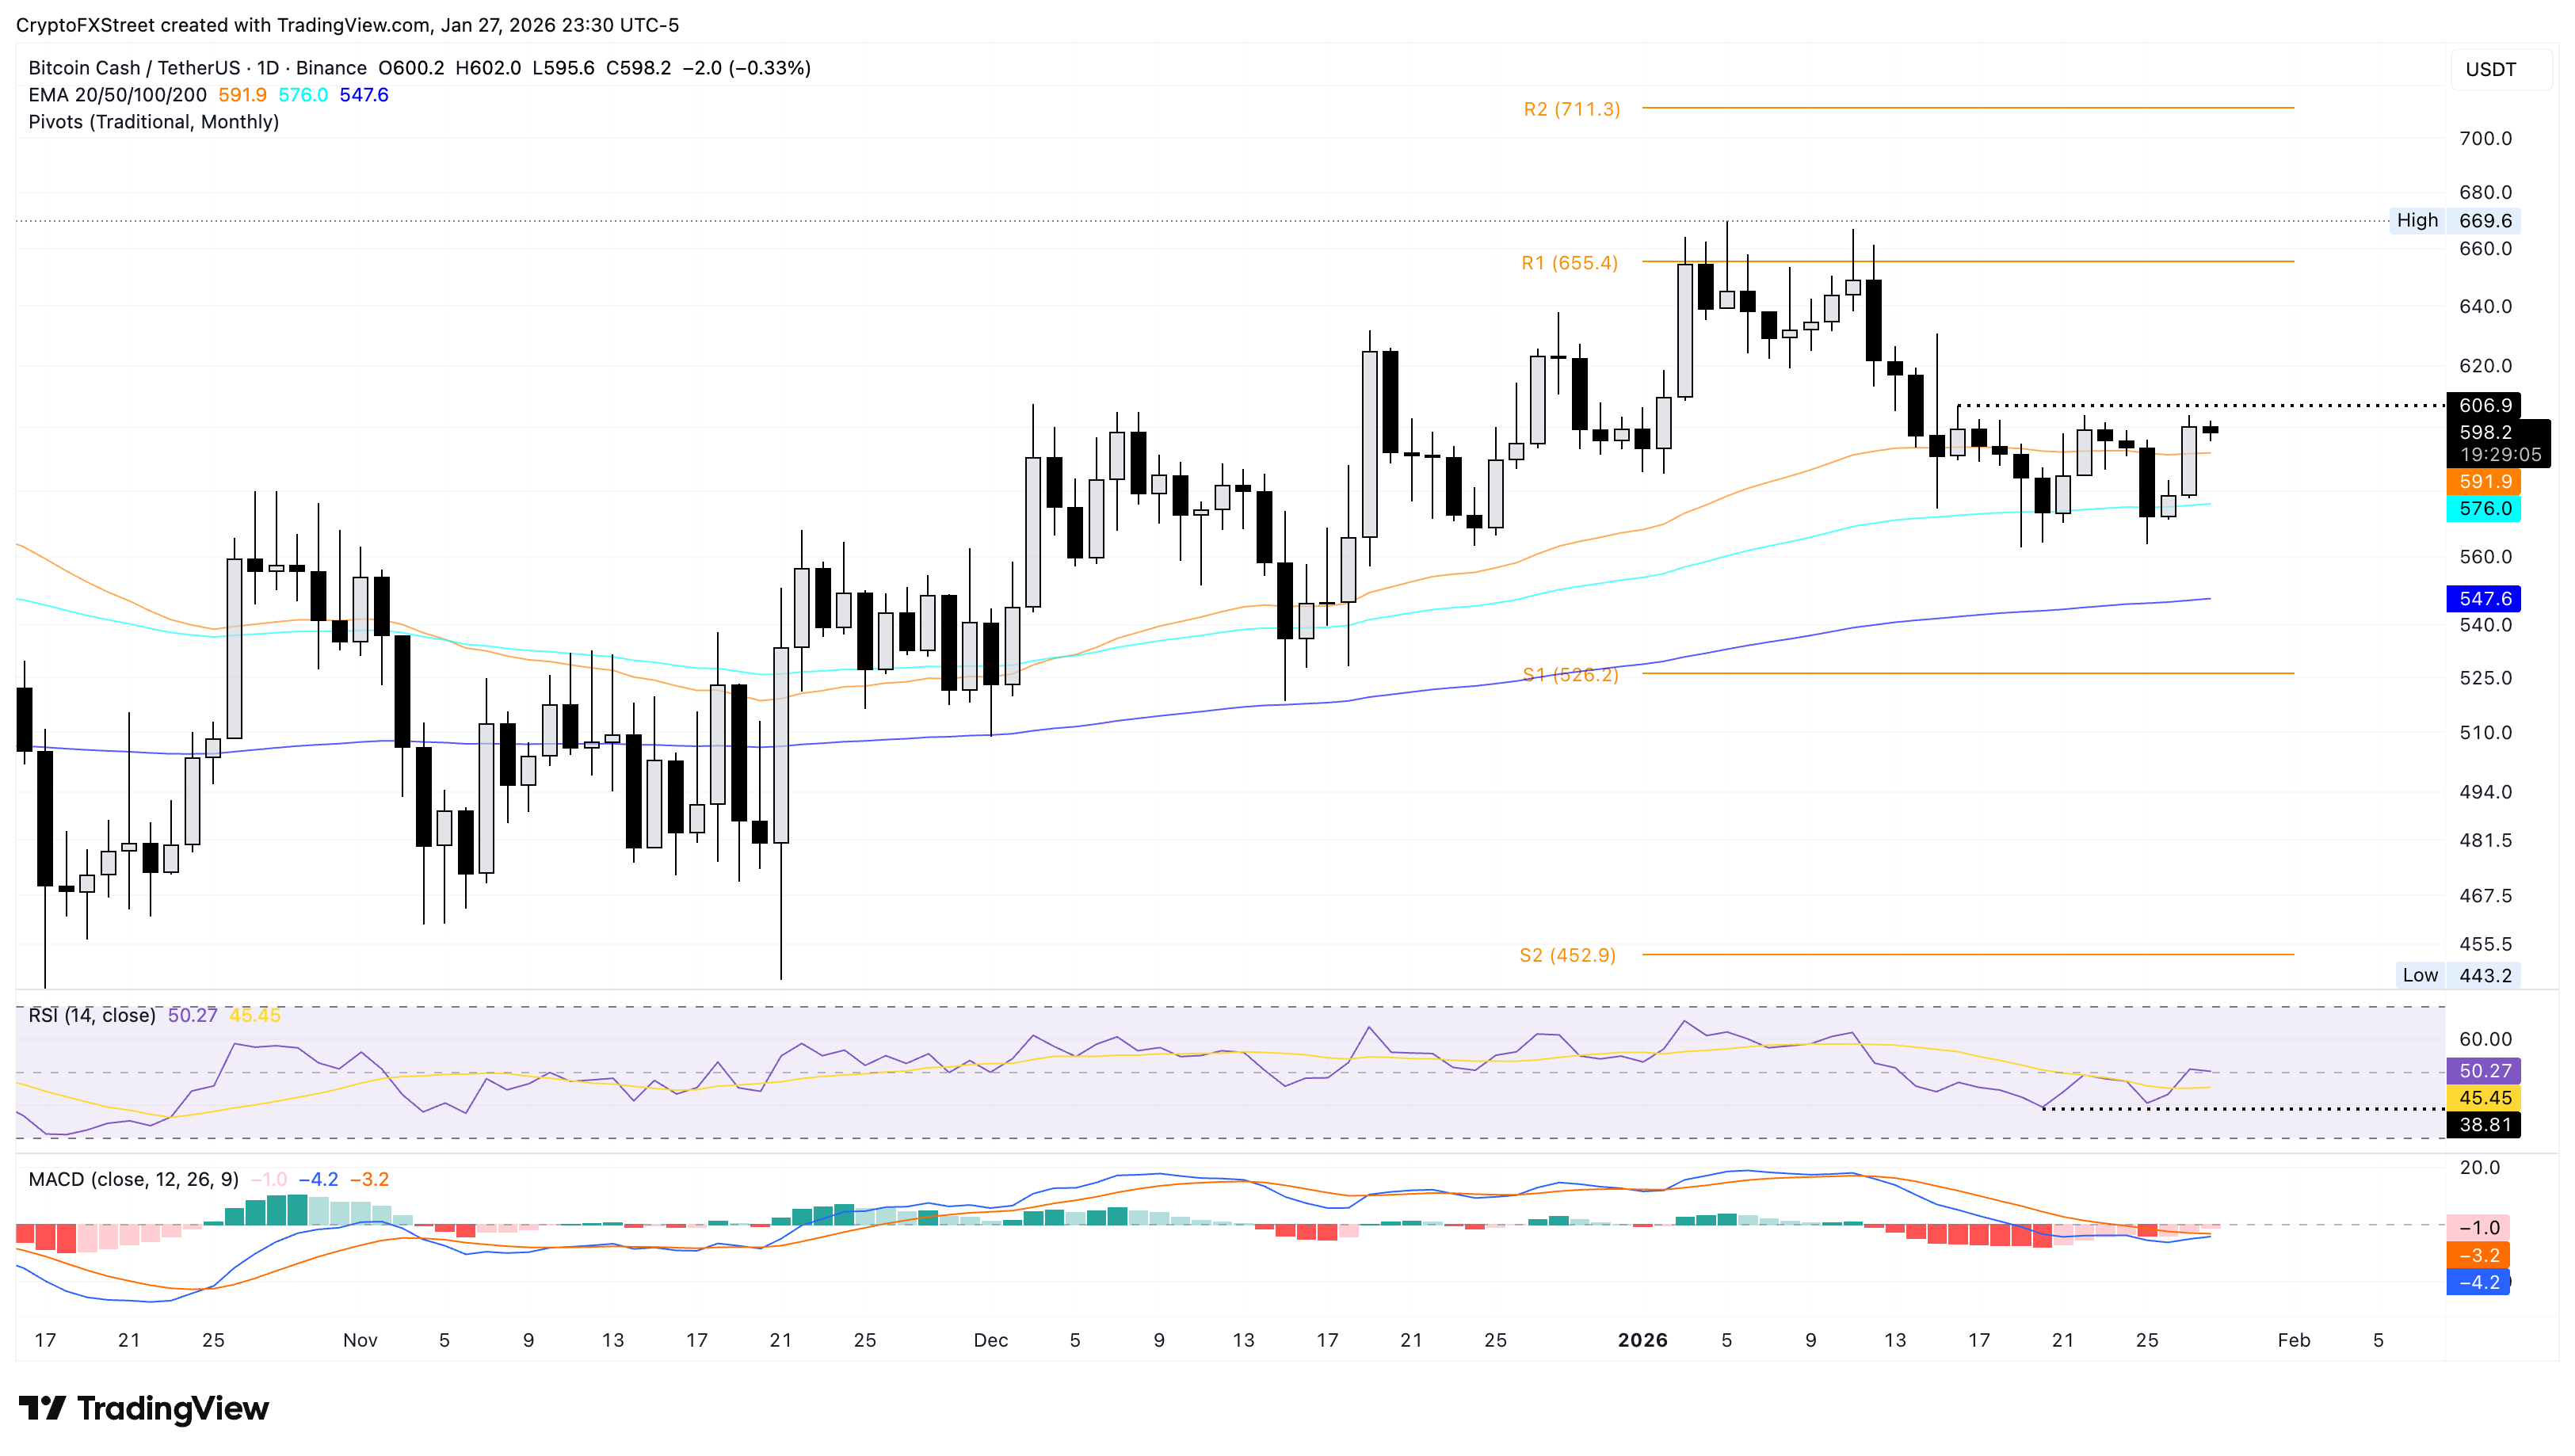
BCH/USDT daily price chart.

On the downside, if BCH slips below the 100-day EMA at $575, it would extend the decline toward the 200-day EMA at $547.

ข้อจำกัดความรับผิดชอบ: เพื่อการอ้างอิงเท่านั้น ผลการดำเนินงานในอดีตไม่ได้บ่งบอกถึงผลลัพธ์ในอนาคต
placeholder
WTI เผชิญแรงกดดันขาขึ้นท่ามกลางการโจมตีในตะวันออกกลาง แม้คาดการณ์อุปทานทำสถิติสูงสุดราคาน้ำมัน West Texas Intermediate (WTI) เคลื่อนไหวเพียงเล็กน้อย หลังจากปรับตัวเพิ่มขึ้นเล็กน้อยในวันก่อนหน้า โดยซื้อขายอยู่ที่ประมาณ 83.00 ดอลลาร์ต่อบาร์เรลในช่วงเวลาการซื้อขายของเอเชียในวันศุกร์
ผู้เขียน  FXStreet
11 เดือน 20 วัน ศุกร์
ราคาน้ำมัน West Texas Intermediate (WTI) เคลื่อนไหวเพียงเล็กน้อย หลังจากปรับตัวเพิ่มขึ้นเล็กน้อยในวันก่อนหน้า โดยซื้อขายอยู่ที่ประมาณ 83.00 ดอลลาร์ต่อบาร์เรลในช่วงเวลาการซื้อขายของเอเชียในวันศุกร์
placeholder
คาดการณ์ราคา EURJPY: ร่วงลงต่ำกว่า 175.00 โดยแนวโน้มขาลงยังคงมีอิทธิพลเมื่ออยู่ต่ำกว่า SMA 100 วันในช่วงเช้าของตลาดลงทุนยุโรปวันศุกร์ คู่ EURJPY เคลื่อนไหวในแดนลบใกล้ระดับ 174.80 เงินเยนญี่ปุ่น (JPY) แข็งค่าขึ้นเมื่อเทียบกับยูโร (EUR) เนื่องจากเทรดเดอร์เฝ้าระวังการแทรกแซงจากทางการญี่ปุ่นอย่างใกล้ชิด
ผู้เขียน  FXStreet
11 เดือน 20 วัน ศุกร์
ในช่วงเช้าของตลาดลงทุนยุโรปวันศุกร์ คู่ EURJPY เคลื่อนไหวในแดนลบใกล้ระดับ 174.80 เงินเยนญี่ปุ่น (JPY) แข็งค่าขึ้นเมื่อเทียบกับยูโร (EUR) เนื่องจากเทรดเดอร์เฝ้าระวังการแทรกแซงจากทางการญี่ปุ่นอย่างใกล้ชิด
placeholder
ข่าวหุ้นวันนี้ 3 มหาอำนาจออกปฏิญญาสันติภาพ หุ้นสหรัฐดิ่งหลัง Anthropic เทรดวันแรก ทองหลุด $3,600 จับตา SET ยืน 1,460ทันทุกกระแสการเงิน สรุปข่าวเด่น Forex หุ้น ทองคำ คริปโตฯ และเศรษฐกิจรอบวัน วิเคราะห์แนวโน้มตลาดด้วยข้อมูลเชิงลึก อ่านง่าย เข้าใจไว อัปเดตล่าสุดที่นี่
ผู้เขียน  Mitrade
11 เดือน 20 วัน ศุกร์
ทันทุกกระแสการเงิน สรุปข่าวเด่น Forex หุ้น ทองคำ คริปโตฯ และเศรษฐกิจรอบวัน วิเคราะห์แนวโน้มตลาดด้วยข้อมูลเชิงลึก อ่านง่าย เข้าใจไว อัปเดตล่าสุดที่นี่
placeholder
คาดการณ์ราคาโลหะเงิน: แรงขาย XAG/USD ยังคงควบคุมตลาดต่ำกว่า $42.00 ท่ามกลางภาวะขายมากเกินไปโลหะเงิน (XAGUSD) ปรับตัวลดลงเป็นวันที่สามติดต่อกัน ซึ่งนับเป็นขาลงวันที่หกจากเจ็ดวันล่าสุด และร่วงลงสู่ระดับต่ำสุดนับตั้งแต่เดือนกันยายน 2025 ในช่วงเซสชั่นเอเชียของวันศุกร์
ผู้เขียน  FXStreet
11 เดือน 20 วัน ศุกร์
โลหะเงิน (XAGUSD) ปรับตัวลดลงเป็นวันที่สามติดต่อกัน ซึ่งนับเป็นขาลงวันที่หกจากเจ็ดวันล่าสุด และร่วงลงสู่ระดับต่ำสุดนับตั้งแต่เดือนกันยายน 2025 ในช่วงเซสชั่นเอเชียของวันศุกร์
placeholder
ทองคำร่วงลงแตะระดับต่ำสุดในรอบ 14 เดือนต่ำกว่า $3,650 จากสัญญาณของเฟดที่เข้มงวดนโยบายการเงินในช่วงเช้าของตลาดลงทุนเอเชียวันศุกร์ ราคาทองคํา (XAUUSD) เผชิญแรงขายบางส่วนปรับตัวลงมาใกล้ $3,630 ราคาทองคำปรับตัวลงต่อ เนื่องจากการคาดการณ์ว่าธนาคารกลางสหรัฐฯ (เฟด) จะปรับขึ้นอัตราดอกเบี้ยเพิ่มเติมมีมากขึ้น.
ผู้เขียน  FXStreet
11 เดือน 20 วัน ศุกร์
ในช่วงเช้าของตลาดลงทุนเอเชียวันศุกร์ ราคาทองคํา (XAUUSD) เผชิญแรงขายบางส่วนปรับตัวลงมาใกล้ $3,630 ราคาทองคำปรับตัวลงต่อ เนื่องจากการคาดการณ์ว่าธนาคารกลางสหรัฐฯ (เฟด) จะปรับขึ้นอัตราดอกเบี้ยเพิ่มเติมมีมากขึ้น.
ตราสารที่เกี่ยวข้อง
goTop
quote