
Crypto Today: Bitcoin seeks $120,000 breakout, Ethereum $5,000, and XRP eyes record high
- Bitcoin rises above $113,000, affirming bullish sentiment in the broader crypto market.
- Ethereum steadies its recovery, targeting a new all-time high around $5,000.
- XRP holds above the critical $3.00 level as bulls set their sights on the all-time high of $3.66.
Bitcoin (BTC) showcases a bullish technical picture, trading slightly above $113,000 on Tuesday as cryptocurrencies generally recover. Interest in the largest crypto by market capitalisation has steadied following the drawdown in August, as optimism grows for what would be the first United States (US) Federal Reserve’s (Fed) interest rate cut this year on September 17.
Altcoins, including Ethereum (ETH) and Ripple (XRP), are edging higher, buoyed by growing anticipation for a bullish second quarter. The largest smart contract token, ETH, eyes a breakout above the $4,400 short-term resistance, while XRP seeks support at $3.00.
Data spotlight: Bitcoin ETFs renew inflows
Interest in Bitcoin has recently leaned toward treasury companies, with Japan’s Metaplanet adding 136 BTC on Monday. As reported, Bitcoin holdings by non-mining companies have surged to approximately 849,420 BTC valued at around $96 billion.
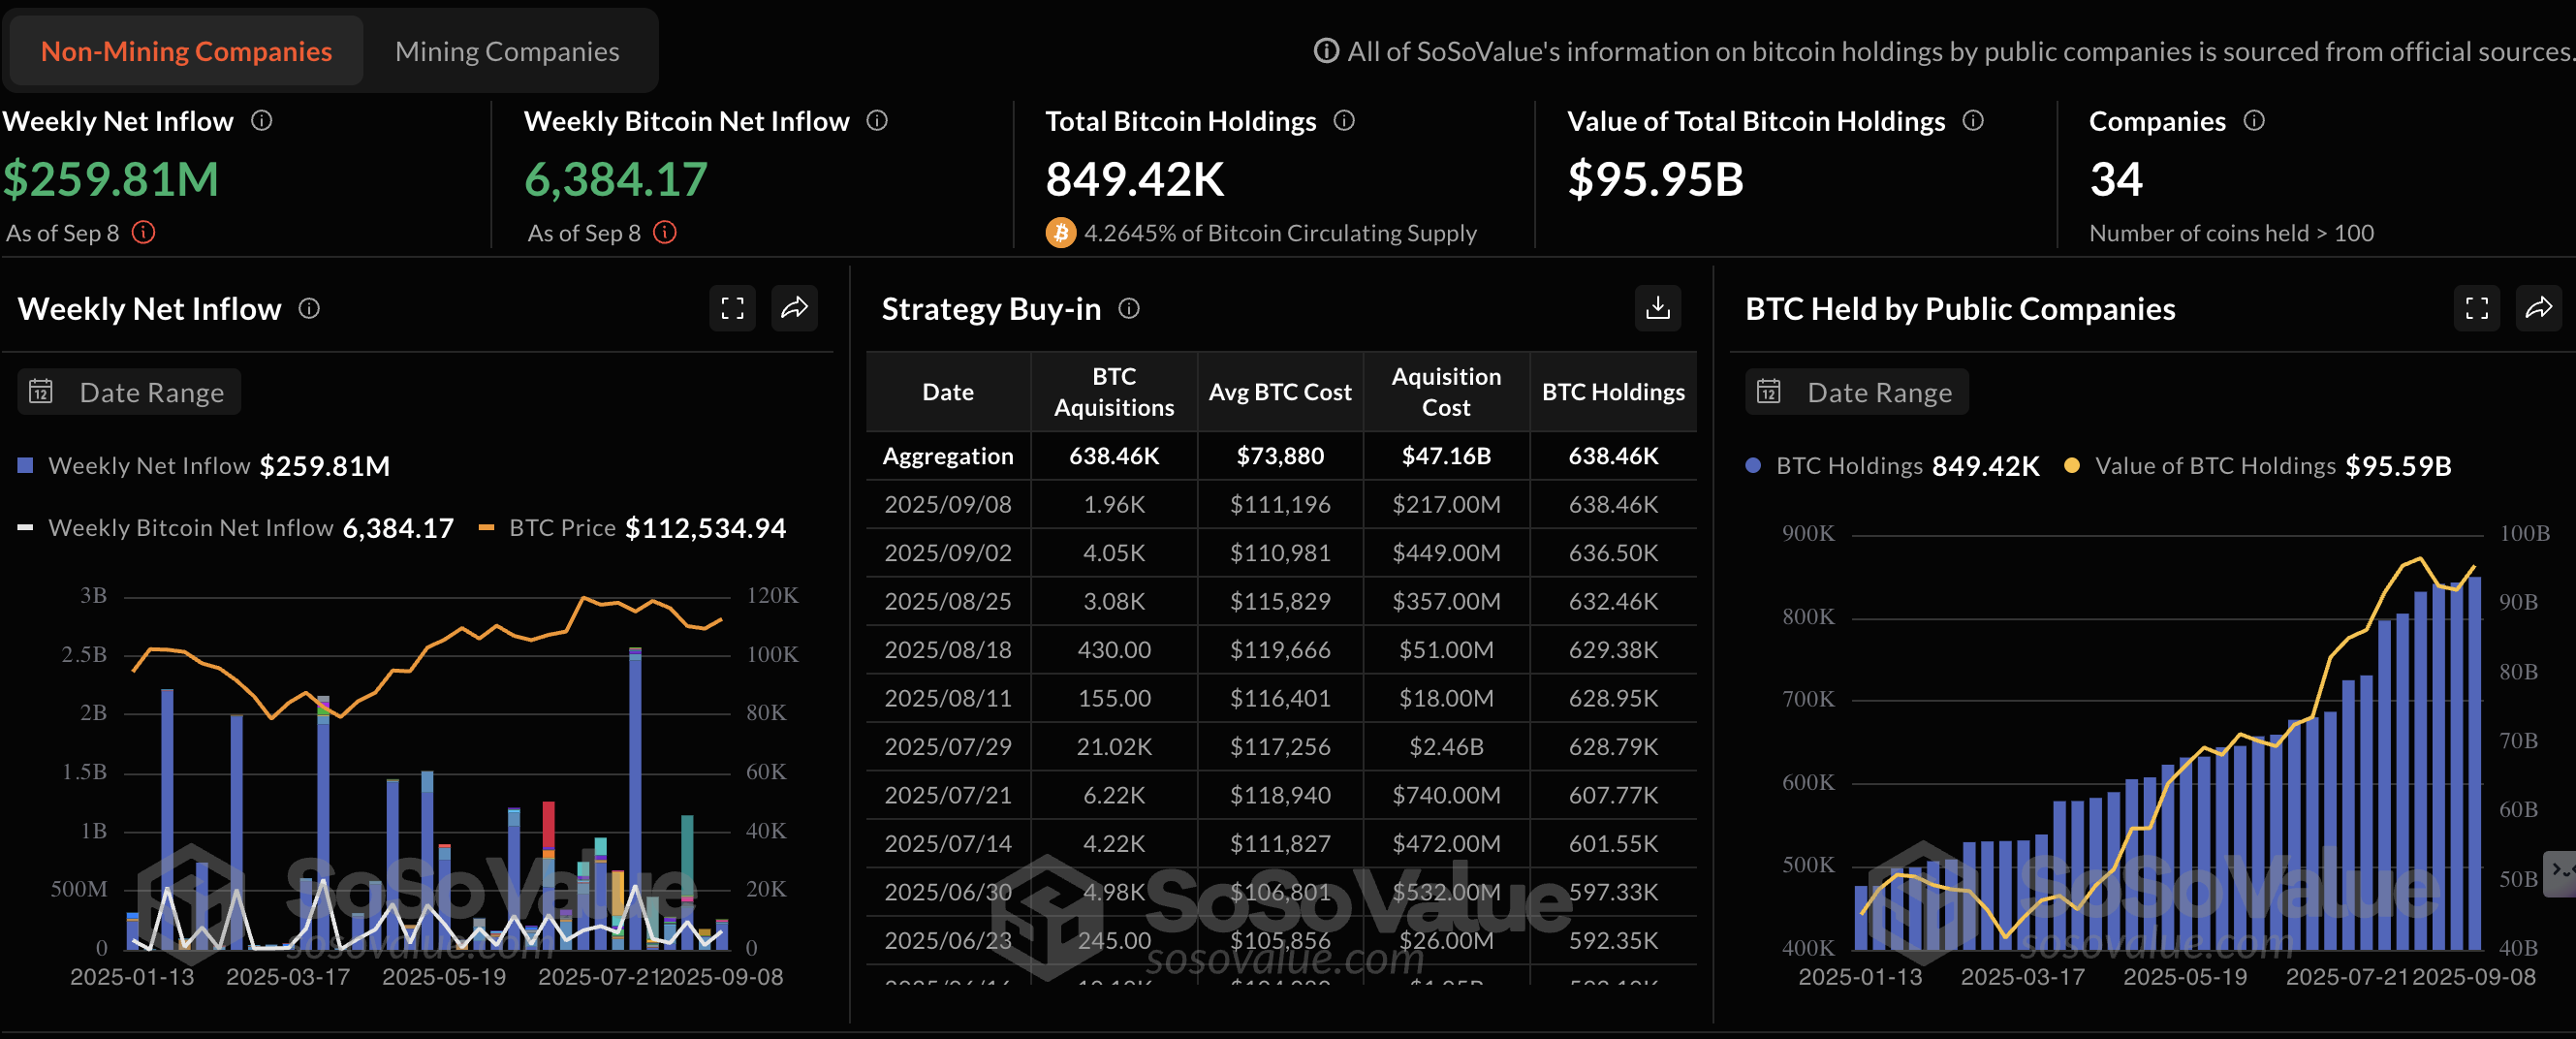
Bitcoin holdings by non-mining companies | Source: SoSoValue
After facing volatility last week amid a sticky risk-off sentiment, Bitcoin Exchange Traded Funds (ETFs) in the US resumed inflows on Monday. According to SoSoValue data, products providing direct exposure to the BTC price via stock exchanges saw inflows of approximately $368 million, marking a significant improvement from an outflow of $160 million on Friday.
If the bullish trend steadies in the coming days and weeks, growing demand for Bitcoin could bolster the uptrend, paving the way for a fresh rally to a new record high above the current at $124,474.
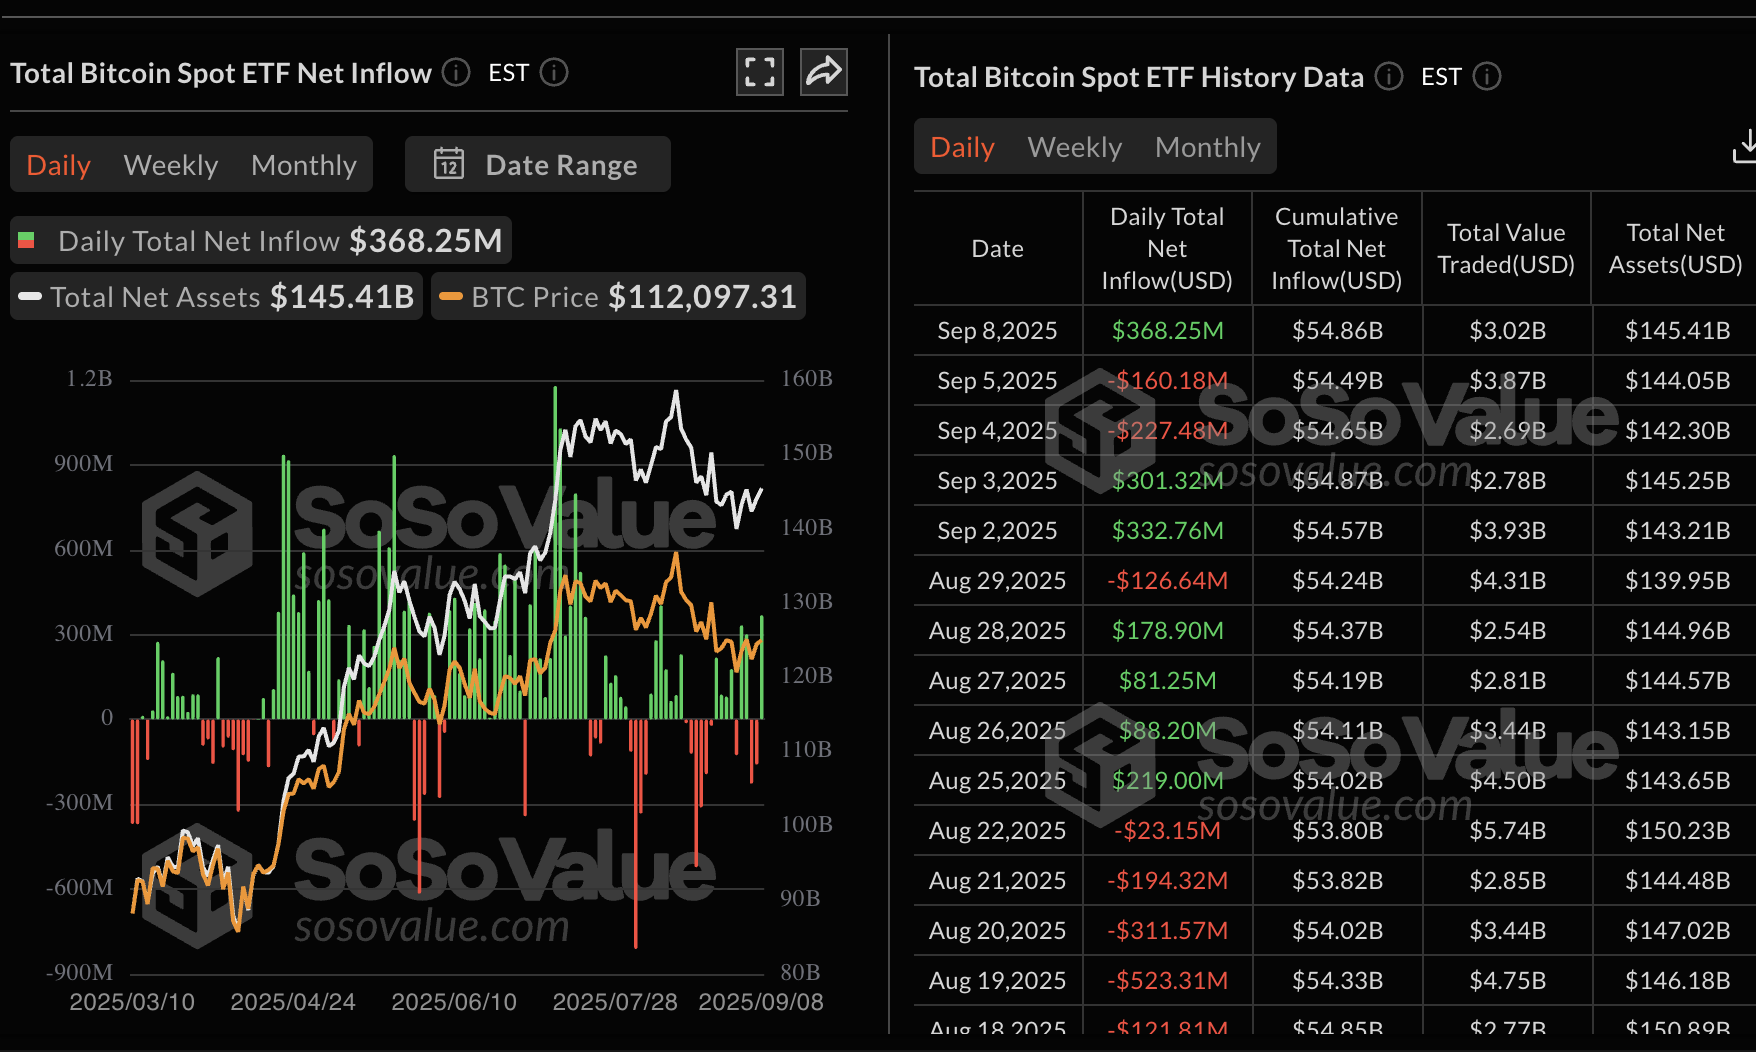
Bitcoin ETF stats | Source: SoSoValue
On the other hand, Ethereum faces declining interest from institutional investors, as evidenced by a steady outflow streak that has been maintained since August 29. Ethereum spot ETFs in the US saw a total of $97 million in outflow volume on Monday, bringing the cumulative net inflow to $12.63 billion and the net assets $27.39 billion.
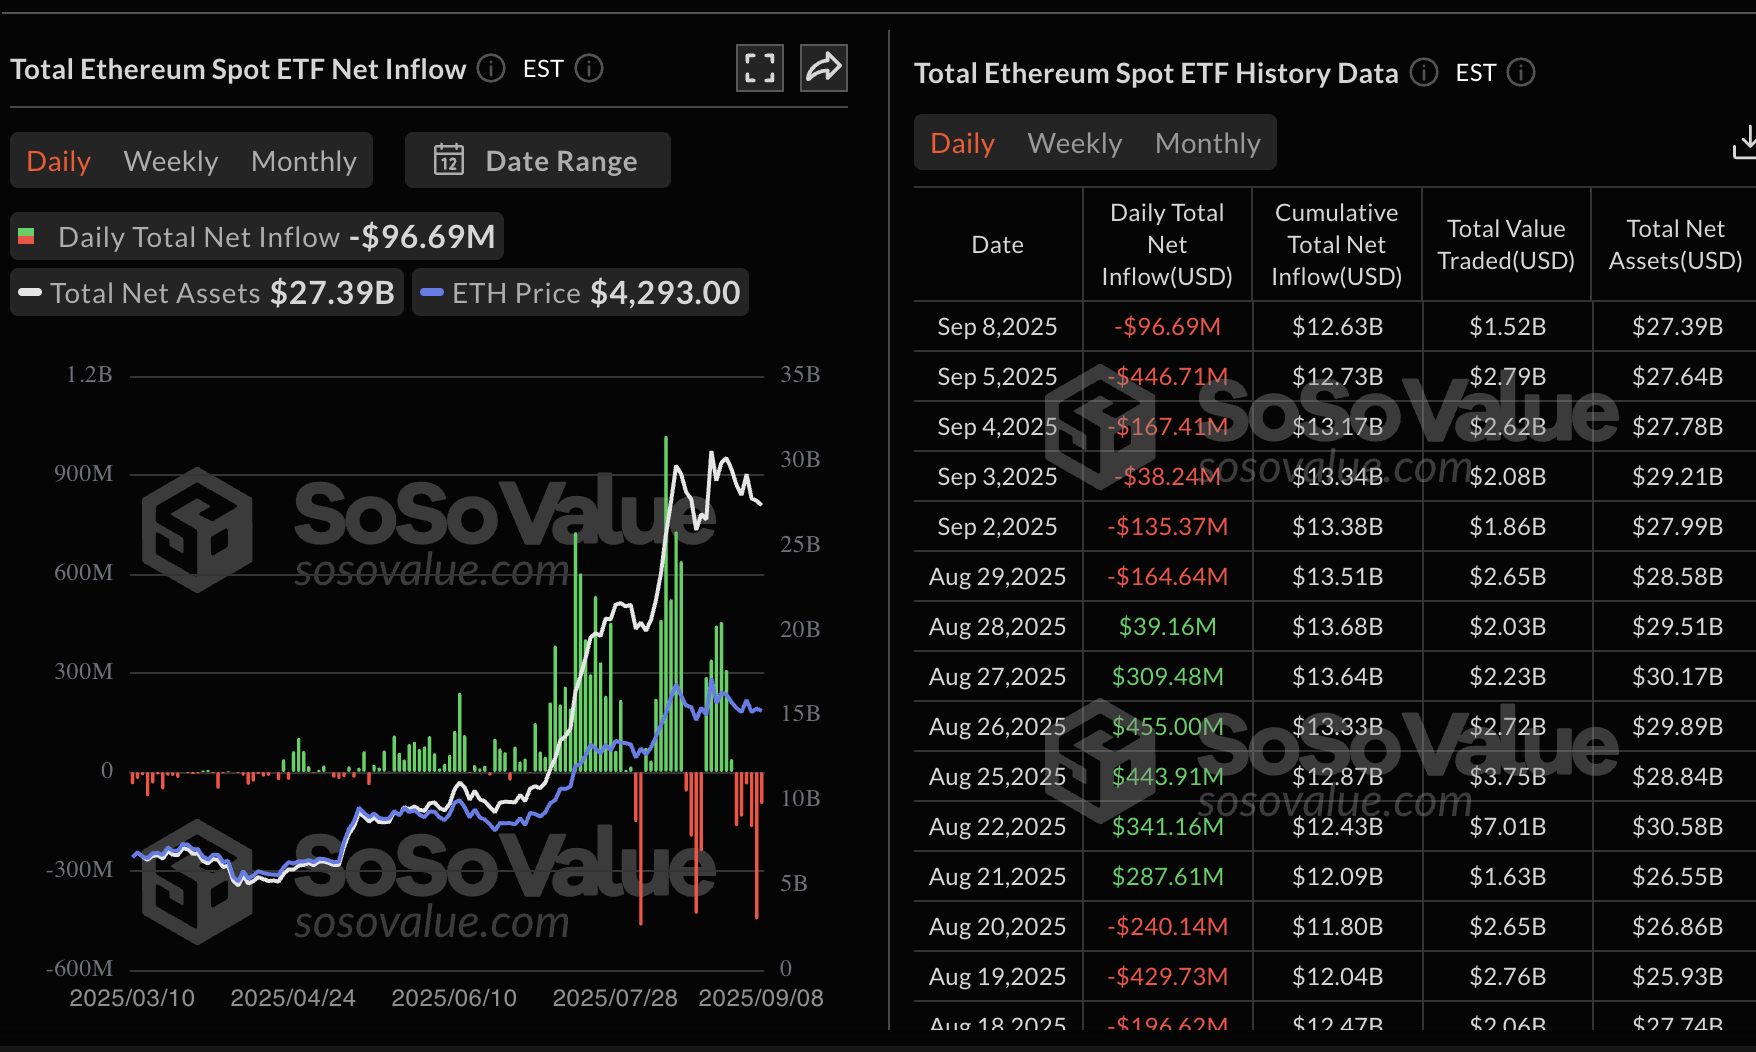
Ethereum spot ETF stats | Source: SoSoValue
Chart of the day: Bitcoin rises above $113,000
Bitcoin holds marginally above $113,000, after correcting from an intraday high of $113,293. This marks a 5.5% increase from support at $107,240, tested on September 1.
A daily close above the 50-day Exponential Moving Average (EMA) at $112,947 would bolster the bullish outlook.
A buy signal from the Moving Average Convergence Divergence (MACD) indicator, triggered on Sunday, reinforces the bullish outlook. There’s a higher chance that the bullish momentum will continue to increase with the blue MACD line holding above the red signal line.
The Relative Strength Index (RSI) at 51 on the daily chart indicates that buying pressure is increasing. Higher RSI readings reinforce the bullish grip and increase the probability of a breakout above the $120,000 key milestone.
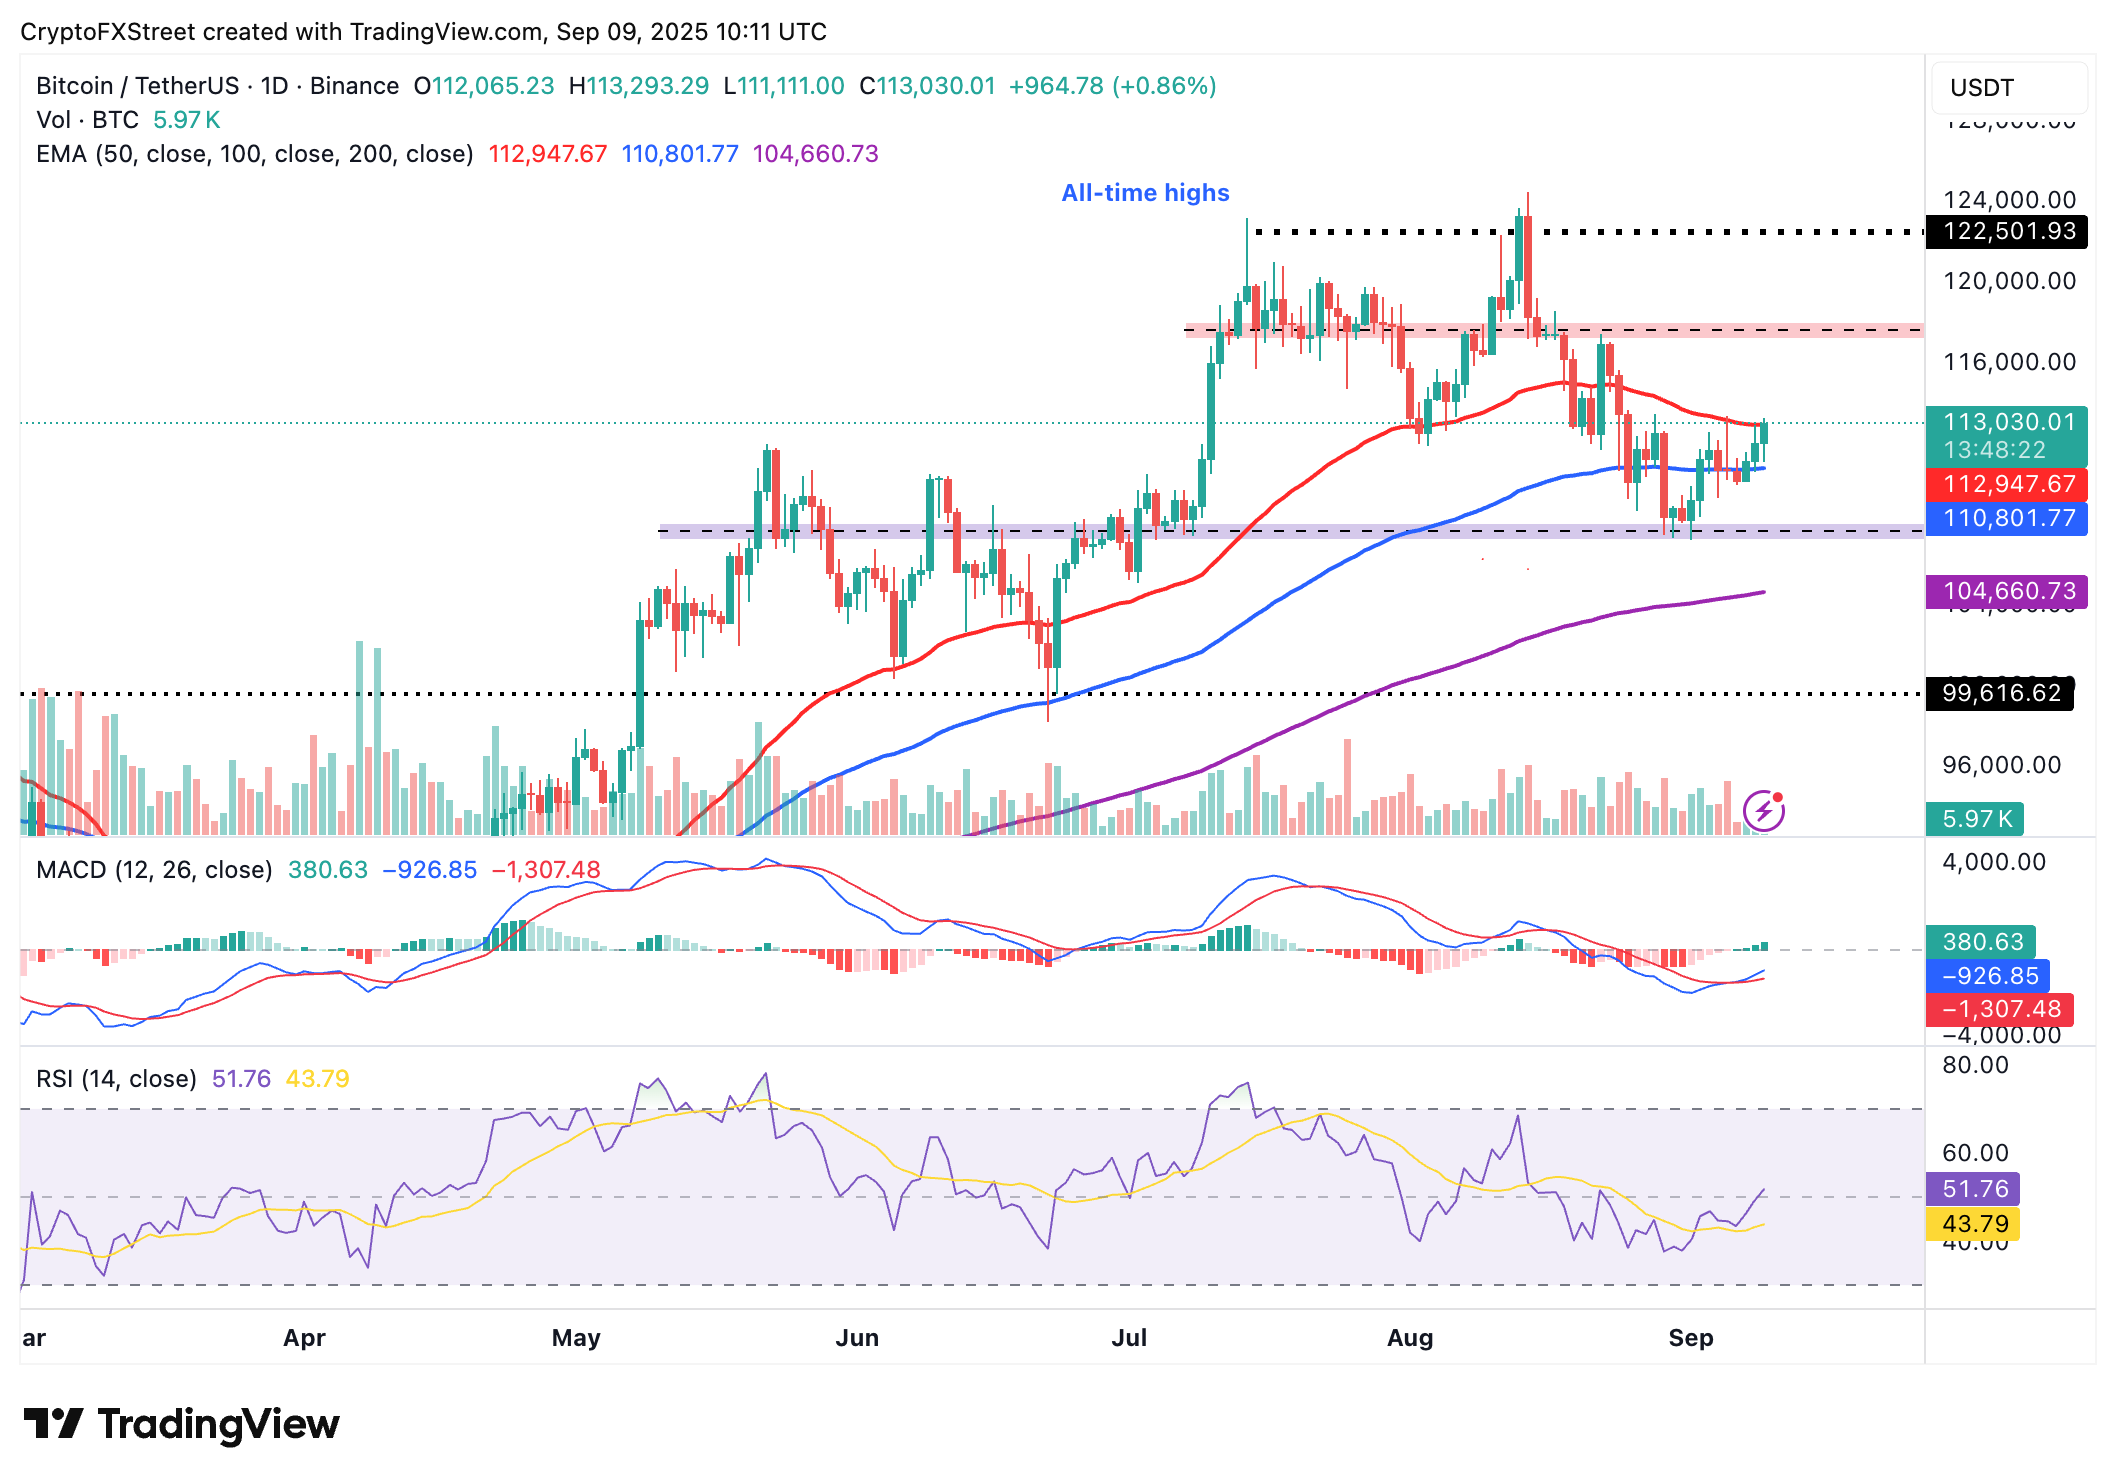
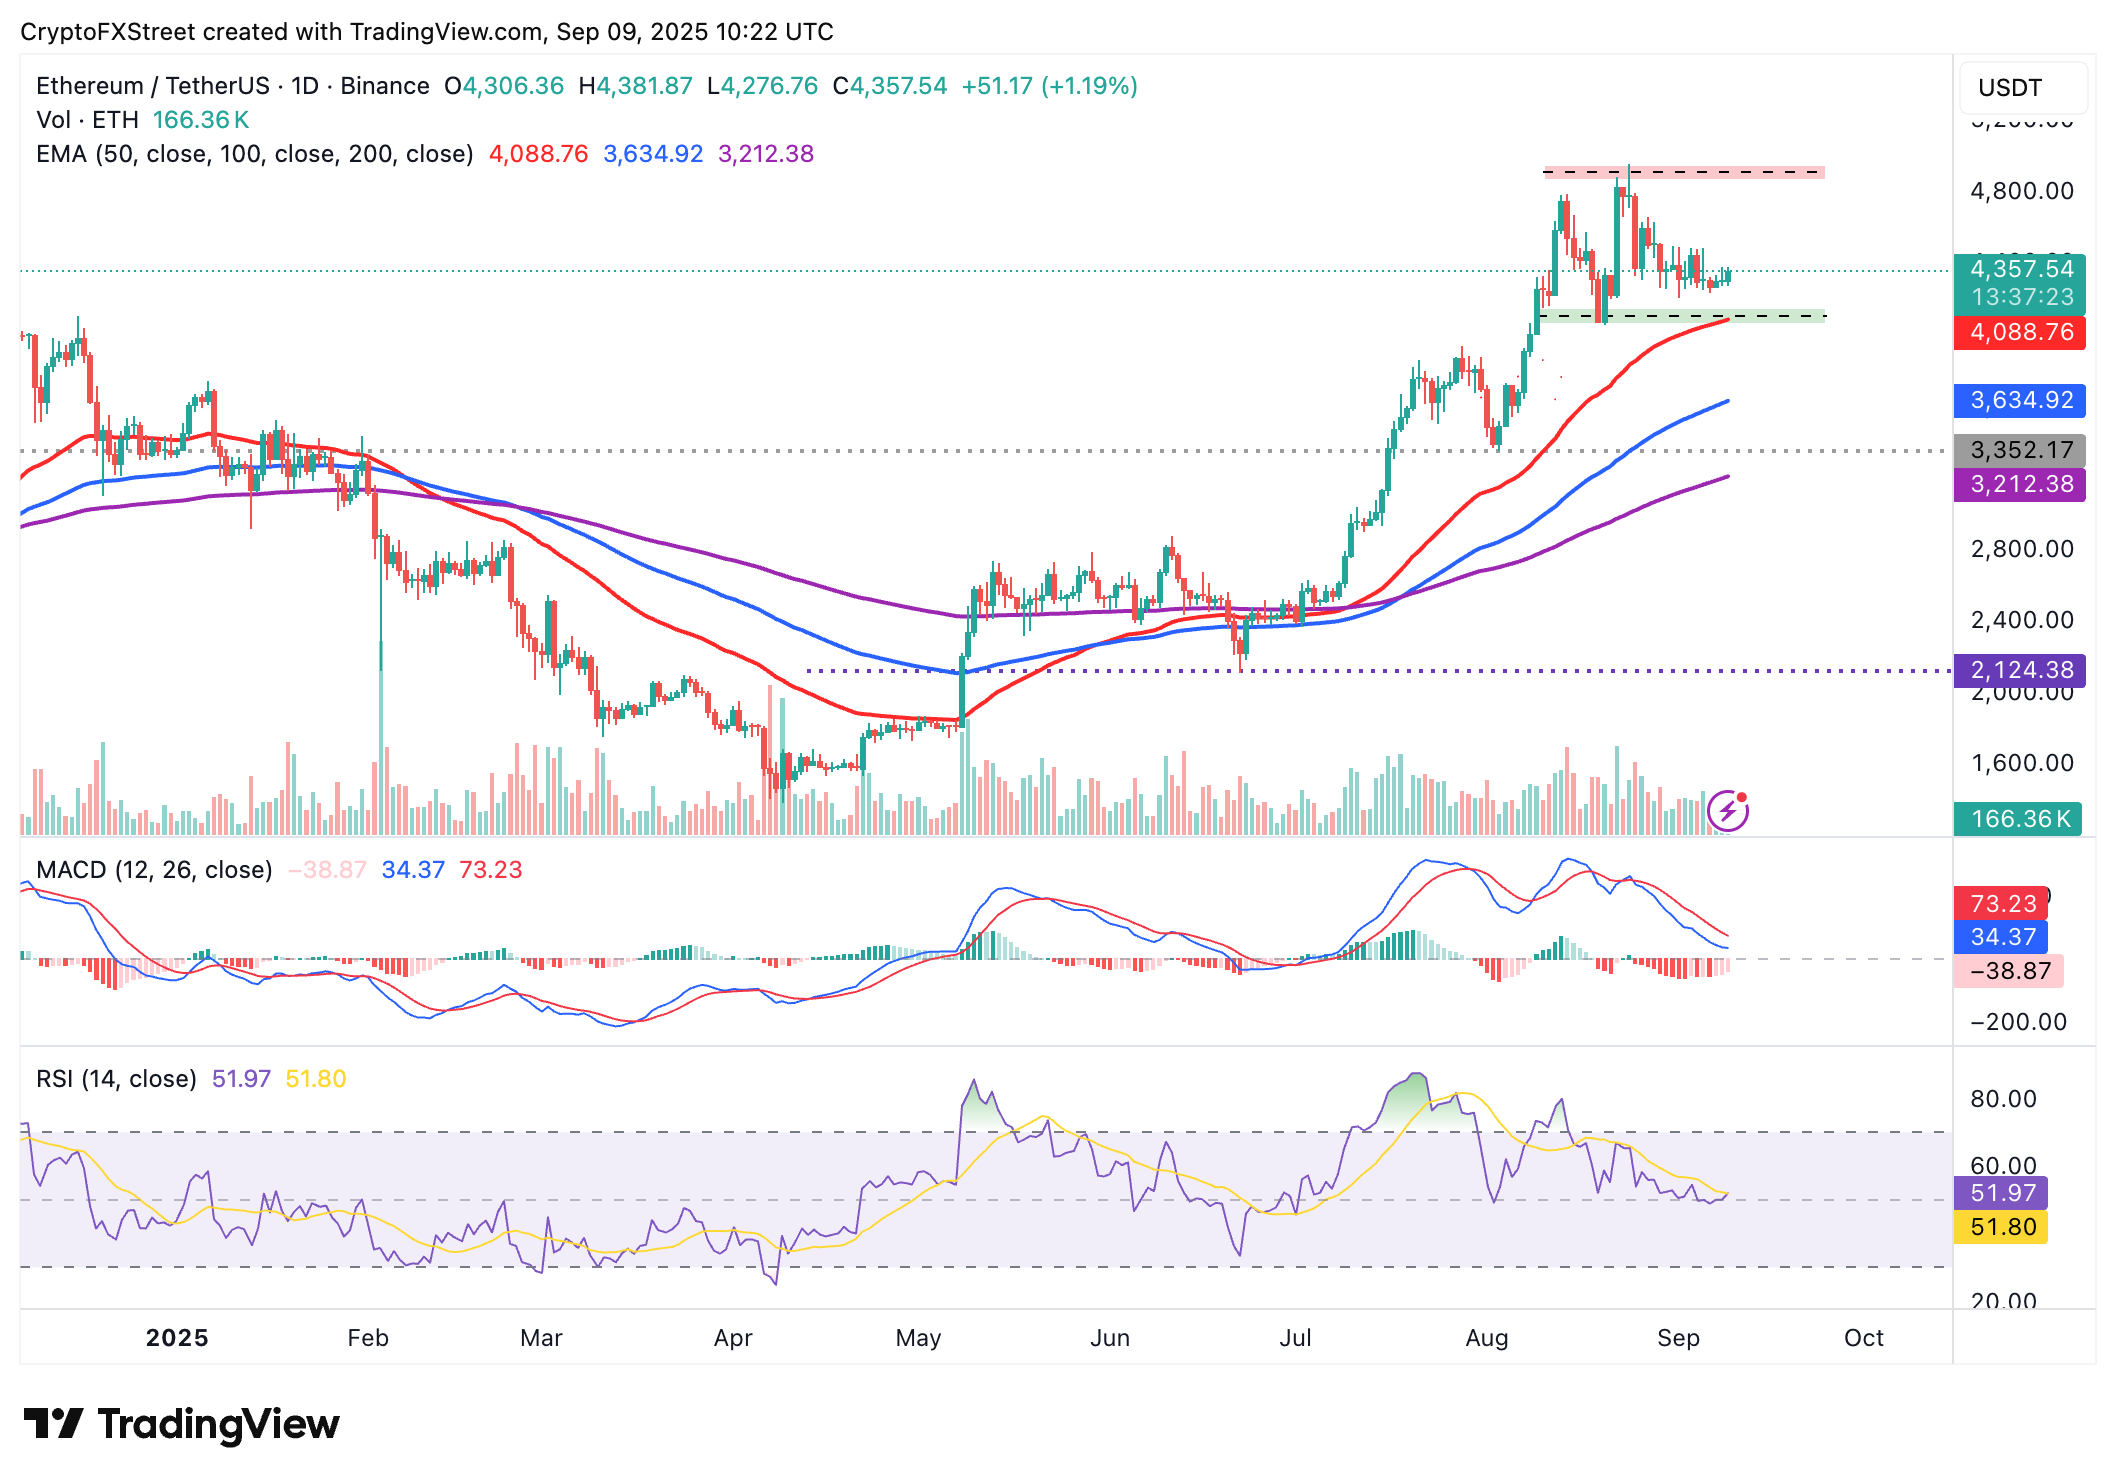
BTC/USDT daily chart
Altcoins update: Ethereum, XRP hold bullish structure
Ethereum is attempting to extend its recovery from support close to the 50-day EMA at $4,088 at the time of writing on Tuesday. A reversal of the RSI above the 50 midline reinforces the bullish grip as buying pressure increases.
Traders will look out for a breach of the $4,400 resistance to ascertain ETH’s recovery potential toward a new record high above the psychological $5,000 level.
Still, the MACD indicator shows that the Ethereum price is not out of the woods yet, particularly with a sell signal sustained since August 25.
A steady bullish reversal in Ethereum price could follow a buy signal likely to be triggered when the MACD line in blue crosses above the red signal line.
ETH/USDT daily chart
As for XRP, the path of least resistance is upward, backed by a break above the $3.00 critical level. A buy signal from the MACD indicator supports its short-term bullish outlook, while the sharp rise of the RSI at 54 indicates increasing bullish momentum.
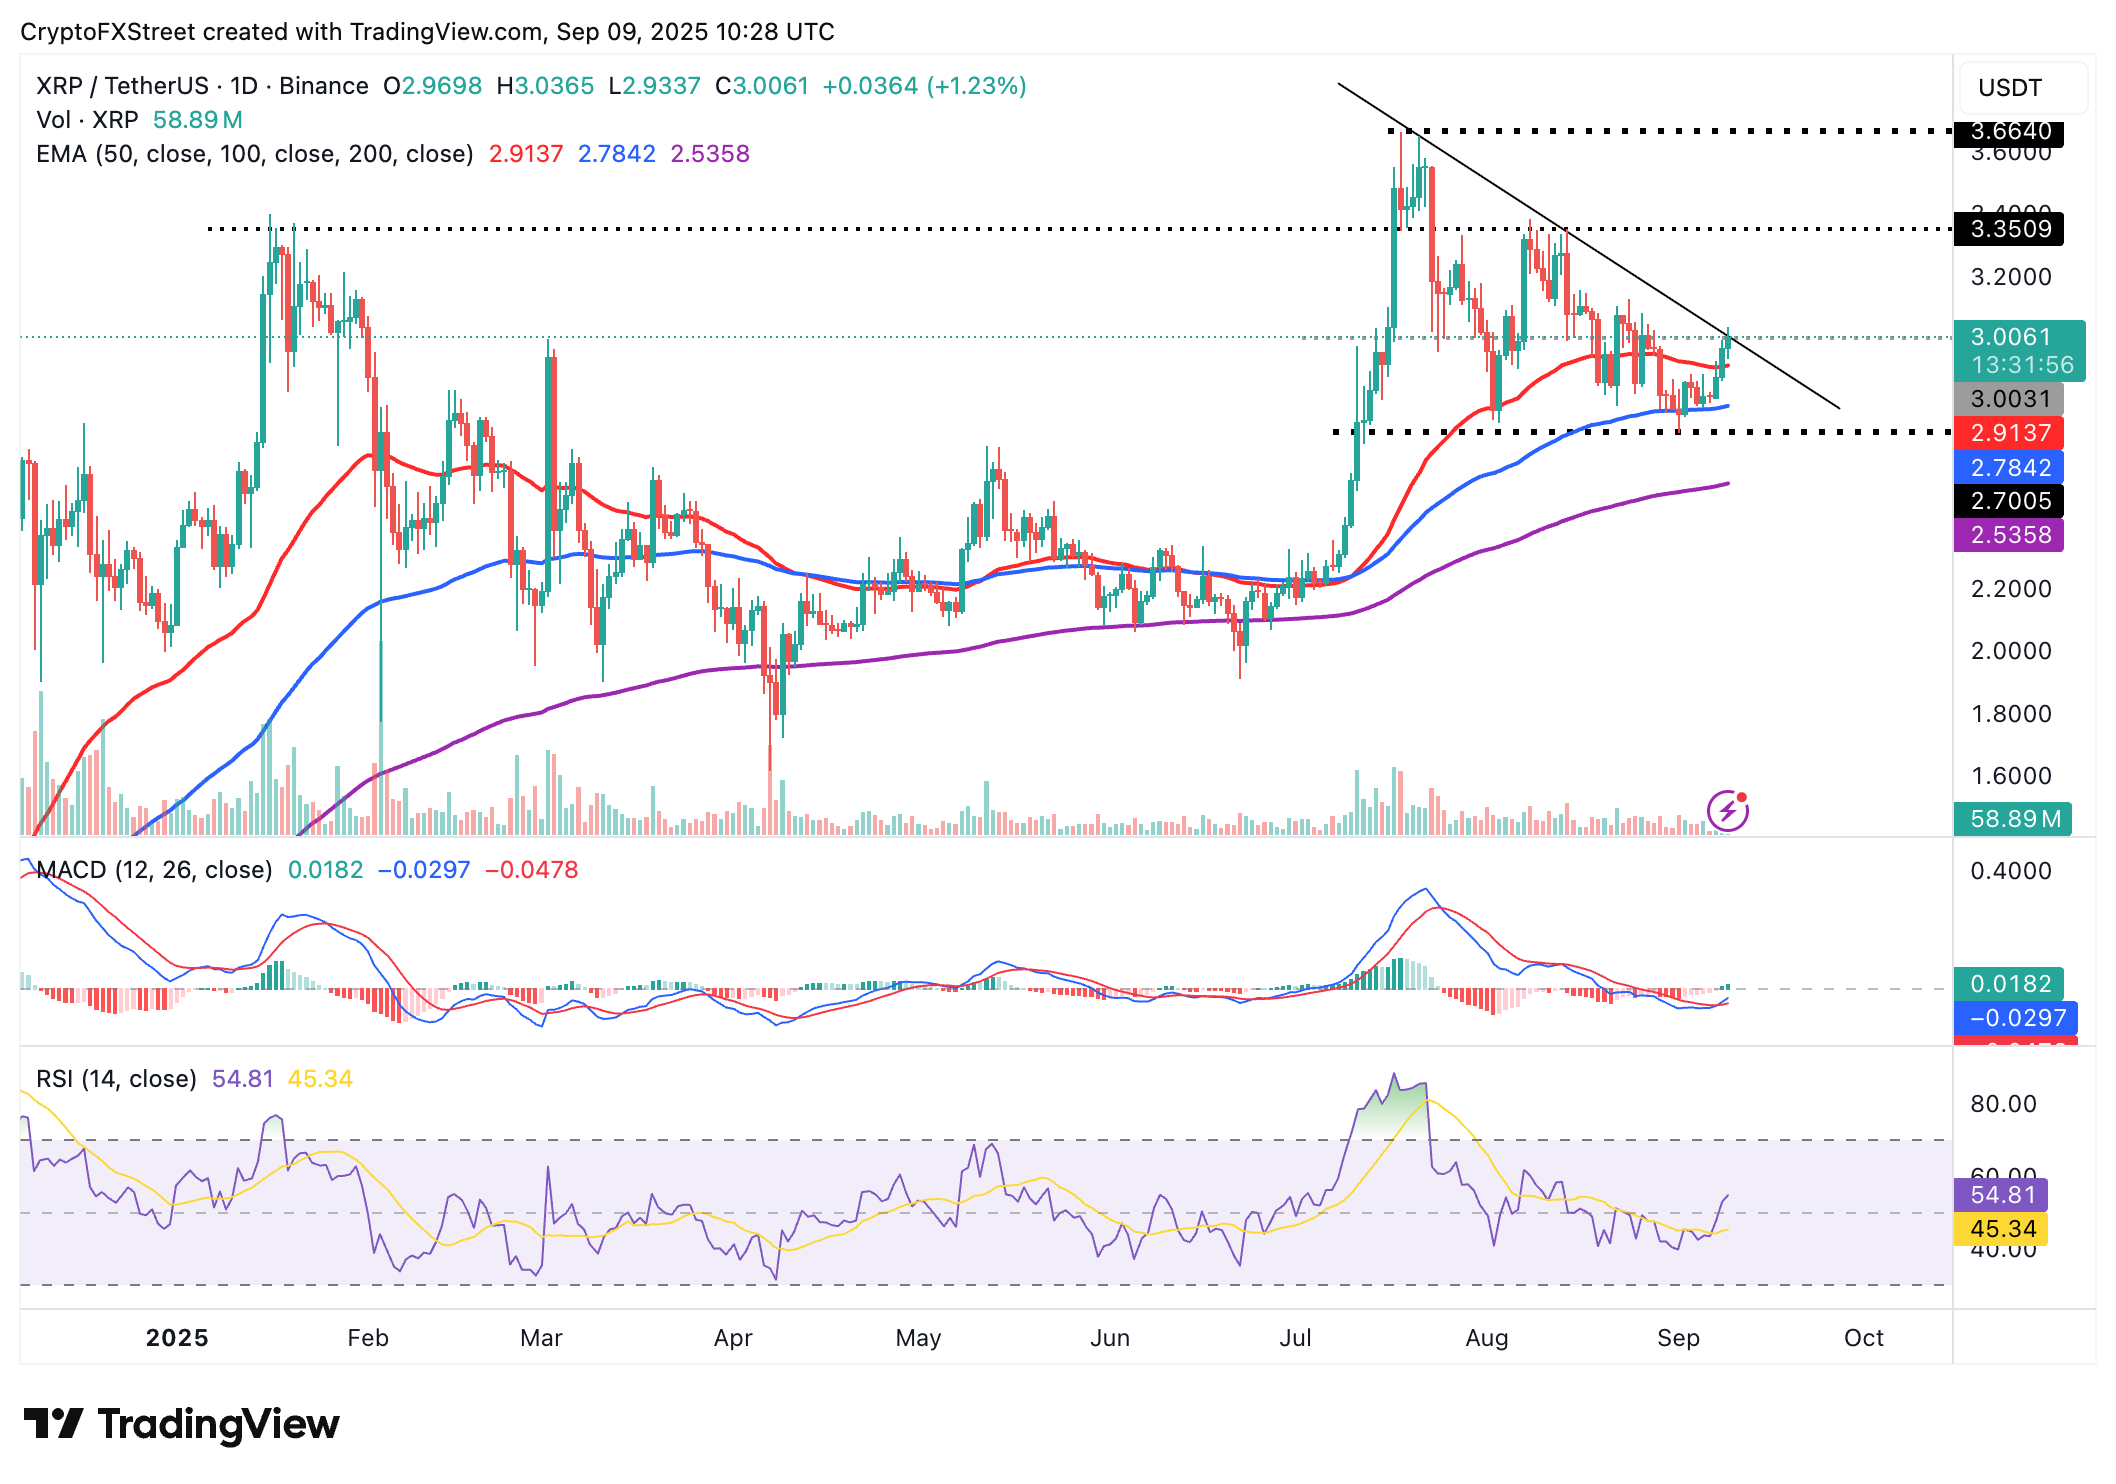
XRP/USDT daily chart
As traders increase exposure amid rising risk-on sentiment, the chances of XRP breaking out toward its record high grow significantly. If the price reverses below the $3.00 level, the 50-day EMA at $2.91 is in line to offer support.
Bitcoin, altcoins, stablecoins FAQs
Bitcoin is the largest cryptocurrency by market capitalization, a virtual currency designed to serve as money. This form of payment cannot be controlled by any one person, group, or entity, which eliminates the need for third-party participation during financial transactions.
Altcoins are any cryptocurrency apart from Bitcoin, but some also regard Ethereum as a non-altcoin because it is from these two cryptocurrencies that forking happens. If this is true, then Litecoin is the first altcoin, forked from the Bitcoin protocol and, therefore, an “improved” version of it.
Stablecoins are cryptocurrencies designed to have a stable price, with their value backed by a reserve of the asset it represents. To achieve this, the value of any one stablecoin is pegged to a commodity or financial instrument, such as the US Dollar (USD), with its supply regulated by an algorithm or demand. The main goal of stablecoins is to provide an on/off-ramp for investors willing to trade and invest in cryptocurrencies. Stablecoins also allow investors to store value since cryptocurrencies, in general, are subject to volatility.
Bitcoin dominance is the ratio of Bitcoin's market capitalization to the total market capitalization of all cryptocurrencies combined. It provides a clear picture of Bitcoin’s interest among investors. A high BTC dominance typically happens before and during a bull run, in which investors resort to investing in relatively stable and high market capitalization cryptocurrency like Bitcoin. A drop in BTC dominance usually means that investors are moving their capital and/or profits to altcoins in a quest for higher returns, which usually triggers an explosion of altcoin rallies.
บทความแนะนำ


