
Bitcoin Price Forecast: BTC stabilizes as Fed Cook vows lawsuit over termination by President Trump
- Bitcoin price steadies around $110,700 on Wednesday, following a modest recovery the previous day.
- Fed’s Cook announces plans to file a lawsuit challenging her termination by US President Donald Trump.
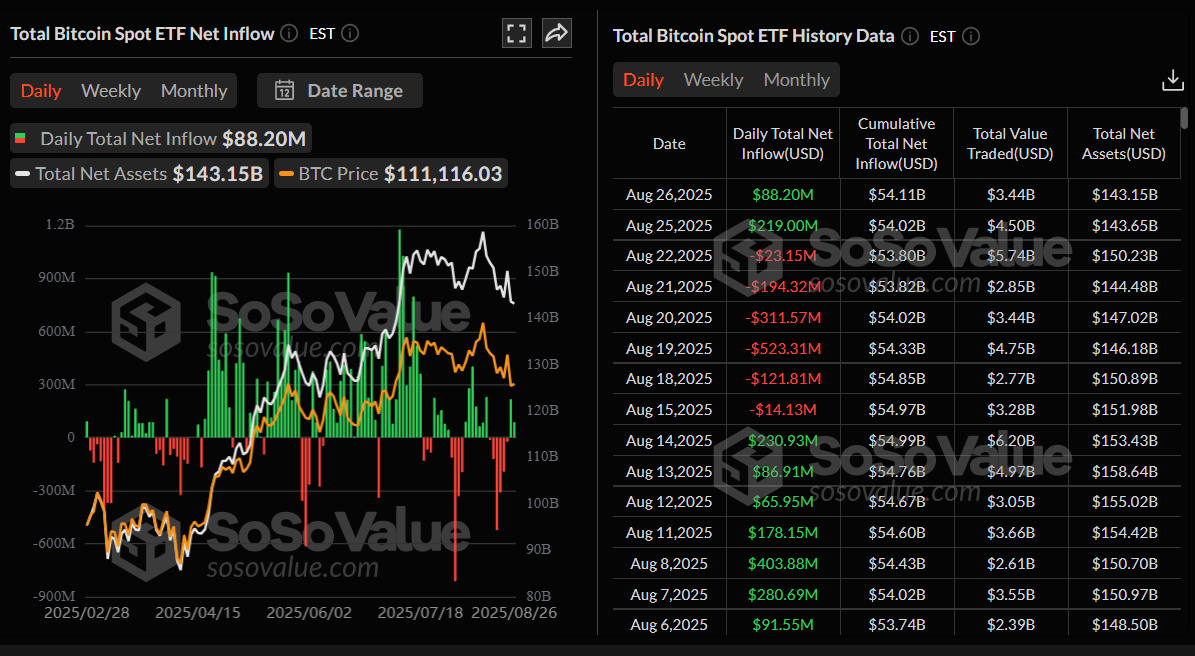
- US-listed spot Bitcoin ETFs recorded $88 million in inflows on Tuesday, while rising leverage concentration raises the risk of squeezes.
Bitcoin (BTC) is holding steady midweek around $110,700 on Wednesday, after recovering slightly the previous day. Market participants digest the latest headlines surrounding the escalating feud between United States (US) President Donald Trump and the Federal Reserve (Fed). Meanwhile, mixed sentiment hovers over BTC as US-listed spot Bitcoin Exchange Traded Funds (ETFs) recorded $88 million in inflows on Tuesday, amid growing risks from high leverage.
Bitcoin stabilizes as Trump threatens Fed independence
Bitcoin correction paused after a sharp 12% pullback from its record high of $124,474 on August 14 to a low of $108,666 on Tuesday. At the time of writing on Wednesday, BTC stabilizes at around $110,700.
The largest cryptocurrency by market capitalization and the US Dollar (USD) remain broadly stable, following the announcement from Fed Governor Lisa Cook that she will file a lawsuit against her termination by President Donald Trump.
Meanwhile, speaking at a Cabinet meeting on Tuesday, Trump noted that he is prepared to abide by any court decision but indicated he was not concerned about Cook’s challenge. Trump further noted that he already has somebody in mind as Cook’s replacement, adding that there will soon be a majority of rate-cut voters within the Fed.
Apart from this ongoing action in financial markets, Venezuela responded to the US naval presence by deploying 15,000 additional troops to its border and stationing large warships at the Maracaibo Oil hub.
“This move heightens crude oil supply risks and inflation expectations, adding new uncertainty ahead of the September Fed meeting. While most analysts see the probability of outright conflict as low, oil market risk premiums could remain volatile,” said Bitunix Analyst.
Moderate institutional demand
Bitcoin’s institutional demand has also steadied so far this week. SoSoValue data show that Bitcoin Spot ETFs recorded a mild inflow of $88.20 million on Tuesday after breaking a six-day streak of outflows since August 15, the previous day.
Rising leverage concentration raises risks of squeezes on BTC
A K33 report on Tuesday highlighted that the leverage has expanded in perpatuals throughout the summer, currently trailing at 2-year highs. As shown in the graph below, the Open Interest (OI) spiked over the weekend, climbing by 13,472 BTC from the Friday close to the Monday close.
BTC Perps, Notional Open Interest chart. Source: K33 Research
Adding to this rise, the funding rates also moved higher toward neutral territory, indicating increased aggression from longs, which suggests that the growth in leverage over the past months has been driven by traders adding long exposure more aggressively. Leverage concentration heightens the risks of squeezes, and in such regimes, traders should aim to reduce risk and opt for conservative exposure.
“We perceive the risks of long squeezes in the near term as elevated, and, in extension, the risks of further downside in BTC as elevated,” said K33 analyst.
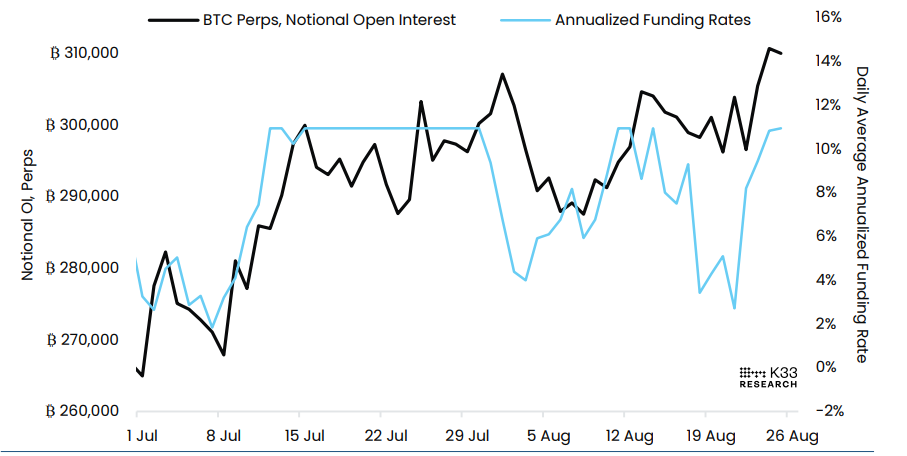
Notional open interest in perps vs. annualized funding rates chart. Source: K33 Research
Bitcoin Price Forecast: BTC hovers around 100-day EMA
Bitcoin price found rejection from a previously broken trendline on Saturday and declined by more than 5% until Monday, closing below its 100-day Exponential Moving Average (EMA) at $110,827. However, BTC recovered slightly the next day and closed above the 100-day EMA. At the time of writing on Wednesday, it hovers at around $110,700.
If the 100-day EMA at $110,827 continues to hold as support, BTC could extend the recovery toward its next daily resistance at $116,000.
The Relative Strength Index (RSI) on the daily chart reads 40, which is below its neutral level of 50, still indicating bearish momentum. For the recovery rally to be sustained, the RSI must move above its neutral level.
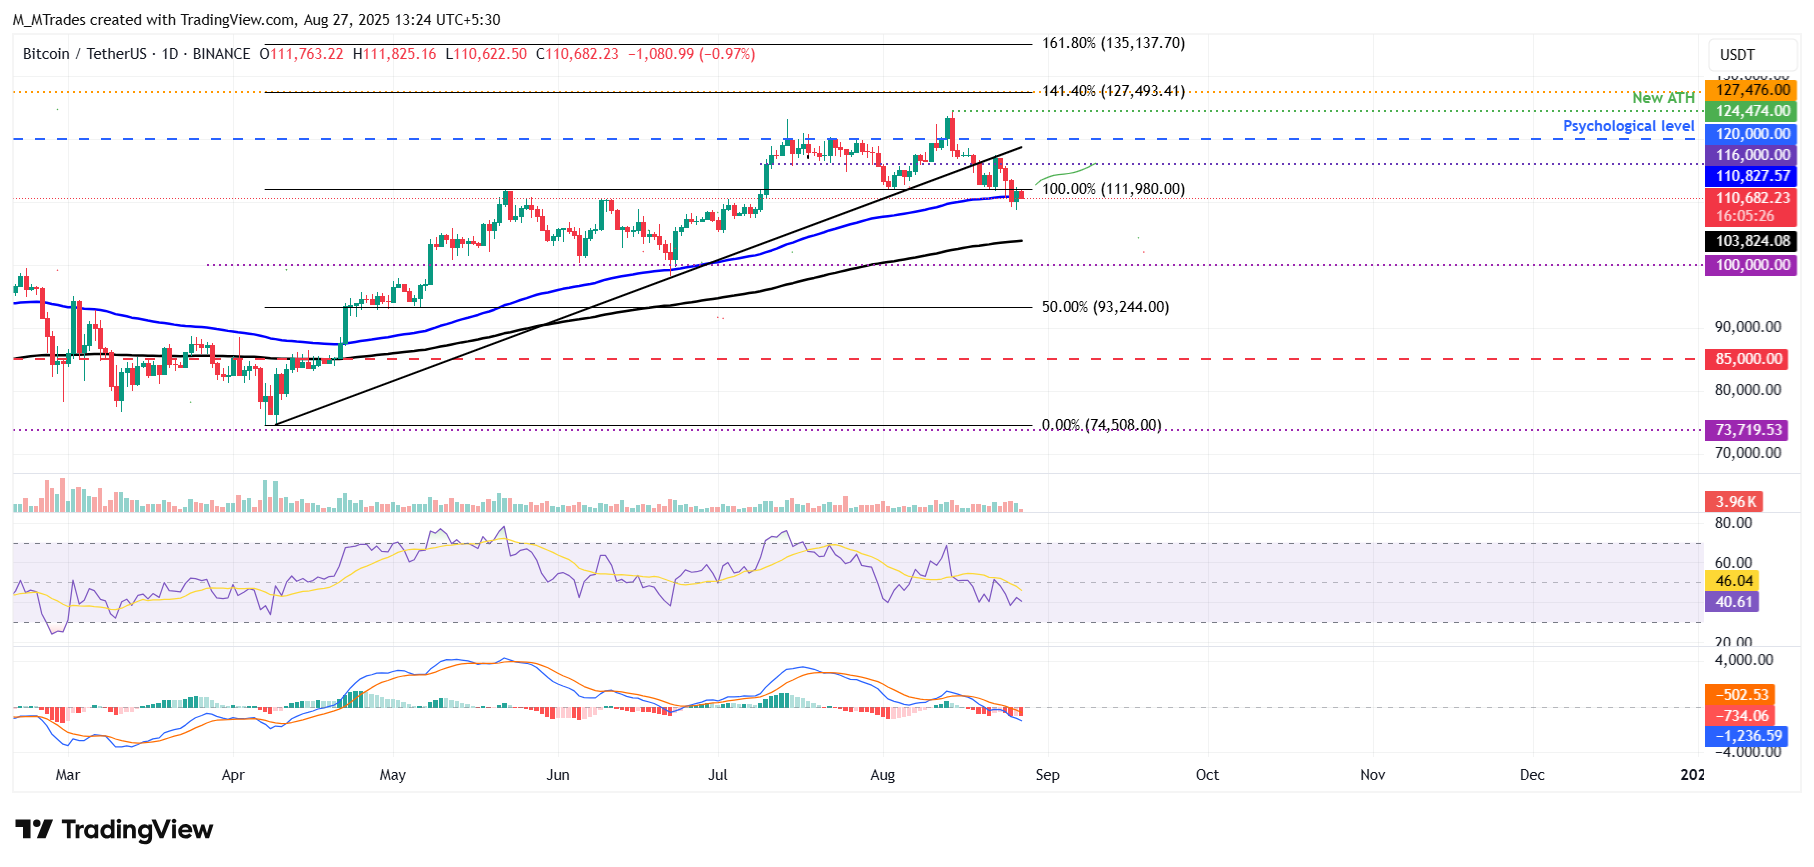
BTC/USDT daily chart
However, if BTC continues its correction, it could extend the decline toward its next key support at $103,824, the 200-day EMA.
Bitcoin, altcoins, stablecoins FAQs
Bitcoin is the largest cryptocurrency by market capitalization, a virtual currency designed to serve as money. This form of payment cannot be controlled by any one person, group, or entity, which eliminates the need for third-party participation during financial transactions.
Altcoins are any cryptocurrency apart from Bitcoin, but some also regard Ethereum as a non-altcoin because it is from these two cryptocurrencies that forking happens. If this is true, then Litecoin is the first altcoin, forked from the Bitcoin protocol and, therefore, an “improved” version of it.
Stablecoins are cryptocurrencies designed to have a stable price, with their value backed by a reserve of the asset it represents. To achieve this, the value of any one stablecoin is pegged to a commodity or financial instrument, such as the US Dollar (USD), with its supply regulated by an algorithm or demand. The main goal of stablecoins is to provide an on/off-ramp for investors willing to trade and invest in cryptocurrencies. Stablecoins also allow investors to store value since cryptocurrencies, in general, are subject to volatility.
Bitcoin dominance is the ratio of Bitcoin's market capitalization to the total market capitalization of all cryptocurrencies combined. It provides a clear picture of Bitcoin’s interest among investors. A high BTC dominance typically happens before and during a bull run, in which investors resort to investing in relatively stable and high market capitalization cryptocurrency like Bitcoin. A drop in BTC dominance usually means that investors are moving their capital and/or profits to altcoins in a quest for higher returns, which usually triggers an explosion of altcoin rallies.
บทความแนะนำ


