


Dogecoin Price Forecast: DOGE whales take profits as rally loses momentum
- Dogecoin nears the 10-day EMA at $0.081 on Monday after falling over 12% in the previous week.
- Santiment data shows that certain whales are offloading DOGE following its recent massive price surge.
- Derivatives metrics support mild strength while technical outlooks suggest upside momentum is waning after the recent spike.
Dogecoin (DOGE) trades near key support around $0.081 on Monday after declining more than 12% last week. On-chain data suggests some whale wallets are taking profits after DOGE’s recent surge. Meanwhile, derivatives data points to mild underlying strength, while technical indicators suggest bullish momentum is losing strength, leaving the meme coin’s near-term outlook mixed.
Whales are signaling potential profit-taking
Santiment’s Supply Distribution data supports a bearish outlook for Dogecoin, as large-wallet holders (whales) are reducing exposure after the meme coin’s recent price surge.
The metric indicates that whales holding between 1 million and 10 million (yellow line) and 10 million and 100 million tokens (blue line) have shed 260 million tokens since August 21.
In the same period, whales holding between 100,000 and 1 million (red line) have accumulated 10 million DOGE. This indicates a shift in positioning among large holders: top-tier whales and mid-sized whales are reducing exposure, signaling potential profit-booking activity, while small whales are absorbing some supply, often reflecting distribution and adding to near-term downside risks for the dog-themed meme coin.
 [09-1788154137679.42.55, 31 Aug, 2026].png)
Derivatives metrics show signs of strength
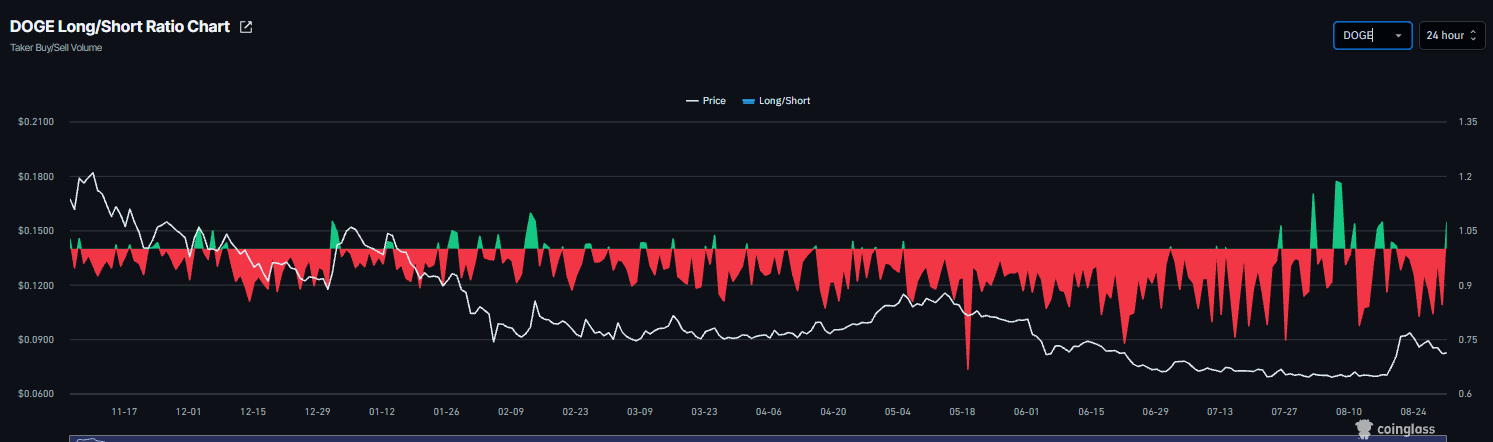
Dogecoin derivatives metrics show mild strength. CoinGlass’ long-to-short ratio for the dog-themed meme coin read 1.07 on Monday. The ratio being above one, indicates bullish sentiment, as traders are betting the asset’s price will rise.
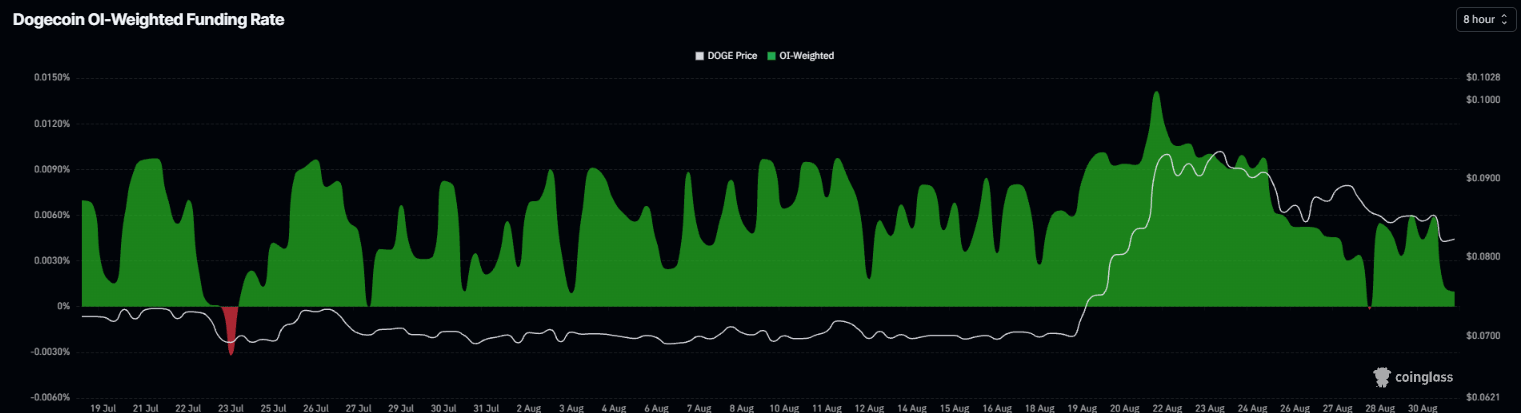
In addition, DOGE funding rates flipped positive on Friday, reading 0.0010% on Monday, indicating longs are paying shorts and signaling bullish sentiment.
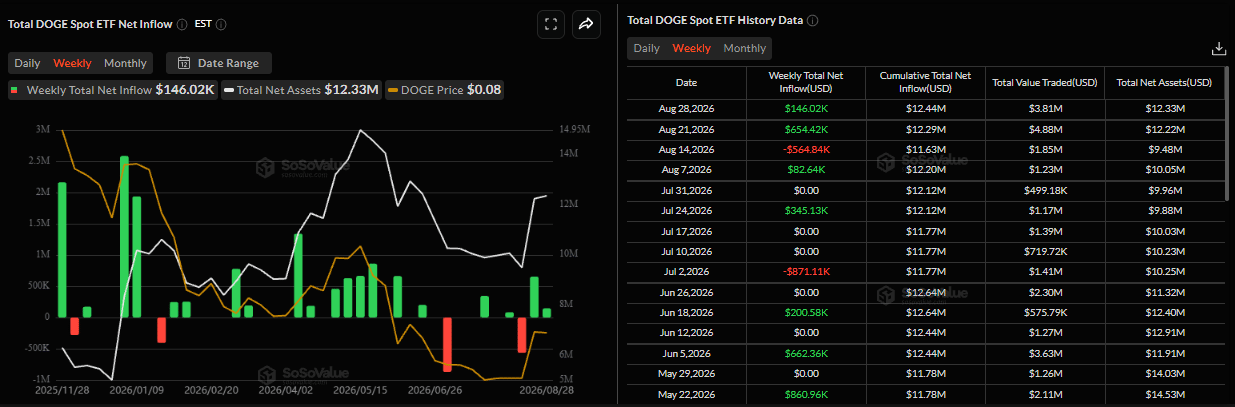
Institutional demand for Dogecoin also shows signs of improvement. SoSoValue data showed that DOGE Exchange Traded Funds (ETFs) recorded an inflow of $146,020 last week, marking the second consecutive week of positive flow. If these inflows continue and intensify, DOGE could support gains ahead.
Some signs of concern
Despite mild strength from derivatives and institutional demand, traders should be cautious, as the latest developments in the Middle East crisis are capping risk sentiment among investors.
On Sunday, US forces struck two Iranian launchers on Larak Island in Iran. Iran retaliated by launching ballistic missiles from Tehran, Lorestan, Karaj, Khorramabad and Shiraz, and anti-ship cruise missiles from southern Iran toward the Strait of Hormuz.
These developments have dampened the risk appetite and have prompted traders to price in the geopolitical risk premium again, favoring the US Dollar (USD) and weighing on risky assets such as Dogecoin.
Dogecoin technical outlook: Upside momentum is waning
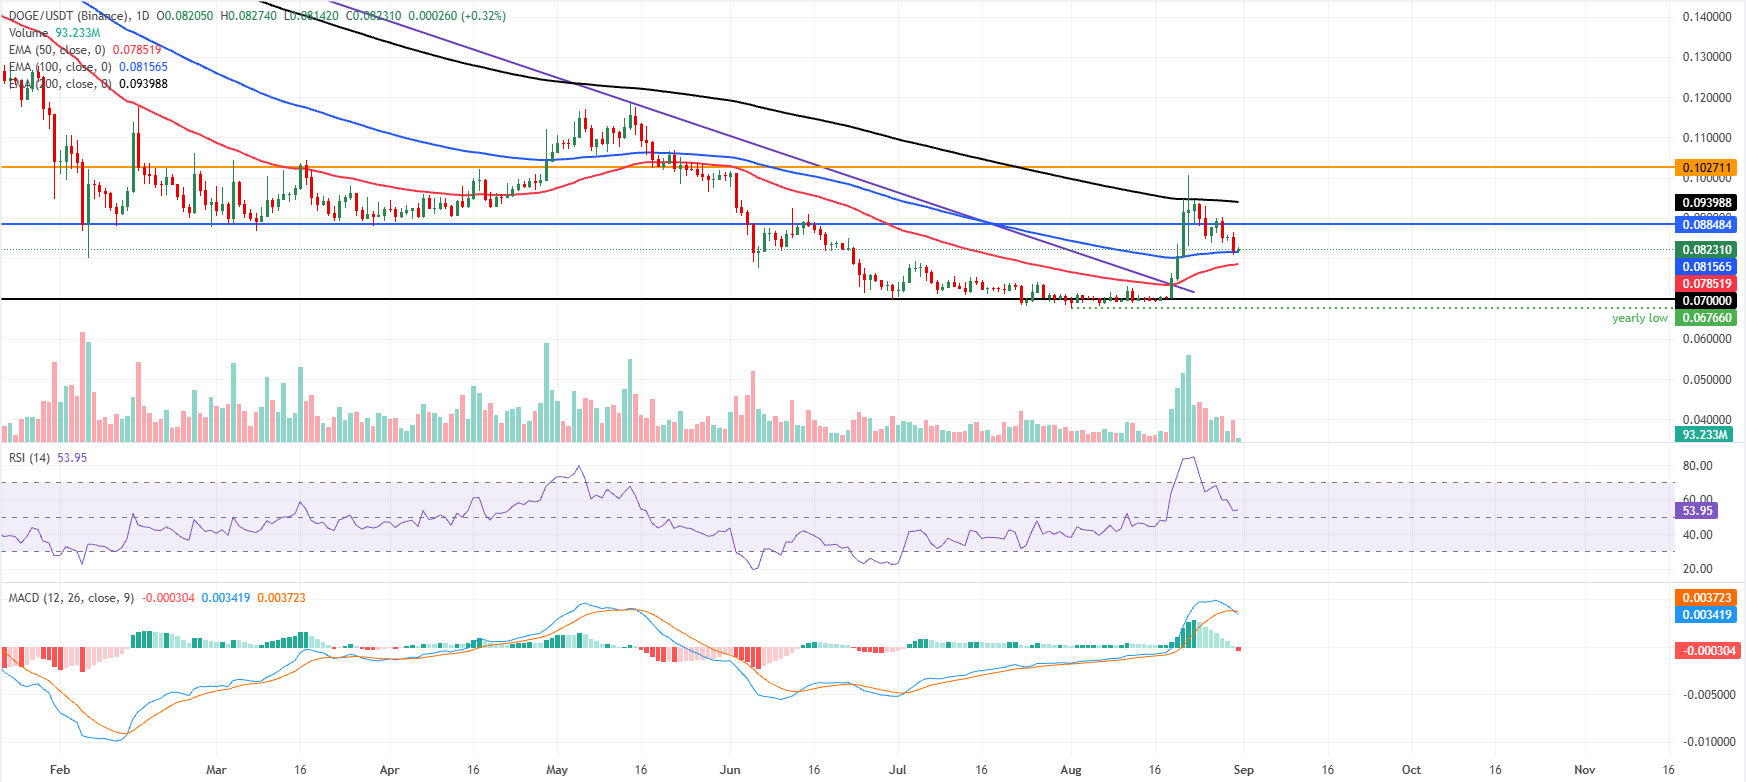
Dogecoin price trades at $0.082 on Monday after falling more than 12% last week. DOGE is holding above the 100-day Exponential Moving Average (EMA) at $0.081 and the 50-day EMA at $0.078 but remains capped beneath the 200-day EMA at $0.093, keeping the broader tone neutral-to-bearish.
The Relative Strength Index (RSI) around 53 suggests momentum has cooled from prior overbought extremes. At the same time, the latest Moving Average Convergence Divergence (MACD) reading has slipped marginally negative, hinting at waning upside pressure after the recent spike.
On the topside, initial resistance sits at $0.088, with stronger supply expected at the 200-day EMA near $0.093 and then the structural barrier at $0.102.
On the downside, immediate support is anchored around the current area and the 100-day EMA at $0.081, followed by the 50-day EMA at $0.078; a deeper pullback would expose the horizontal floor at $0.070 and the prior trendline break region near $0.067 as the next key demand zones.
(The technical analysis of this story was written with the help of an AI tool. Know more.)
Artigos Recomendados


