
US Dollar pauses after falling to two-week low amid trade optimism
- The US Dollar steadies after a sharp midweek drop, with DXY holding above the key 97.00 support.
- Trade optimism lifts risk appetite following bilateral tariff deals with Japan, Indonesia and the Philippines.
- US President Donald Trump to visit the Federal Reserve at 20:00 GMT, intensifying political pressure on Fed Chair Jerome Powell.
The US Dollar (USD) takes a breather on Thursday after sliding to a two-week low on Wednesday as renewed optimism around global trade deals boosted market sentiment. A breakthrough agreement between the US and Japan, along with hopes of a similar deal between Washington and Brussels, increased risk appetite and reduced safe-haven demand. Concerns over the Federal Reserve’s (Fed) independence also weighed on sentiment. However, a mild technical correction following the recent sell-off is helping the Greenback stabilize.
The US Dollar Index (DXY), which measures the Greenback’s value against a basket of six major currencies, is recovering modestly. At the time of writing, the index is trading around the 97.40 mark during Thursday's European trading hours, attempting to claw back some ground after a sharp midweek decline.
On Wednesday, reports indicated that the United States (US) and the European Union (EU) were making progress toward a trade agreement that could mirror the recently announced US-Japan deal. Diplomats said the agreement would set a 15% baseline tariff on most EU exports to the US, with exemptions for key sectors such as aircraft and medical devices. This marks a significant shift from earlier tensions, when the US threatened to impose tariffs as high as 30% on certain European exports. Still, strategic safeguards remain in place as Brussels prepares a €90-100 billion retaliatory tariff package targeting US goods if talks fail to succeed. With the August 1 deadline approaching and negotiations still underway, the market views this progress as a potential de-escalation in ongoing trade tensions.
The US economic docket this Thursday will feature preliminary Purchasing Managers Index (PMI) and Initial Jobless Claims data, as S&P Global Manufacturing and Services PMIs are set for release at 13:45 GMT, followed by Initial Jobless Claims at 12:30 GMT. The market forecasts a stable manufacturing PMI of around 52.5 and a modest uptick in services to approximately 53. Analysts say strong PMI readings could reinforce expectations that the Fed will pause interest rate cuts, offering support to the US Dollar, while softer results might increase speculation of a more dovish Fed stance.
Market movers: Global markets climb as tariff talks advance and Trump eyes the Fed
- On Wednesday, US President Donald Trump doubled down on his hardline trade stance, stating that future tariffs on US trading partners would range between 15% and 50%, depending on whether countries grant reciprocal market access. He made it clear that tariff cuts would only be offered to those who open up their markets to American goods and services. The comments followed a string of recently announced bilateral deals, including new 19% tariff agreements with Indonesia and the Philippines. The US president described both deals as “fair and historic,” signaling that more agreements could follow, potentially with the EU and India, ahead of the August 1 deadline.
- The yield on the benchmark 10-year US Treasury held steady near 4.39% on Thursday, after rising in the previous session. This stability comes amid strong foreign investor demand, particularly from private overseas holders who collectively hold over $5 trillion in US debt, helping to anchor yields despite rising US fiscal deficits, inflation uncertainty and growing concerns about the Federal Reserve’s independence.
- Global stock markets moved higher across the board. The Nikkei 225 Index rallied 1.59% to close at 41,826 while the broader Topix Index jumped 1.75% to 2,978 on Thursday, while European indices also rallied, with the STOXX 50 climbing nearly 1% and the broader STOXX 600 advancing 0.6%. US stock futures turned positive, supported by upbeat trade headlines and anticipation ahead of major tech earnings releases.
- US President Donald Trump is scheduled to visit the Federal Reserve’s Washington headquarters at 20:00 GMT on Thursday, intensifying political pressure on Chair Jerome Powell. The visit comes amid Trump’s continued criticism of high interest rates and scrutiny over the Fed’s $2.5 billion renovation project. Markets are watching closely, as the rare presidential appearance at the central bank raises fresh concerns about Fed independence and could stir volatility in the US Dollar and Bond markets.
- The European Central Bank left its Deposit Rate Facility unchanged at 2.00% on Thursday, in line with expectations, following seven straight cuts. According to the Monetary Policy Statement, the central bank will "follow a data-dependent and meeting-by-meeting approach to determining appropriate monetary policy stance," adding that the environment "remains exceptionally uncertain, especially because of trade disputes". Despite headline inflation stabilizing around the ECB’s 2% target, policymakers left the door open for a potential rate cut in September, contingent on evolving trade developments and economic data.
- Flash Purchasing Managers Index (PMI) readings released Thursday highlighted diverging global trends. The Eurozone's composite PMI rose to 51.0, an 11-month high, while the UK’s slipped to 51.0, signaling a slowdown. In Asia, Australia posted a strong composite reading of 53.6, its best in over a year, driven by resilient service sector performance. Japan’s manufacturing fell into contraction at 48.8, offset by a stable services sector.
Technical analysis: US Dollar Index retests falling wedge pattern, eyes on 97.00 support
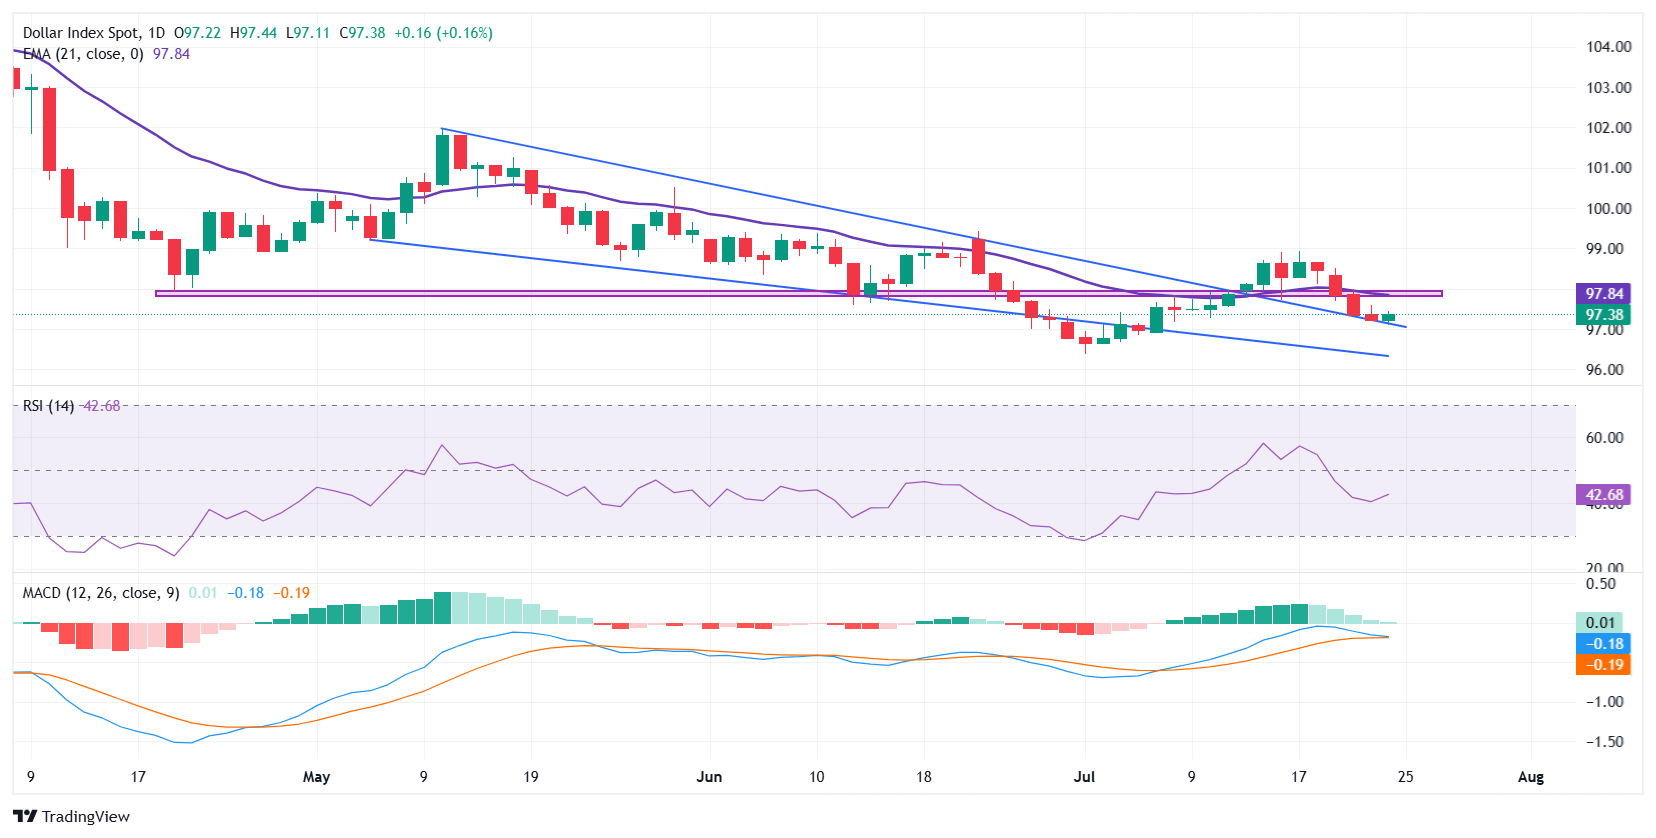
The US Dollar Index (DXY) is showing signs of stabilization on Thursday after extending its recent slide from near four-week highs, with the index hovering around the 97.38 mark. Price action has slowed after breaking below a key support, now turned resistance, near 97.80-98.00, which closely aligns with the 21-day Exponential Moving Average (EMA). The pullback remains contained above the psychological 97.00 handle, where the index has found some intraday support. The level also coincides with the upper boundary of a falling wedge pattern that was decisively broken to the upside last week. This area is now serving as a retest zone and could offer short-term footing as traders reassess the broader trend.
The Relative Strength Index (RSI) is currently holding around 42.68, indicating a bearish bias but not yet oversold. This suggests there’s still room for further downside, though the pace of the decline appears to be slowing. The RSI has been trending lower since the rejection from the 99.00 psychological zone and now is attempting to flatten, hinting at possible consolidation or even a corrective bounce if support at 97.00 holds.
On the upside, immediate resistance is seen near the 97.80-98.00 zone, which previously served as a key support level. A sustained move above this zone is needed to ease downside pressure and shift short-term momentum in favor of buyers. On the downside, if the 97.00 handle fails to hold, it would confirm a break below the wedge retest zone and expose the index to a deeper pullback toward 96.50, followed by the over three-year low near 96.30 marked on July 1.
US Dollar PRICE Today
The table below shows the percentage change of US Dollar (USD) against listed major currencies today. US Dollar was the strongest against the Swiss Franc.
| USD | EUR | GBP | JPY | CAD | AUD | NZD | CHF | |
|---|---|---|---|---|---|---|---|---|
| USD | 0.27% | 0.32% | 0.15% | 0.14% | -0.16% | 0.00% | 0.36% | |
| EUR | -0.27% | 0.07% | -0.12% | -0.11% | -0.42% | -0.26% | 0.09% | |
| GBP | -0.32% | -0.07% | -0.16% | -0.18% | -0.49% | -0.33% | 0.03% | |
| JPY | -0.15% | 0.12% | 0.16% | -0.02% | -0.32% | -0.21% | 0.07% | |
| CAD | -0.14% | 0.11% | 0.18% | 0.02% | -0.27% | -0.15% | 0.21% | |
| AUD | 0.16% | 0.42% | 0.49% | 0.32% | 0.27% | 0.15% | 0.52% | |
| NZD | -0.00% | 0.26% | 0.33% | 0.21% | 0.15% | -0.15% | 0.36% | |
| CHF | -0.36% | -0.09% | -0.03% | -0.07% | -0.21% | -0.52% | -0.36% |
The heat map shows percentage changes of major currencies against each other. The base currency is picked from the left column, while the quote currency is picked from the top row. For example, if you pick the US Dollar from the left column and move along the horizontal line to the Japanese Yen, the percentage change displayed in the box will represent USD (base)/JPY (quote).
Artigos Recomendados


