

Dow Jones Industrial Average sparks rally on chilling CPI, but Fed still looms large
- Dow Jones jumped a full percent after CPI inflation cooled before receding to flat.
- Fed watchers on high alert as “Dot plot” update looms ahead.
- Fed rate call broadly expected to hold as investors wrestle with September cut odds.
The Dow Jones soared over 350 points in early Wednesday trading after US Consumer Price Index (CPI) inflation receded faster than expected, but investors are pulling back ahead of the Federal Reserve’s (Fed) latest rate call that will bring a hotly-anticipated update to the Fed’s “dot plot” of Interest Rate Expectations. With the Fed still due on Wednesday, the Dow Jones has pulled back to the day’s opening bids near 38,780.00.
US CPI inflation cooled to 0.0% MoM in May, below the forecast 0.1% and receding even faster from the previous month’s 0.3%. Core CPI ticked down to 3.4% YoY, below the forecast 3.5% and dropping away from the previous period’s 3.6%. With CPI inflation figures easing further, investor sentiment is leaning further into hopes of a September rate cut.
According to the CME’s FedWatch Tool, rate markets are now pricing in 70% odds of the Fed trimming rates at least 25 basis points on September 18, but Wednesday’s Fed outing is reigniting some caution.
Dow Jones news
The Dow Jones is roughly on-balance on Wednesday but tilted towards the lower side. 20 of the index’s 30 securities are leaning into the red ahead of the Fed, with Nike Inc. (NKE) leading the crowd lower, falling -1.8% to $94.14 per share. Apple Inc. (AAPL) is extending a broad climb as investors pin their hopes on Apple’s announced integration of ChatGPT into their operating software. AAPL is up 4.11% on Wednesday, climbing to $215.83 per share.
Dow Jones technical outlook
Wednesday’s CPI-fueled rally briefly peaked above 39,120.00 before risk appetite chilled and sent the Dow Jones back into the day’s opening range near 38,790.00. The major equity index remains mired in near-term congestion at the 200-hour Exponential Moving Average (EMA) at 38,866.60. Bidders have manage to price in a technical rebound from the week’s low bids near 38,400.00, but technical resistance is building from multiple rejections from chart regions north of the 39,000.00 handle.
Dow Jones hourly chart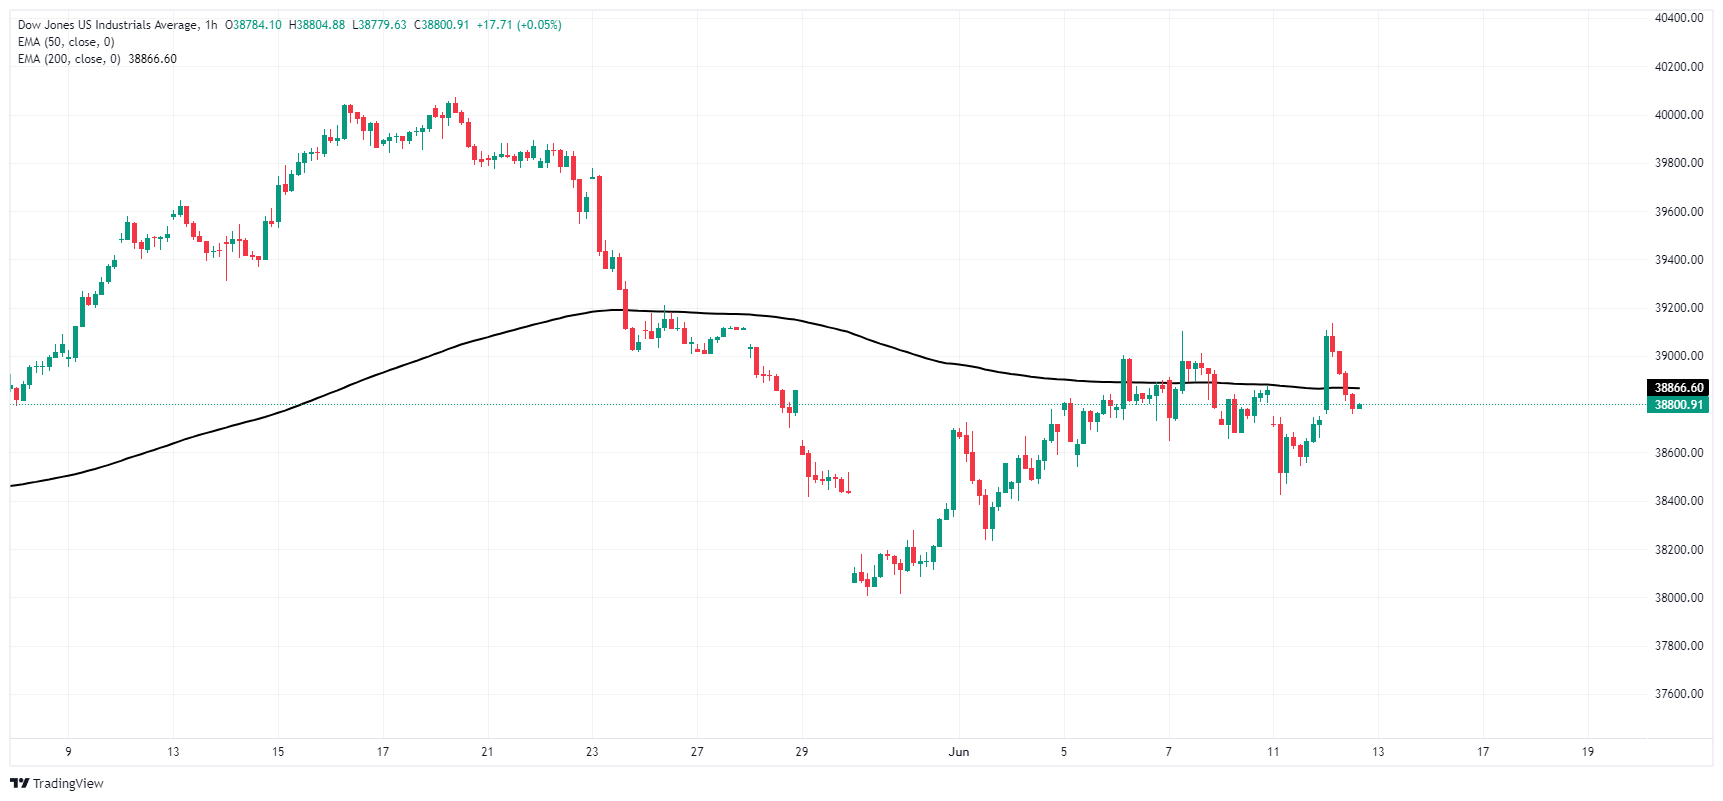
Dow Jones daily chart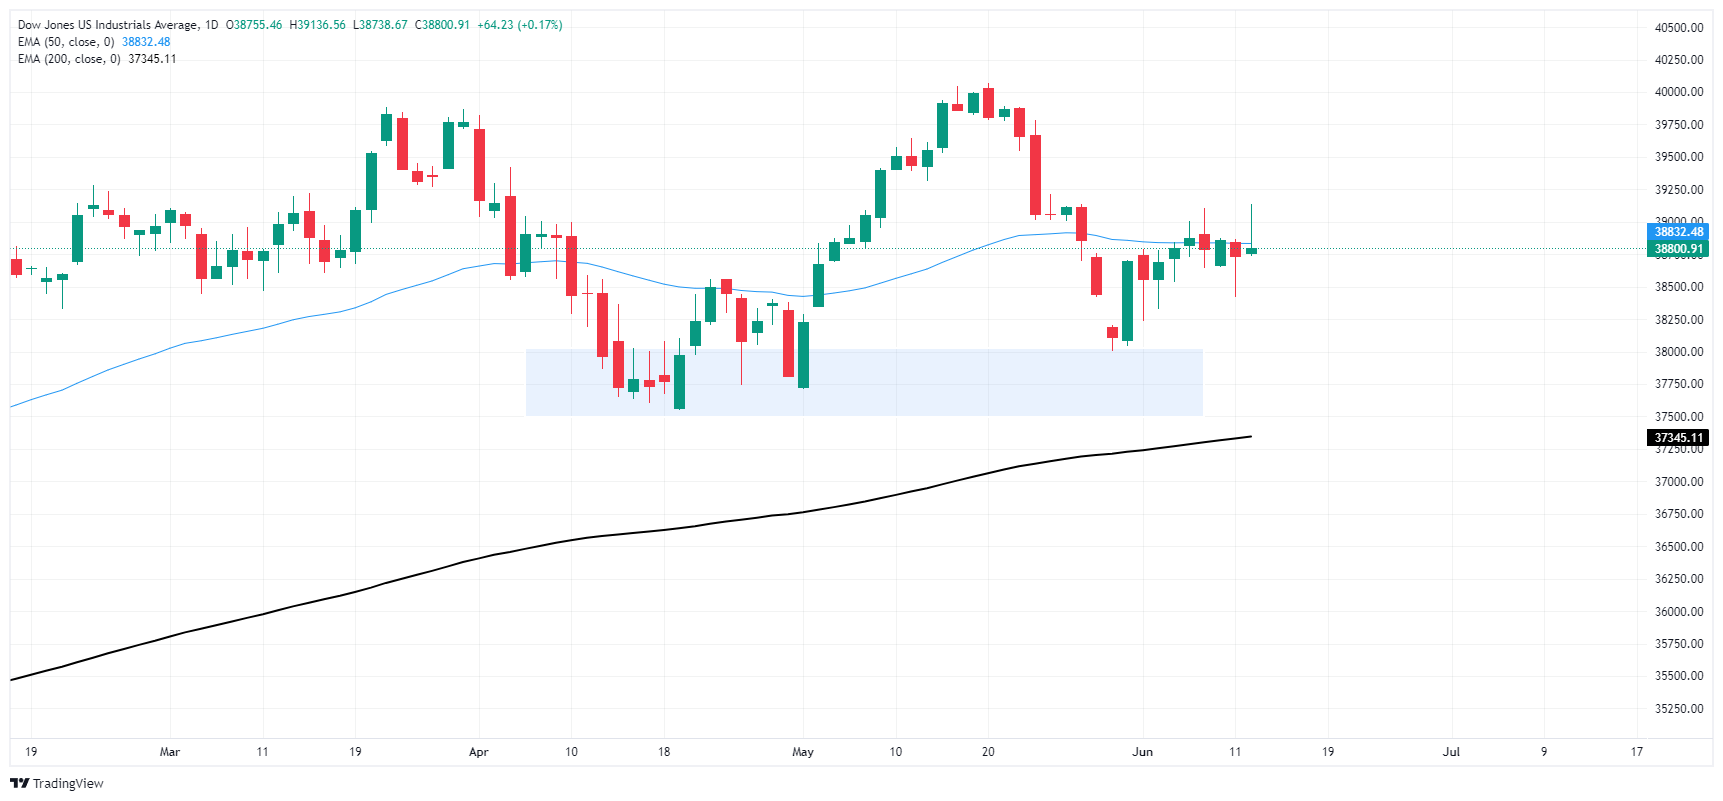
Dow Jones FAQs
The Dow Jones Industrial Average, one of the oldest stock market indices in the world, is compiled of the 30 most traded stocks in the US. The index is price-weighted rather than weighted by capitalization. It is calculated by summing the prices of the constituent stocks and dividing them by a factor, currently 0.152. The index was founded by Charles Dow, who also founded the Wall Street Journal. In later years it has been criticized for not being broadly representative enough because it only tracks 30 conglomerates, unlike broader indices such as the S&P 500.
Many different factors drive the Dow Jones Industrial Average (DJIA). The aggregate performance of the component companies revealed in quarterly company earnings reports is the main one. US and global macroeconomic data also contributes as it impacts on investor sentiment. The level of interest rates, set by the Federal Reserve (Fed), also influences the DJIA as it affects the cost of credit, on which many corporations are heavily reliant. Therefore, inflation can be a major driver as well as other metrics which impact the Fed decisions.
Dow Theory is a method for identifying the primary trend of the stock market developed by Charles Dow. A key step is to compare the direction of the Dow Jones Industrial Average (DJIA) and the Dow Jones Transportation Average (DJTA) and only follow trends where both are moving in the same direction. Volume is a confirmatory criteria. The theory uses elements of peak and trough analysis. Dow’s theory posits three trend phases: accumulation, when smart money starts buying or selling; public participation, when the wider public joins in; and distribution, when the smart money exits.
There are a number of ways to trade the DJIA. One is to use ETFs which allow investors to trade the DJIA as a single security, rather than having to buy shares in all 30 constituent companies. A leading example is the SPDR Dow Jones Industrial Average ETF (DIA). DJIA futures contracts enable traders to speculate on the future value of the index and Options provide the right, but not the obligation, to buy or sell the index at a predetermined price in the future. Mutual funds enable investors to buy a share of a diversified portfolio of DJIA stocks thus providing exposure to the overall index.
Artigos Recomendados


