
Bonk Price Forecast: BONK pullback may continue as funding rates, open interest dip
- Bonk declines 30% from its July peak as investors step back ahead of the Fed interest rate decision.
- The derivatives market faces a significant slump in funding rates and futures Open Interest following peak levels earlier in July.
- BONK’s technical indicators lean bearish, with the MACD sell signal upholding, a declining RSI and low volumes.
Bonk (BONK) price is edging lower for a fifth consecutive day, trading at around $0.00002741 on Wednesday, as investors shift focus to the Federal Reserve (Fed) interest rate decision. If risk-off sentiment continues after the Federal Reserve Open Market Committee (FOMC) meeting, the meme coin’s bearish scope may extend to lower support levels at $0.00002530 and $0.00002104, respectively.
Bonk’s derivative market offers bearish signals
The decline in Bonk can be attributed to, among other factors, profit-taking following the remarkable 203% rally in July, which peaked at $0.00004075. More broadly, the change in market dynamics due to macroeconomic concerns on the perceived impact of the reciprocal tariffs coming into effect in the US on Friday and Wednesday's interest rate decision could also be playing a role.
The derivatives market reflects investor reaction to some of the above factors, particularly with the futures Open Interest (OI) and funding rates falling sharply. CoinGlass data highlights a 35% decline in OI, averaging at $48 million from the $73.4 million recorded on July 17.
If this indicator continues to decline, it would indicate a lack of conviction in the uptrend. In such a scenario, Bonk could continue trimming the gains accrued this month as bulls search for a robust support level before the next recovery attempt.
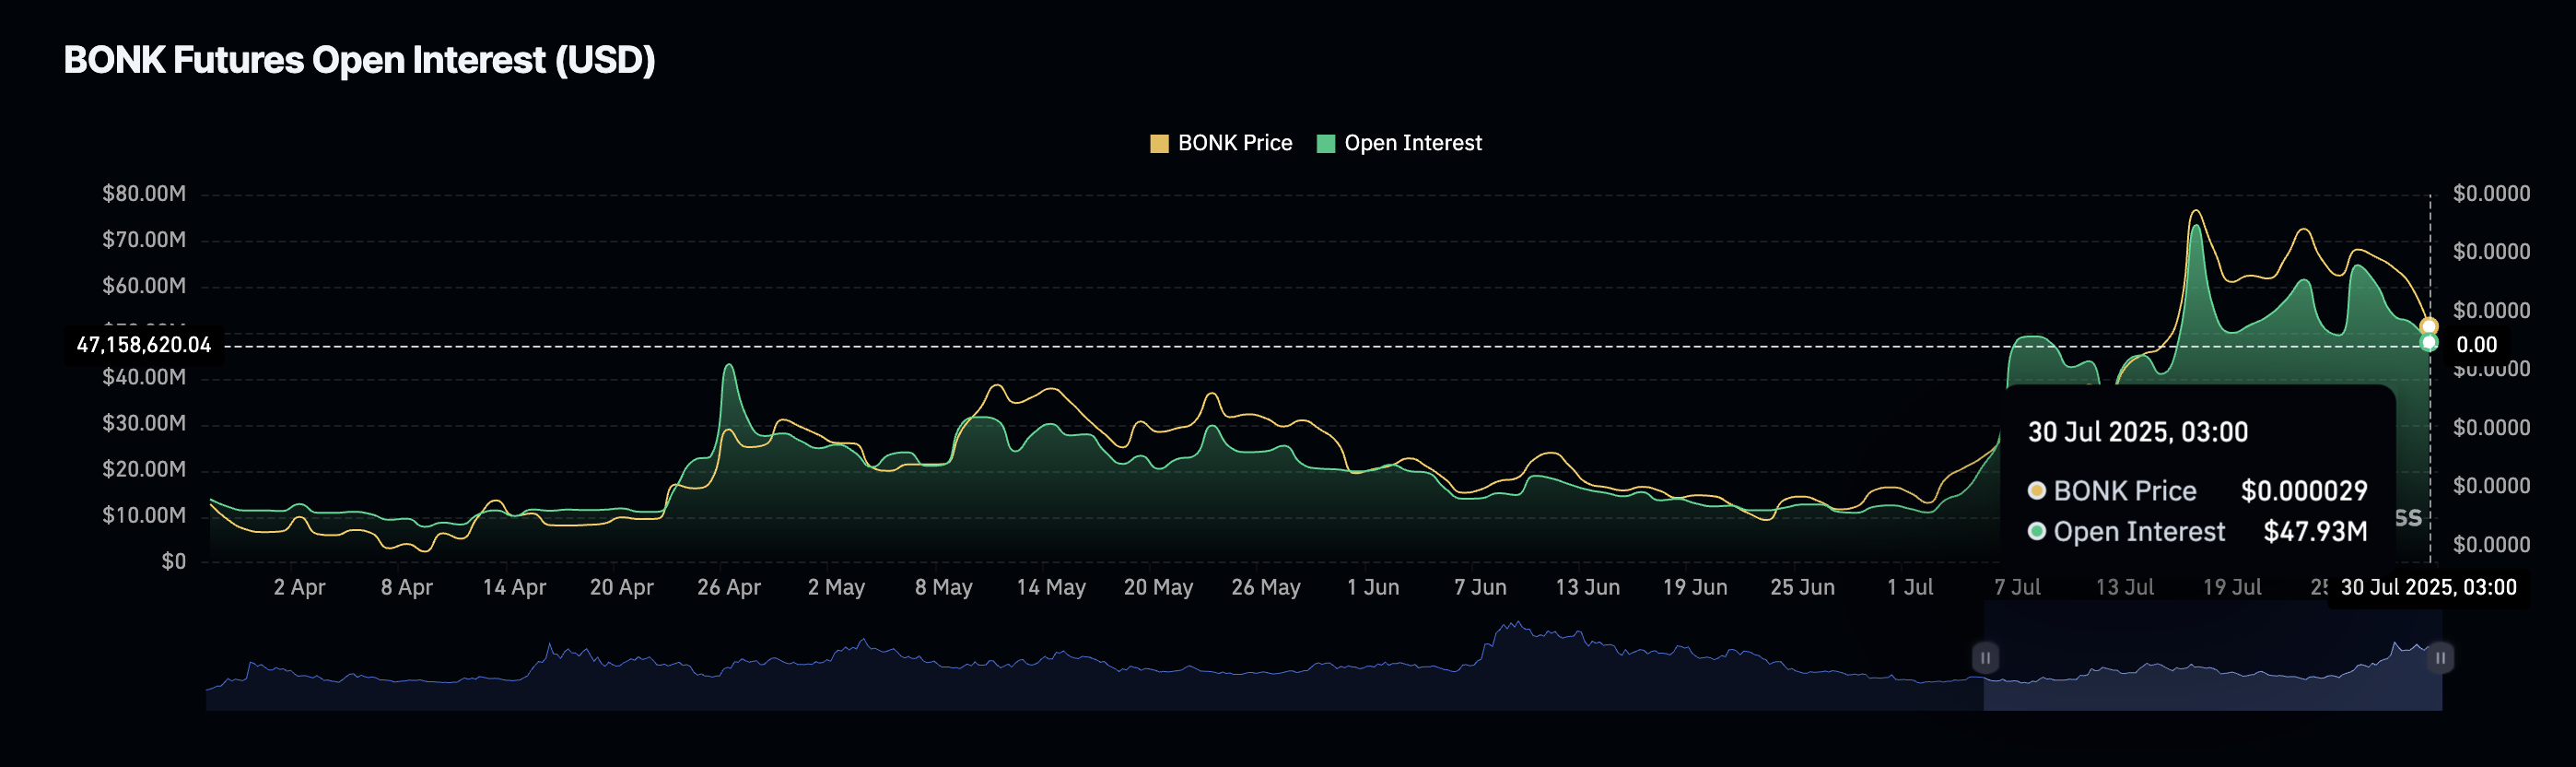
Bonk Futures Open Interest | Source: CoinGlass
The futures weighted funding rate has also been on a steady decline to -0.0066% after peaking at 0.0256% on July 23. Low or negative funding rates indicate weak bullish sentiment, as few traders bet on the Bonk price increasing. At the same time, the decline suggests a lack of confidence in the ecosystem, or cooling speculative activity, potentially leaving Bonk susceptible to downward pressure.
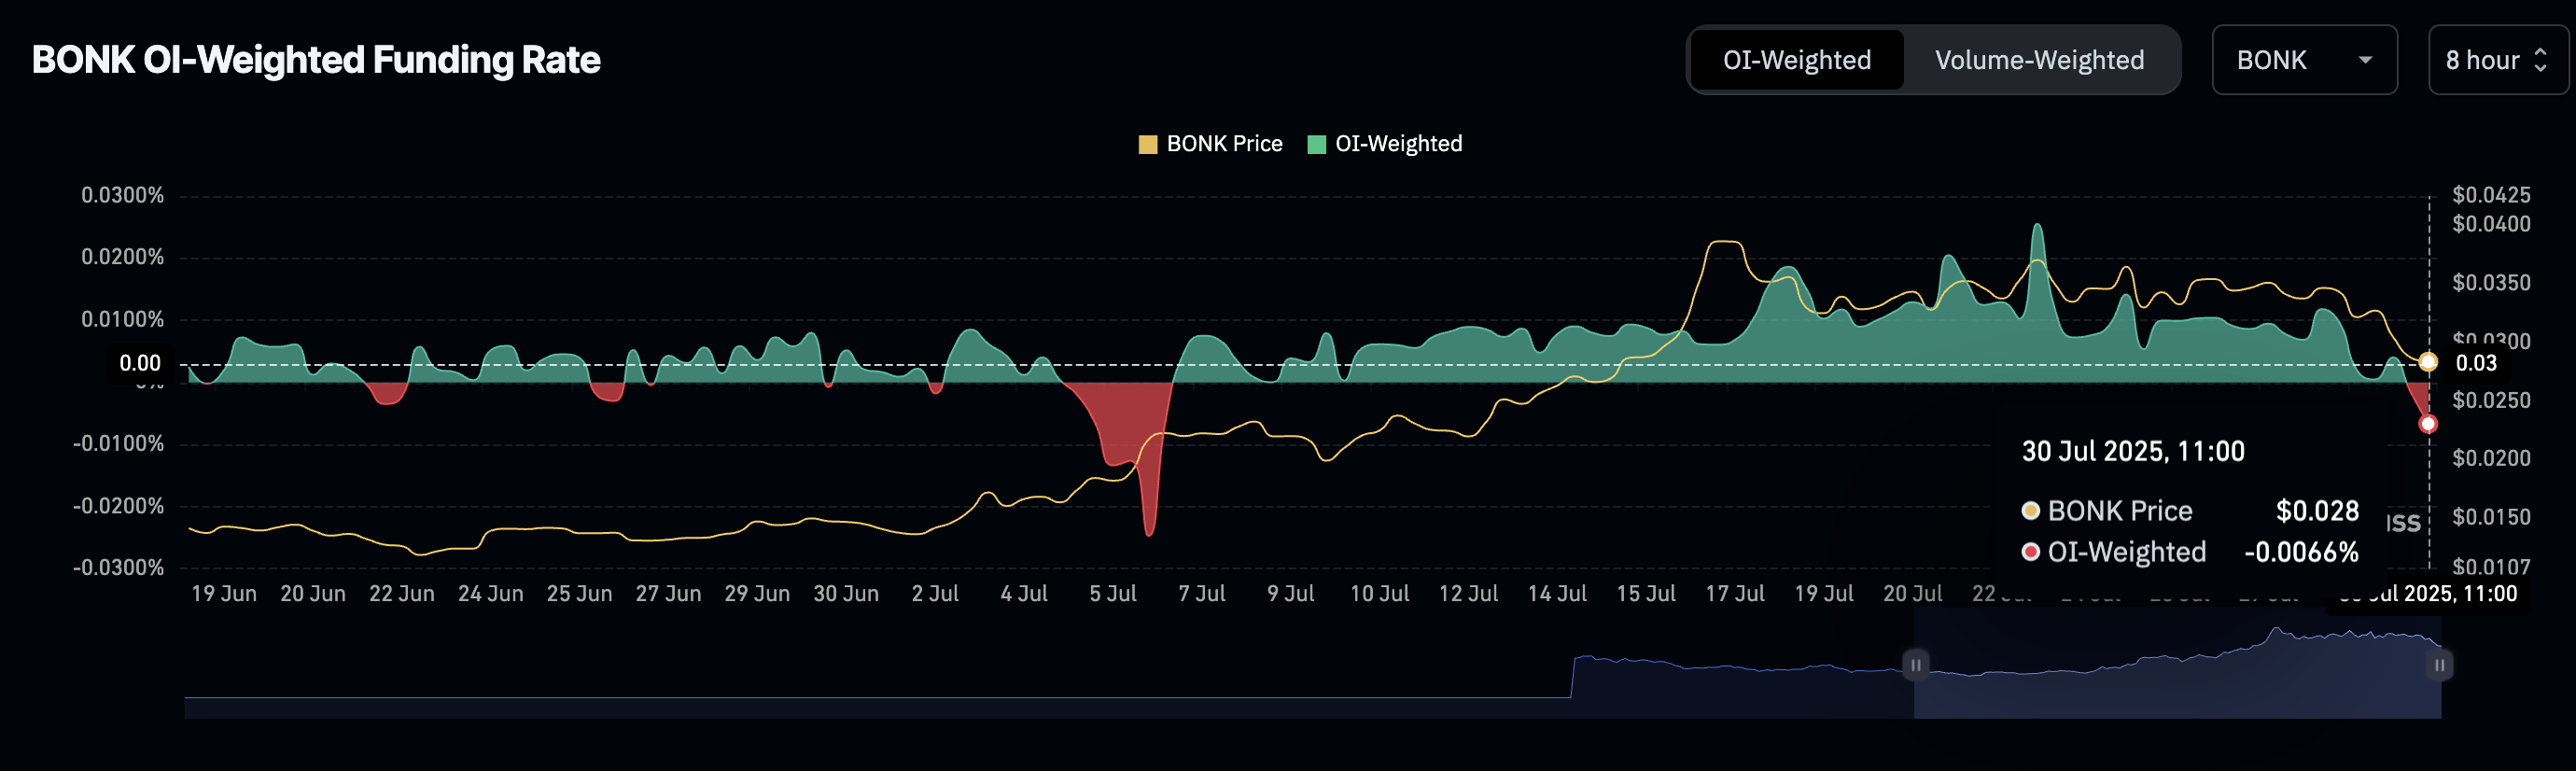
Bonk futures weighted funding rate | Source: CoinGlass
The next few trading sessions will be crucial in determining the next direction the Bonk price could take amid the prevailing macroeconomic risks.
Technical outlook: Bonk approaches key support
Bonk price has maintained a bearish bias since its uptrend faltered at $0.00004075. With its technical picture on the daily chart showing signs of extending the decline, near-term support levels such as the 50-day Exponential Moving Average (EMA) at $0.00002530 are apparent.
Traders may consider a sell signal from the Moving Average Convergence Divergence (MACD) indicator to reduce exposure in the short term. This signal manifested when the blue MACD line crossed below the red signal line on Sunday.
The sharp decline of the Relative Strength Index (RSI) to 46 from its recent peak level of 85 underscores the reduction in buying pressure. Should the RSI decline persist, supply could overwhelm demand and accelerate the bearish leg below support at $0.00002530.
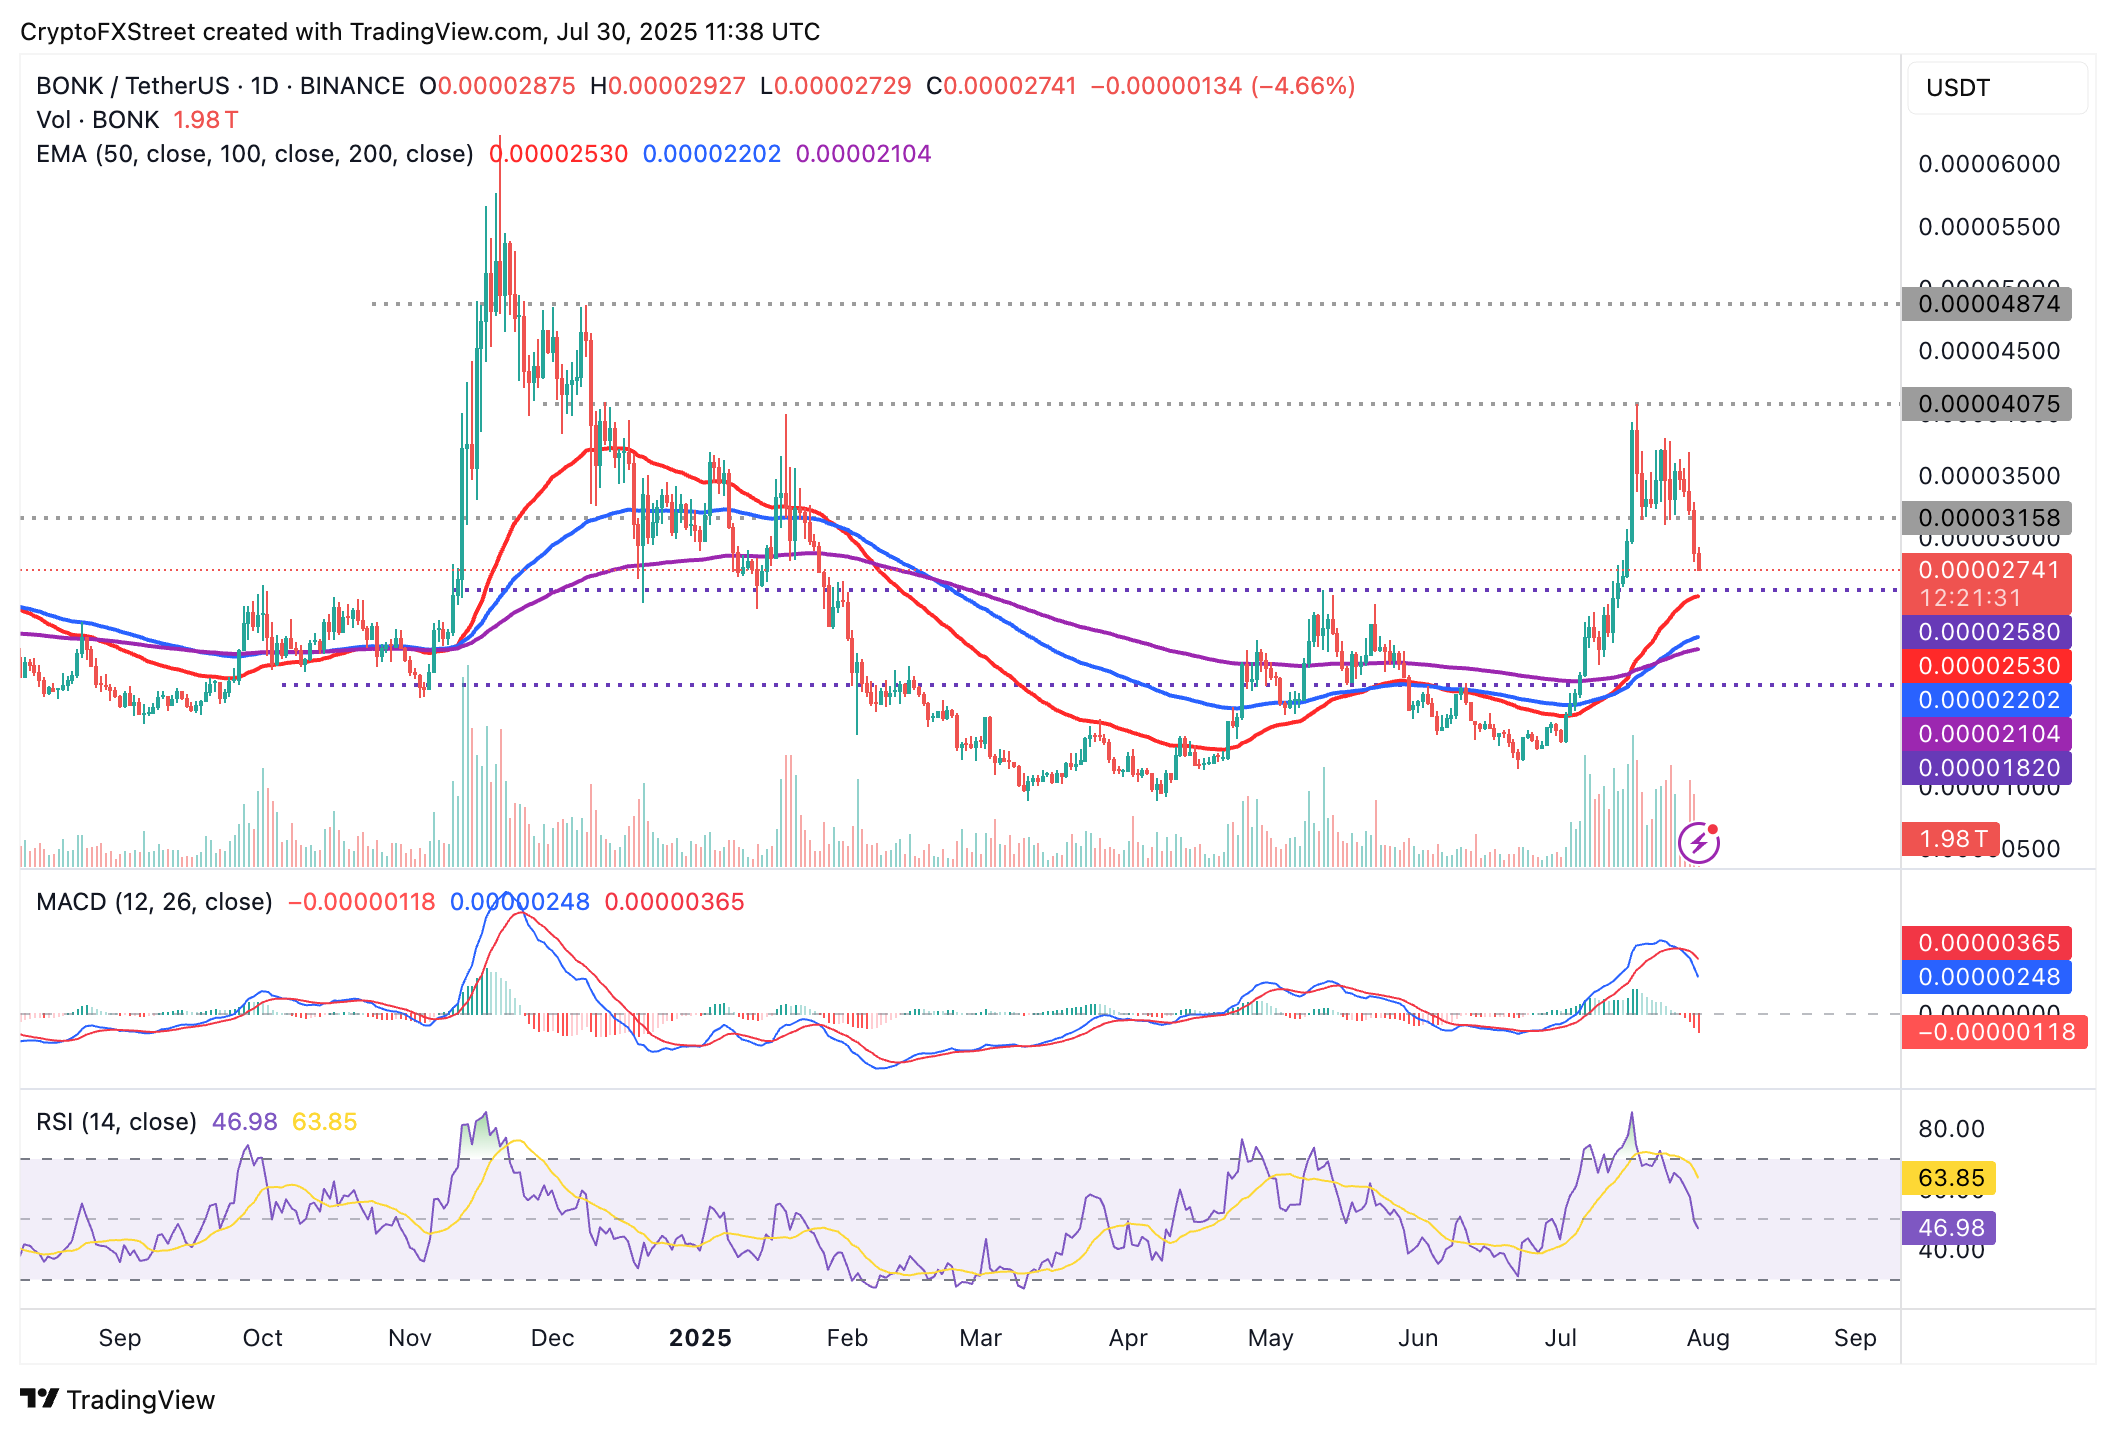
BONK/USDT daily chart
Still, bulls could regain control of the trend, with Bonk currently holding above the moving averages, including the 50-day EMA at $0.00002530, the 100-day EMA at $0.00002202 and the 200-day EMA at $0.00002104. These levels are likely to absorb the selling pressure, paving the way for a potential rebound toward Bonk’s recent high at $0.00004075.
Open Interest, funding rate FAQs
Higher Open Interest is associated with higher liquidity and new capital inflow to the market. This is considered the equivalent of increase in efficiency and the ongoing trend continues. When Open Interest decreases, it is considered a sign of liquidation in the market, investors are leaving and the overall demand for an asset is on a decline, fueling a bearish sentiment among investors.
Funding fees bridge the difference between spot prices and prices of futures contracts of an asset by increasing liquidation risks faced by traders. A consistently high and positive funding rate implies there is a bullish sentiment among market participants and there is an expectation of a price hike. A consistently negative funding rate for an asset implies a bearish sentiment, indicating that traders expect the cryptocurrency’s price to fall and a bearish trend reversal is likely to occur.
Artigos Recomendados


