Sui’s $120 million linear token unlock risks 15% decline as market sentiment slows
- Sui edges lower on Tuesday, with 30-day losses totaling 15.5%.
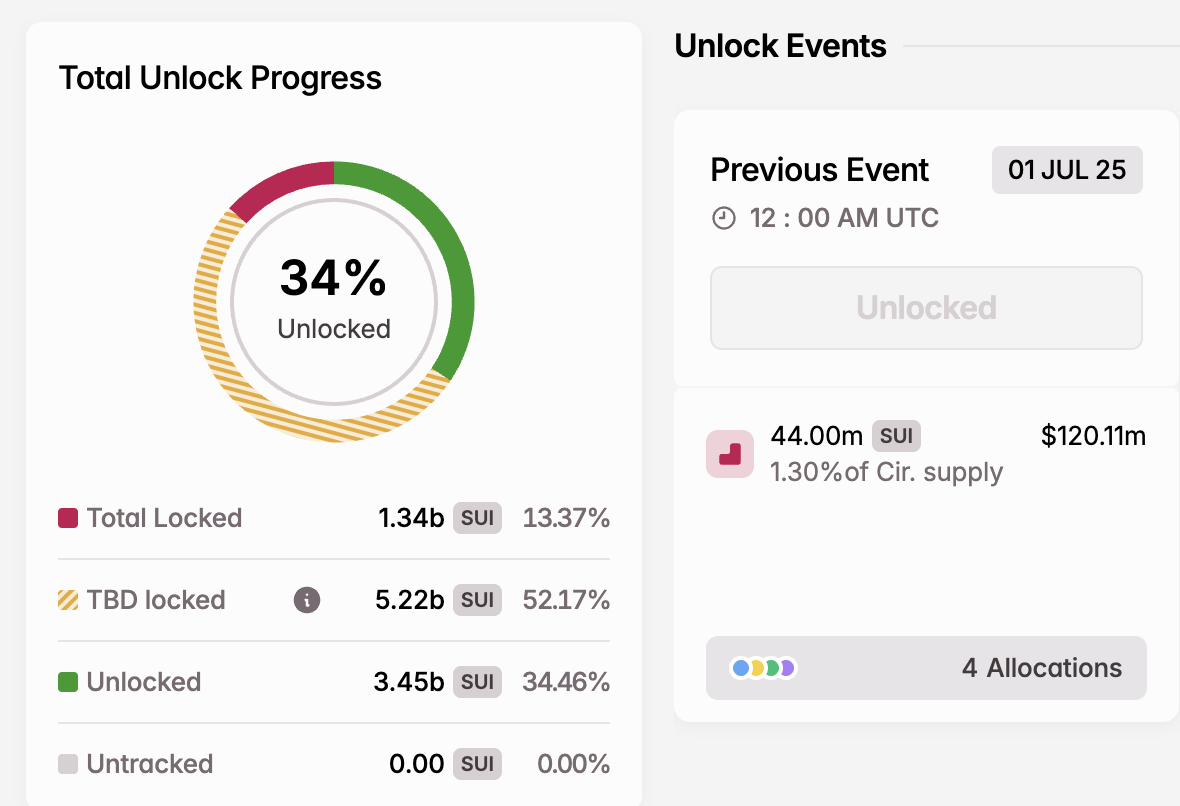
- Sui Network unlocks 44 million coins worth approximately $120 million.
- The massive token unlock event could trigger a surge in selling pressure, underpinned by declining derivatives market Open Interest.
Sui (SUI) continues to extend its losses from June, trading at around $2.71 on Tuesday. The high-performance layer-1 blockchain token has experienced a 15.5% decline over the last 30 days, reflecting subdued market sentiment amid geopolitical tensions and macroeconomic uncertainty.
Sui’s downtrend could extend from the current price level, particularly due to a massive token unlock event completed on Tuesday. Its microenvironment shows weakness, with technical indicators highlighting a bearish bias.
Sui’s unlocked supply hits 1.34 billion tokens
Sui has completed a colossal linear unlock, with 44 million coins joining the circulating supply. According to Tokenomist, the Sui Network’s circulating supply stands at 3.45 billion coins, representing about 34.46% of the total supply.
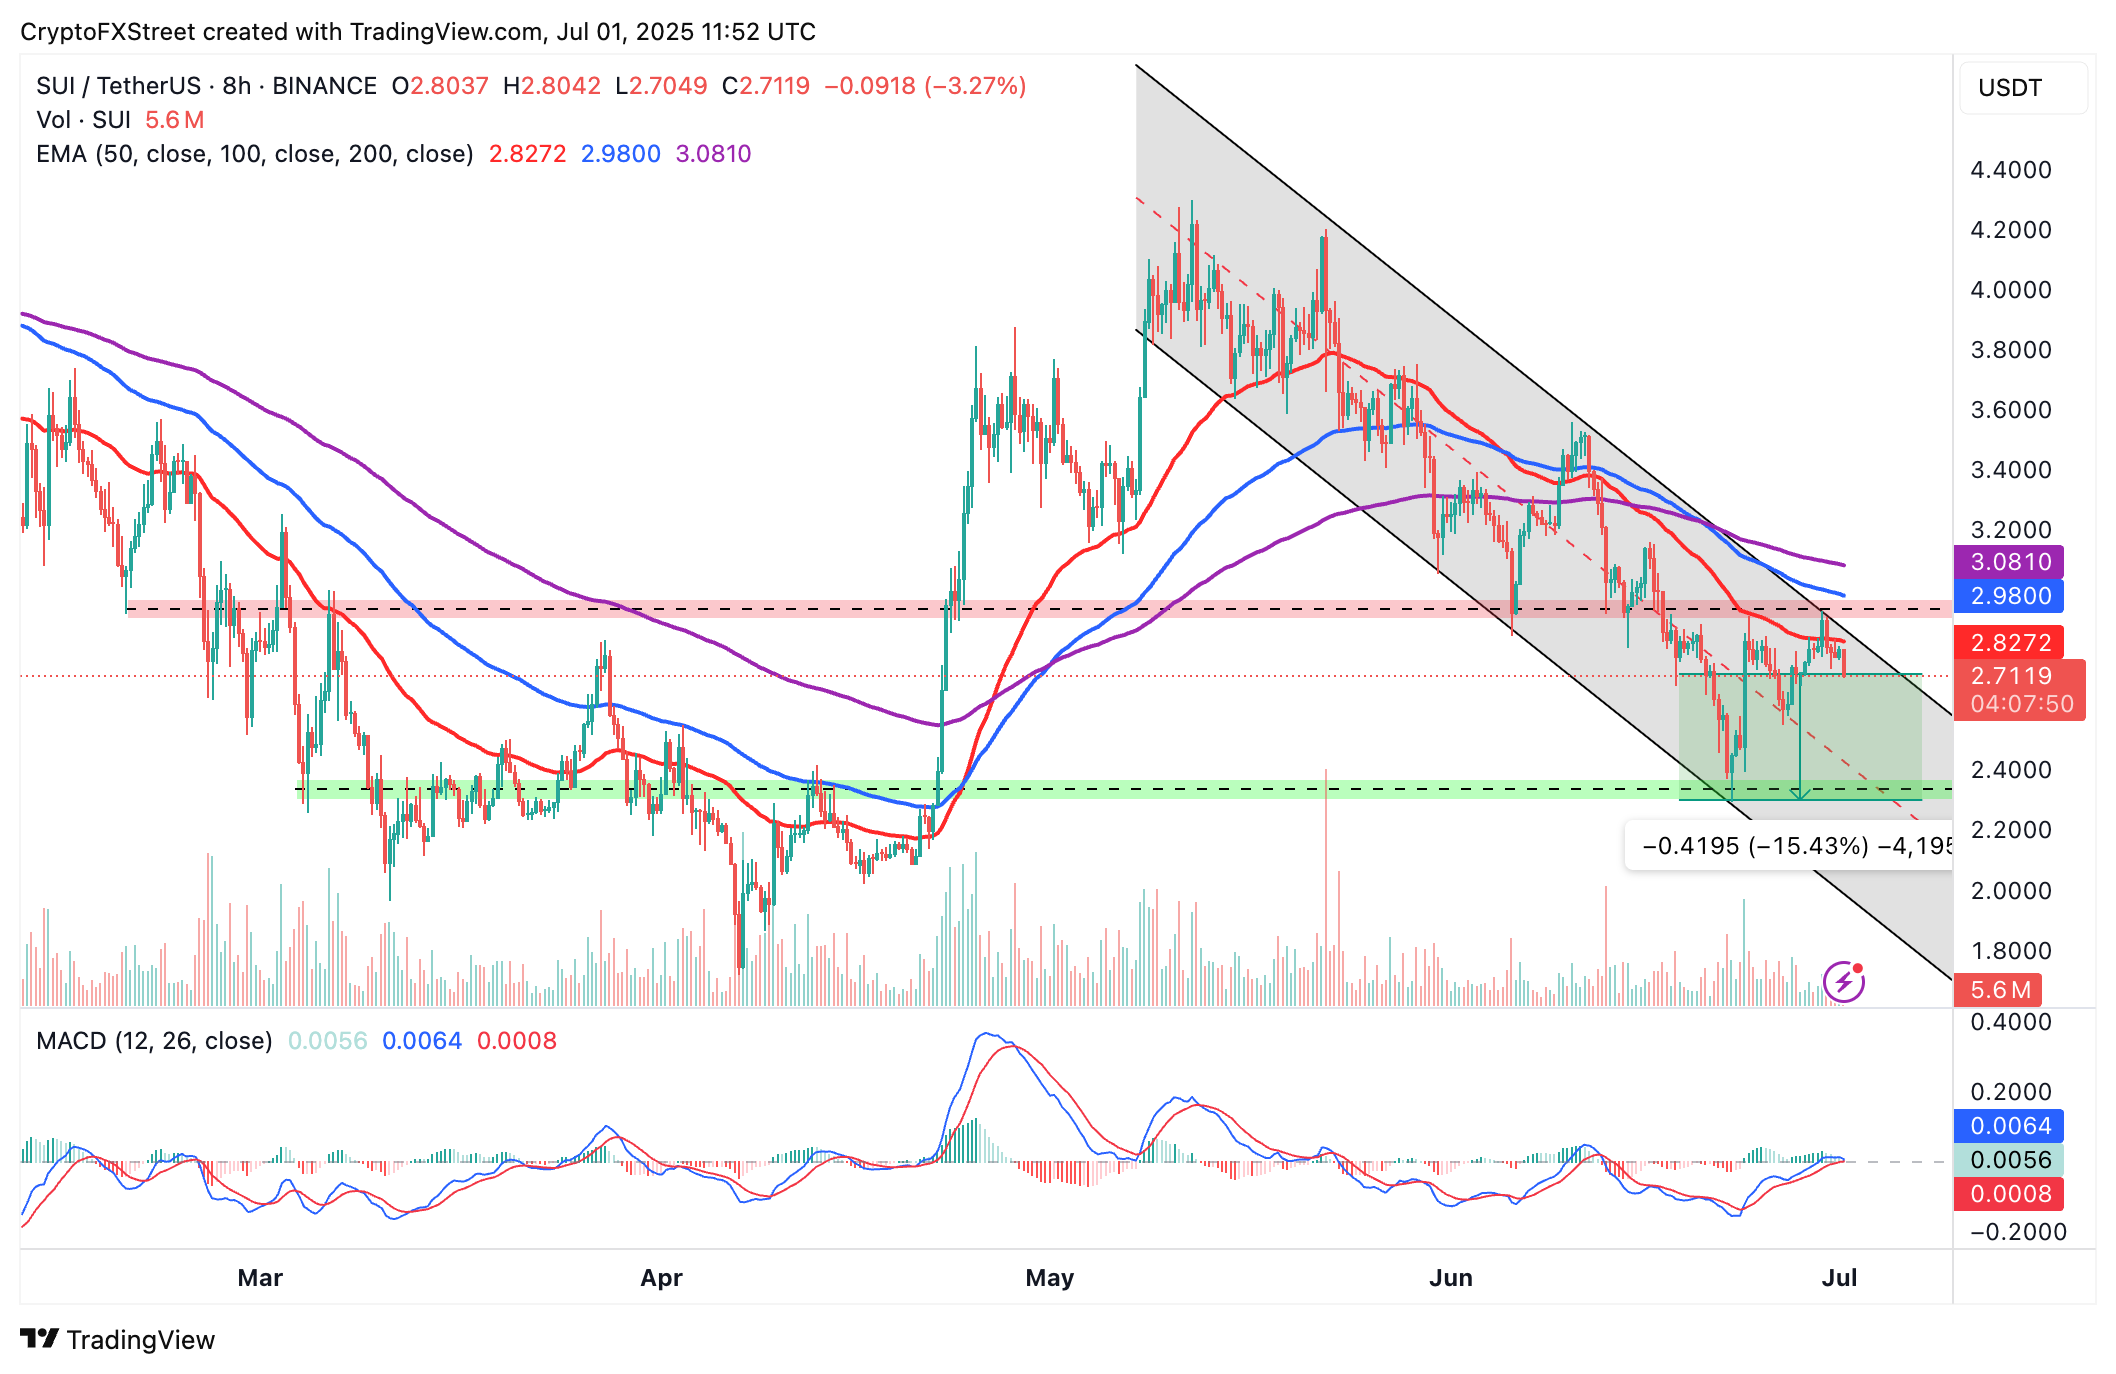
Tuesday’s token unlock, valued at $120 million, could significantly increase the risk of SUI, extending the decline by 15.5% to support at $2.30, tested on June 23. Sui has, since the May peak of $4.29, shed 37% of its value, underscoring a lack of conviction among traders.

Sui token unlock data | Source: Tokenomist
Despite the massive token unlock event, Sui investors should prepare for more supply shocks in the future, especially with 5.22 billion SUI, or 52.17% of the total supply, still unlocked.
Technical outlook: Sui bears tighten grip as futures open interest slides
Interest in Sui has taken a hit, reflecting the prolonged slump in the futures contract Open Interest (OI), which stands at $1.19 billion, down from $2.05, a peak achieved on May 23.
Open Interest refers to the value of active futures and options contracts that have not been settled or closed. A persistent decline indicates a decline in interest in the token, with traders seemingly unconvinced that the uptrend is sustainable.

Sui Futures Open Interest chart | Source: CoinGlass
Sui’s technical outlook leans bearish, with the token currently sitting below the 50-period EMA at $2.82, the 100-period EMA at $2.98, and the 200-period EMA at $3.08 on the 8-hour chart below.
The Moving Average Convergence Divergence (MACD) indicator is on the verge of validating a sell signal. Traders could de-risk from Sui with the blue MACD line crossing below the red signal line. The presence of red histogram bars below the zero line may indicate bearish momentum.

SUI/USDT 8-hour chart
Still, an immediate reversal from the current price cannot be ruled out and would depend on sentiment in the broader crypto market. Moreover, the descending channel, highlighted on the chart, could provide support at the middle boundary and prevent the potential drop to $2.30.
Open Interest, funding rate FAQs
Higher Open Interest is associated with higher liquidity and new capital inflow to the market. This is considered the equivalent of increase in efficiency and the ongoing trend continues. When Open Interest decreases, it is considered a sign of liquidation in the market, investors are leaving and the overall demand for an asset is on a decline, fueling a bearish sentiment among investors.
Funding fees bridge the difference between spot prices and prices of futures contracts of an asset by increasing liquidation risks faced by traders. A consistently high and positive funding rate implies there is a bullish sentiment among market participants and there is an expectation of a price hike. A consistently negative funding rate for an asset implies a bearish sentiment, indicating that traders expect the cryptocurrency’s price to fall and a bearish trend reversal is likely to occur.


