
Sei extends rally as investors shift to altcoins with robust chains and use cases
- Sei extends sentiment-driven rally, approaching the $3.00 round figure resistance after reclaiming the 200-day EMA support.
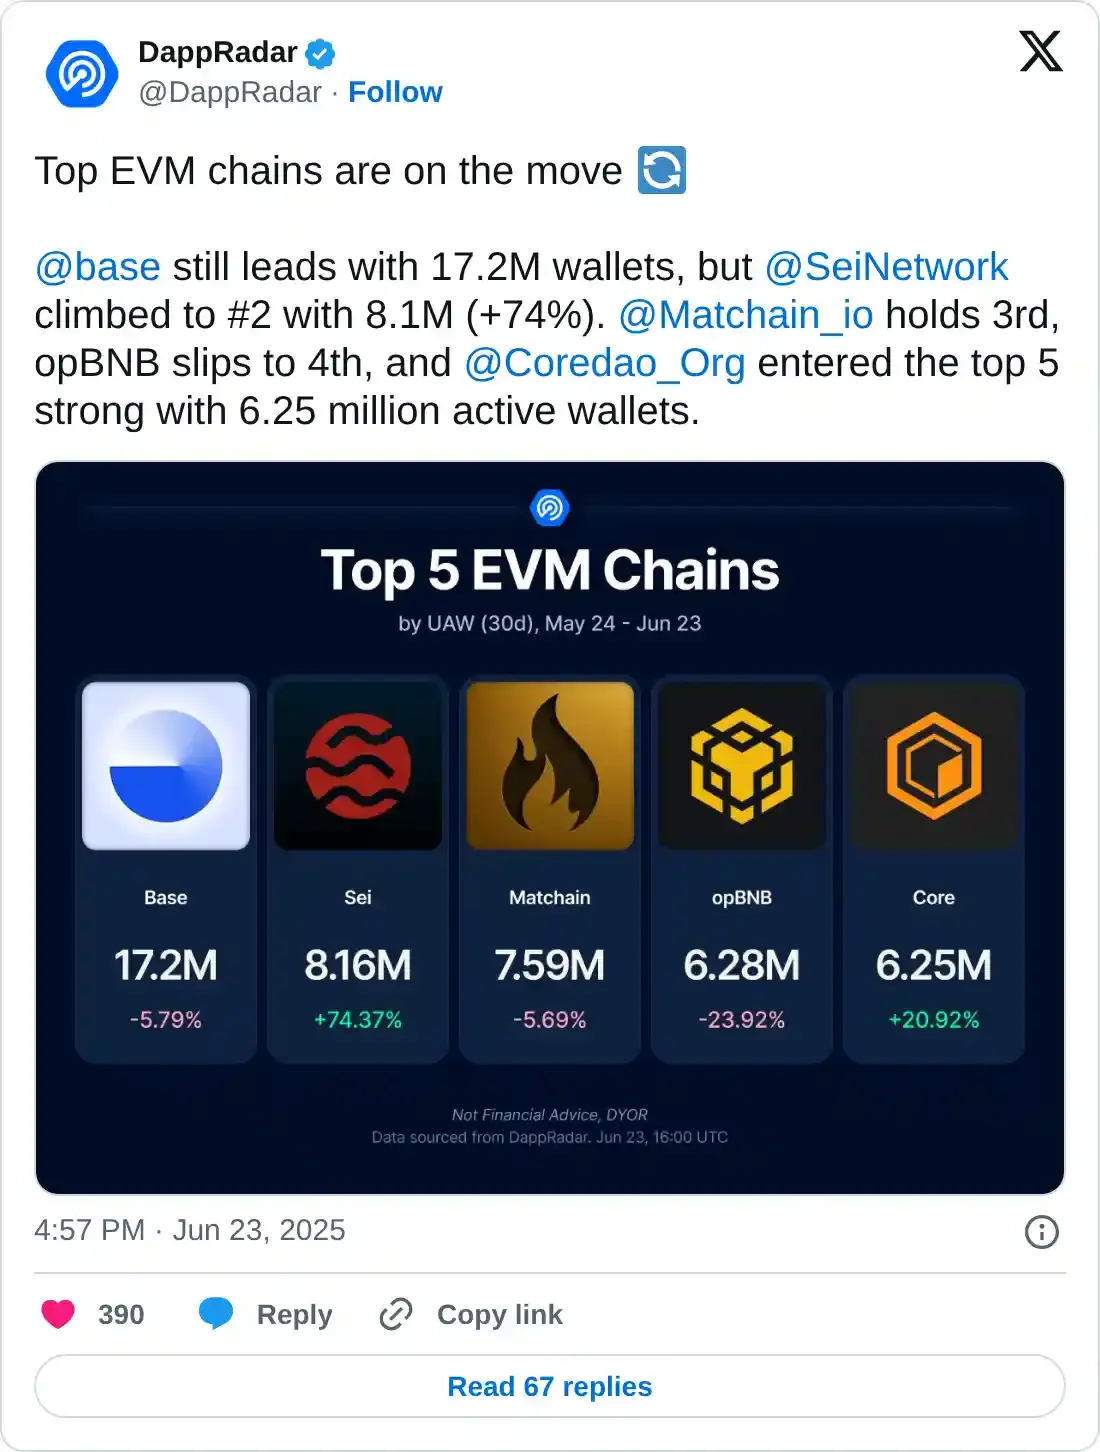
- Sei becomes the second-largest EVM chain, boasting 8.1 million active addresses.
- Sei's DeFi TVL surges over 28% to approximately $543 million in 24 hours.
Sei (SEI) leads recovery among the top 100 cryptocurrencies, with intraday gains exceeding 13% while trading at around $0.27 at the time of writing on Tuesday.
The high-performance Layer-1 blockchain, designed to support Decentralized Finance (DeFi) and high-frequency trading, builds on robust sentiment in the crypto market as Middle East tensions ease, alongside steady conviction from traders and protocol users.
Sei's active wallets surge 74%
Sei has topped multiple chains to become the second-largest Ethereum Virtual Machine (EVM) protocol after Coinbase's Base. According to DappRadar, Base leads with 17.2 million wallets, followed by Sei with 8.1 million wallets, while Matchain holds third position with 7.6 million wallets.
A 74% increase in active addresses reflects growing interest and the adoption of the Sei Network. The rally witnessed since Sei's June low of $0.15 underscores an increase in demand backed by growing sentiment in the broader cryptocurrency market.
CoinGlass reports a significant increase in the derivatives market's Open Interest (OI), reaching roughly $248 million over the past 24 hours, accompanied by a 272% surge in trading volume to $2.15 billion.
An increase in OI as trading surges indicates risk-on sentiment and a spike in market activity. A long-to-short ratio of 1.019 implies that traders are leaning toward the bullish side, underpinned by $3.25 million in short position liquidations compared to approximately $844,000 in long liquidations.
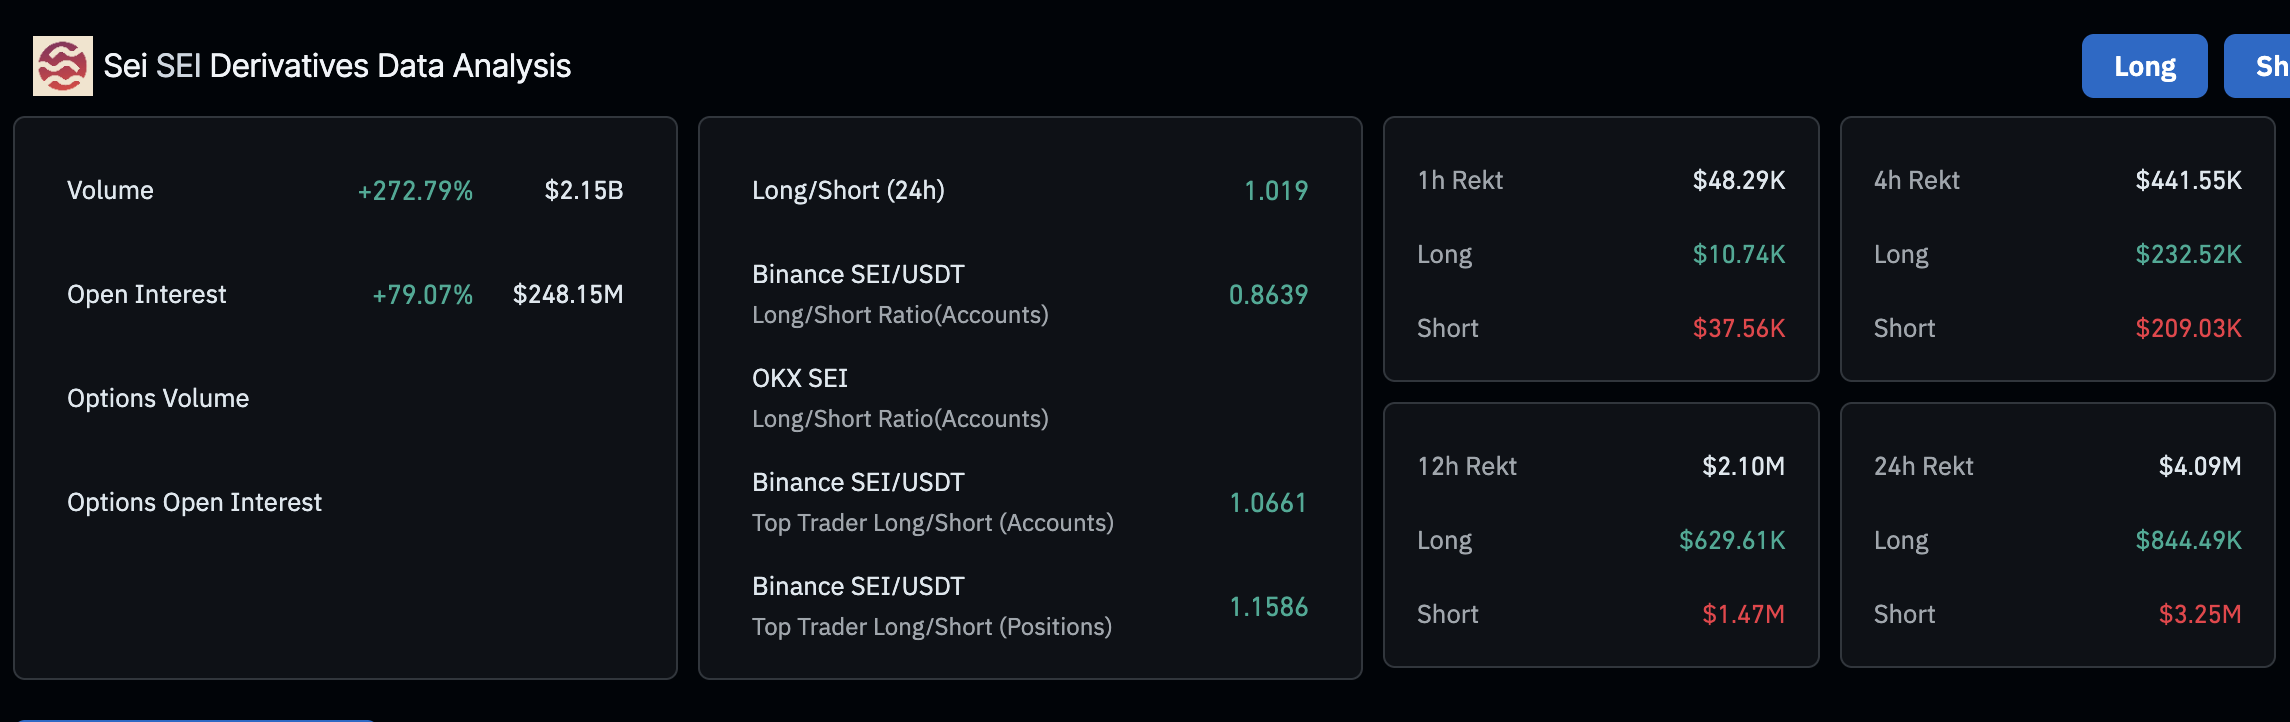
Sei derivatives market data | Source CoinGlass
Subsequently, Sei's Decentralized Finance (DeFi) Total Value Locked (TVL) surged to $543 million, marking a 28% increase in 24 hours.
DeFiLlama highlights steady TVL, which refers to the USD Dollar (USD) sum of all coins held in smart contracts of all protocols hosted on the Sei blockchain. The TVL Increase indicates growing confidence in the token, participation to earn rewards, and speculation in the DeFi ecosystem.
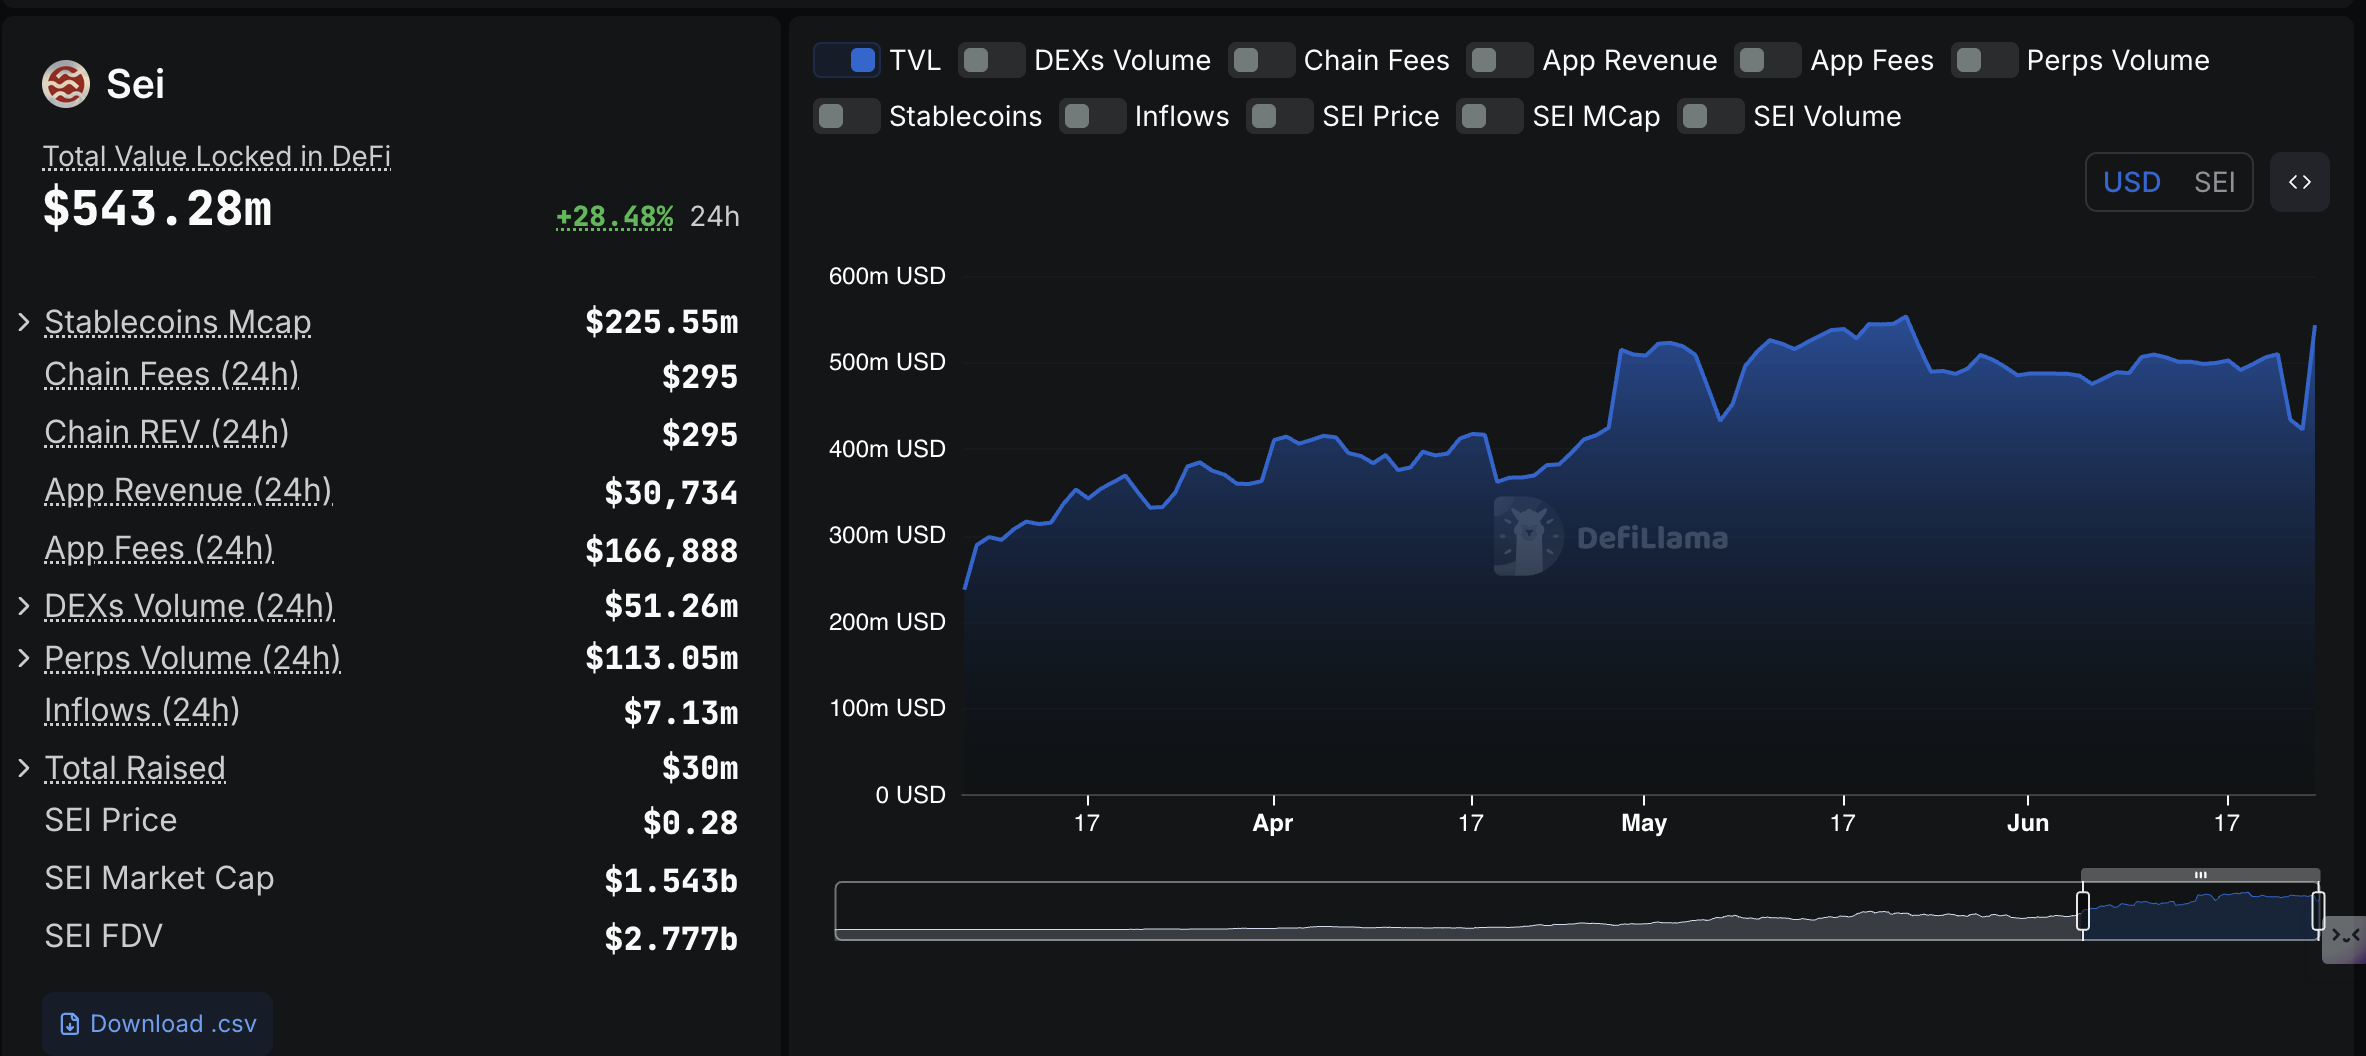
Sei DeFi TVL | Source| DefiLllama
Technical outlook: Sei upholds robust bullish outlook
Sei continues to extend the remarkable recovery, marking a near 78% rally from its recent low of $0.15, reached on June 17. The token is positioned above the 200-day Exponential Moving Average (EMA), currently at $0.26, further solidifying the bullish trend.
A buy signal from the Moving Average Convergence (MACD) indicator has the potential to boost the tailwind. Traders often seek exposure to SEI, with the blue MACD line crossing above the red signal line.
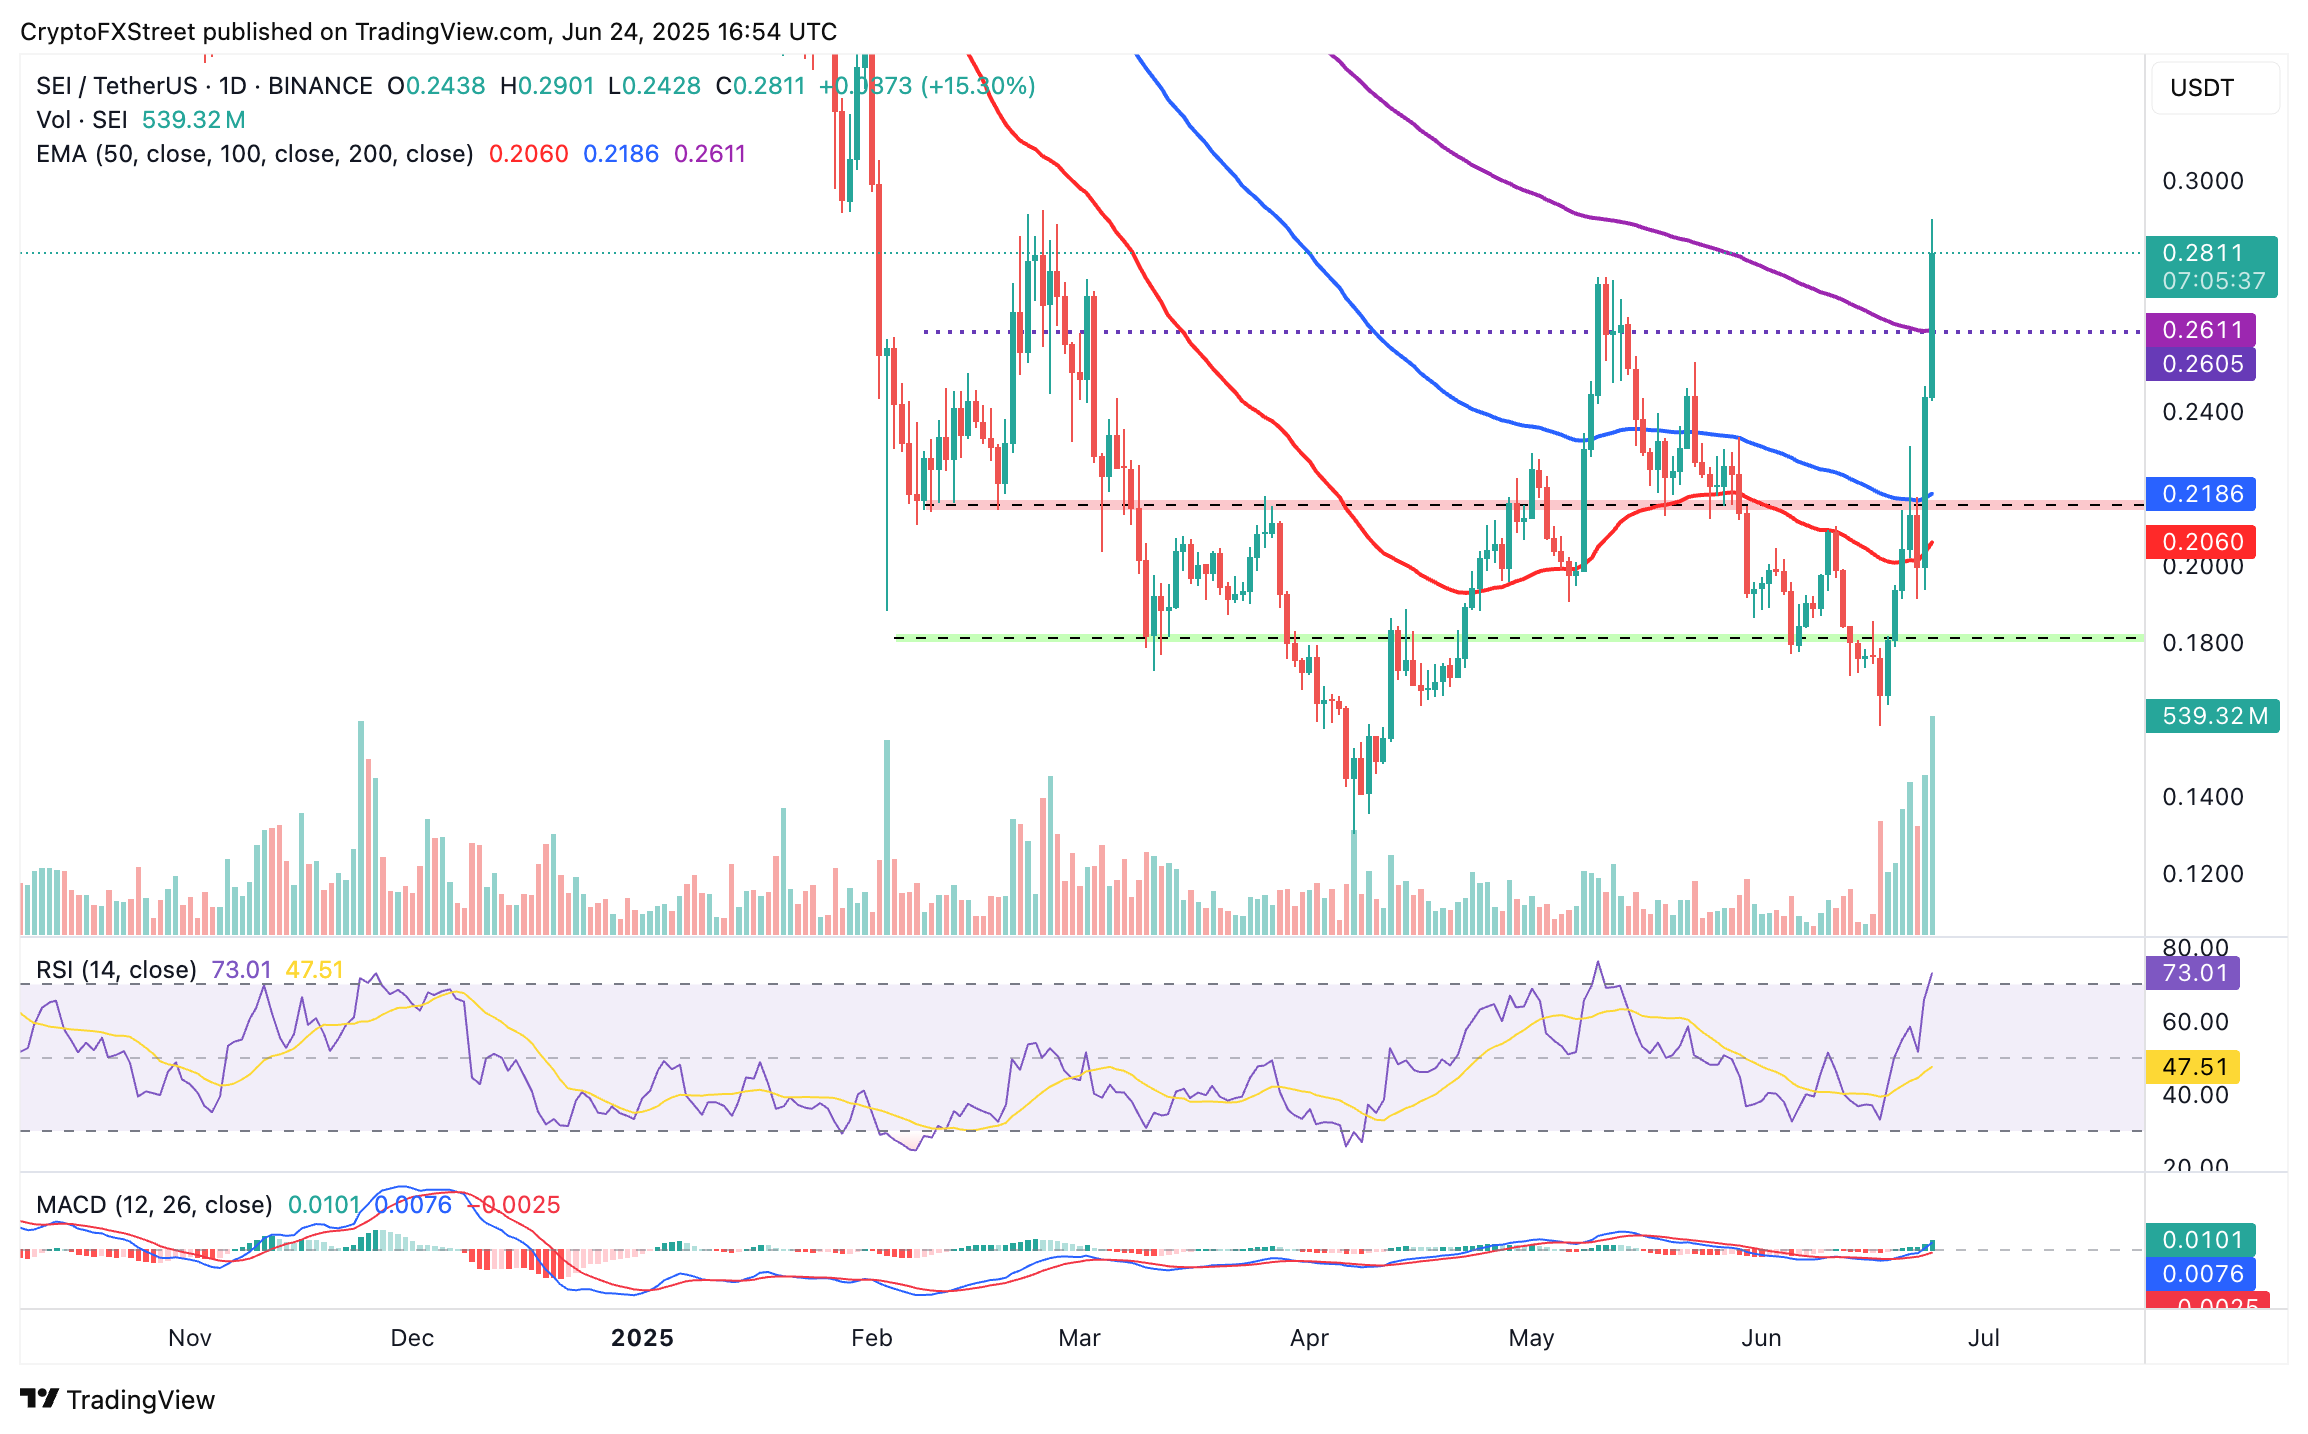
SEI/USDT daily chart
The path of least resistance is upward, supported by the Relative Strength Index (RSI) returning to overbought territory for the first time since mid-May.
However, traders should pay attention to the RSI's position, as a pullback into the neutral region is often a precursor to trend reversals, which are likely to be triggered by profit-taking and changing market dynamics.
Key levels of interest to traders on the downside include the 200-day EMA support at $0.26, the 100-day EMA at $0.21 and the 50-day EMA at $0.20.
Open Interest, funding rate FAQs
Higher Open Interest is associated with higher liquidity and new capital inflow to the market. This is considered the equivalent of increase in efficiency and the ongoing trend continues. When Open Interest decreases, it is considered a sign of liquidation in the market, investors are leaving and the overall demand for an asset is on a decline, fueling a bearish sentiment among investors.
Funding fees bridge the difference between spot prices and prices of futures contracts of an asset by increasing liquidation risks faced by traders. A consistently high and positive funding rate implies there is a bullish sentiment among market participants and there is an expectation of a price hike. A consistently negative funding rate for an asset implies a bearish sentiment, indicating that traders expect the cryptocurrency’s price to fall and a bearish trend reversal is likely to occur.
Artigos Recomendados


