


Top 3 Price Prediction: Bitcoin, Ethereum, Ripple – BTC consolidates, ETH and XRP stall
- Bitcoin consolidates below $65,000 on Wednesday, after its massive drop in the previous week.
- Ethereum is correcting after failing to close above key resistance around $1,823 the previous day.
- XRP hovers around $0.97 on Wednesday, nearing the key psychological level around $1.00.
Bitcoin (BTC) remains under pressure, consolidating below $65,000 on Wednesday following a massive crash last week. Ethereum (ETH) and Ripple (XRP) followed BTC’s footsteps and are stalled below their key resistance levels. Price action for these top three cryptocurrencies shows bears remain in control of the trend, with recovery rallies likely to be viewed as corrective within a dominant downward phase.
Bitcoin consolidates after massive drop
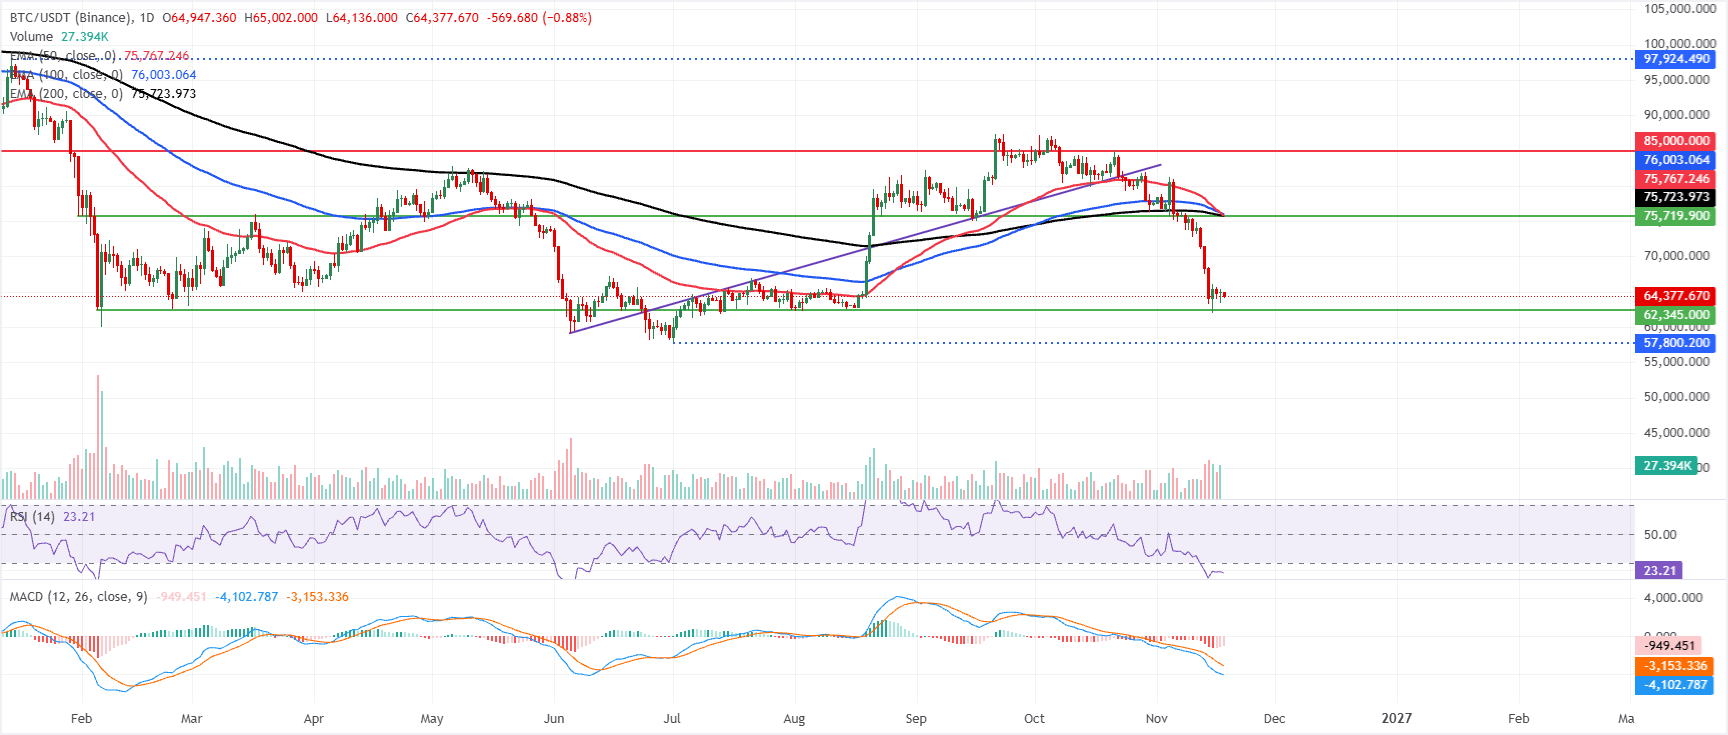
Bitcoin price trades at $64,377 on Wednesday, consolidating below $65,000 after a massive drop in the previous week. BTC maintains a bearish near-term bias as it holds well below the main Exponential Moving Averages (EMAs). The 50-day, 100-day and 200-day EMAs clustered between roughly $75,700 and $76,000 sit far above spot and suggest the market remains under corrective pressure.
Momentum readings reinforce this tone, with the Relative Strength Index (RSI) deep in oversold territory near 23. At the same time, the Moving Average Convergence Divergence (MACD) remains negative and depressed, suggesting persistent downside pressure despite the already sharp pullback.
On the topside, initial resistance is the 200-day EMA at $75,723, followed closely by the 50-day EMA at $75,767 and the 100-day EMA at $76,003, which together form a dense supply zone likely to cap any short-term recovery attempts. Beyond this cluster, a more distant hurdle emerges at the horizontal resistance level of $85,000, where sellers could again reassert control if a stronger rebound unfolds.
Ethereum fails to close above key resistance
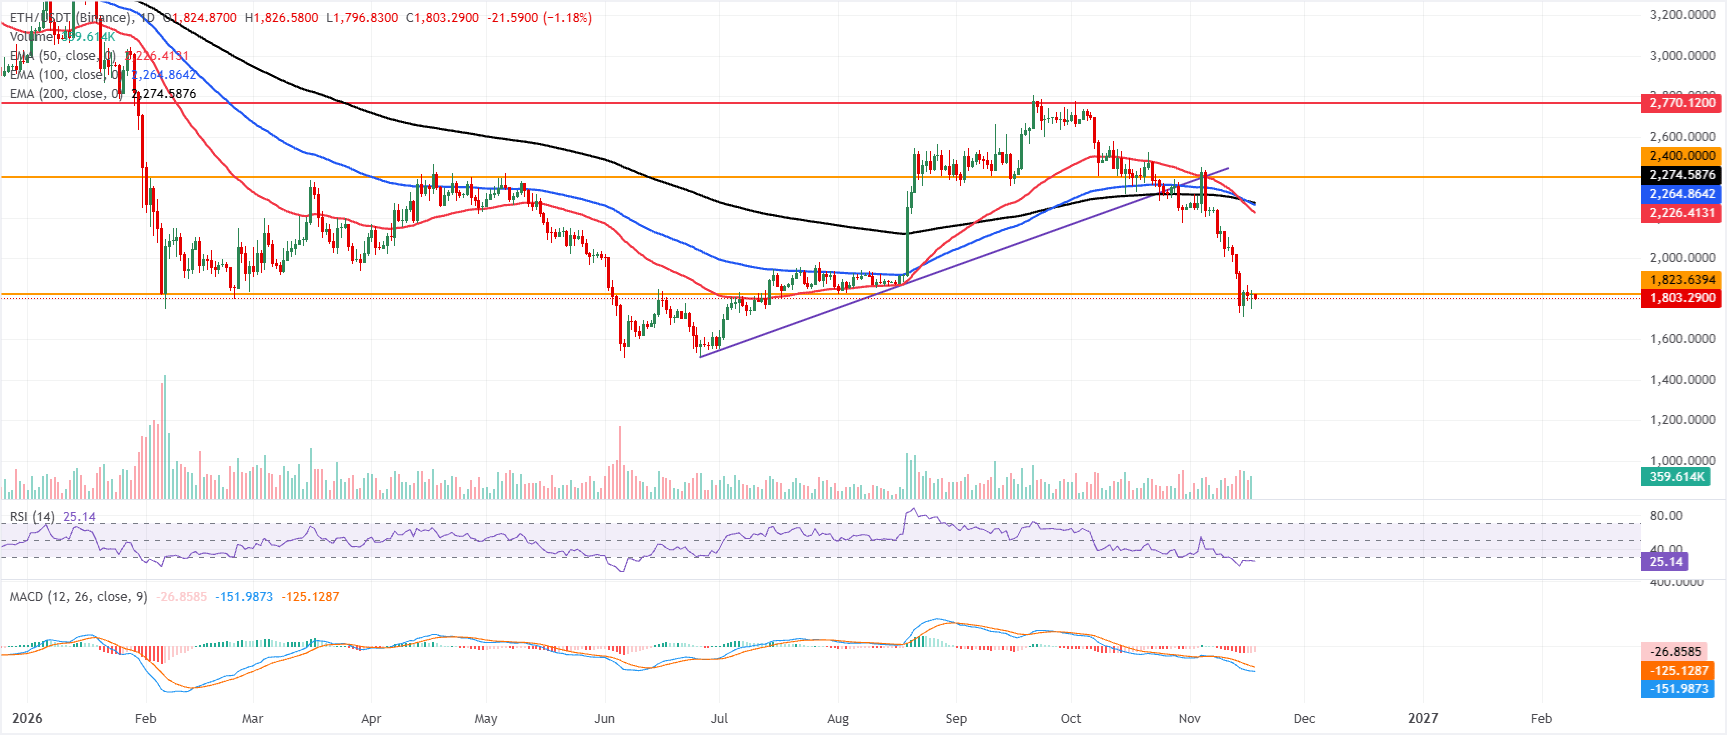
Ethereum price trades at $1,803 on Wednesday after failing to close above the key resistance at $1,823 the previous day.
In addition, ETH maintains a clear bearish bias as it holds well below the 50-day, 100-day, and 200-day EMAs at $2,226, $2,264, and $2,274, respectively. This stacked band of EMAs above the market suggests the broader trend remains under downside pressure. At the same time, the RSI at 25 hovers in oversold territory and the MACD stays deeply negative, hinting that momentum remains weak despite the risk of short-lived corrective bounces.
On the topside, initial resistance is seen at the horizontal barrier near $1,823, with further supply expected at the 50-day EMA around $2,226, followed by the 100-day EMA at $2,264 and the 200-day EMA at $2,274. Above these, a more substantial cap is located at the $2,400 horizontal level, ahead of the prior uptrend support line, now turned resistance, around $2,493 and the higher ceiling near $2,770; as long as ETH trades beneath this sequence of resistances, rallies are likely to be viewed as corrective within a dominant downward phase.
XRP stalls below key psychological $1 mark
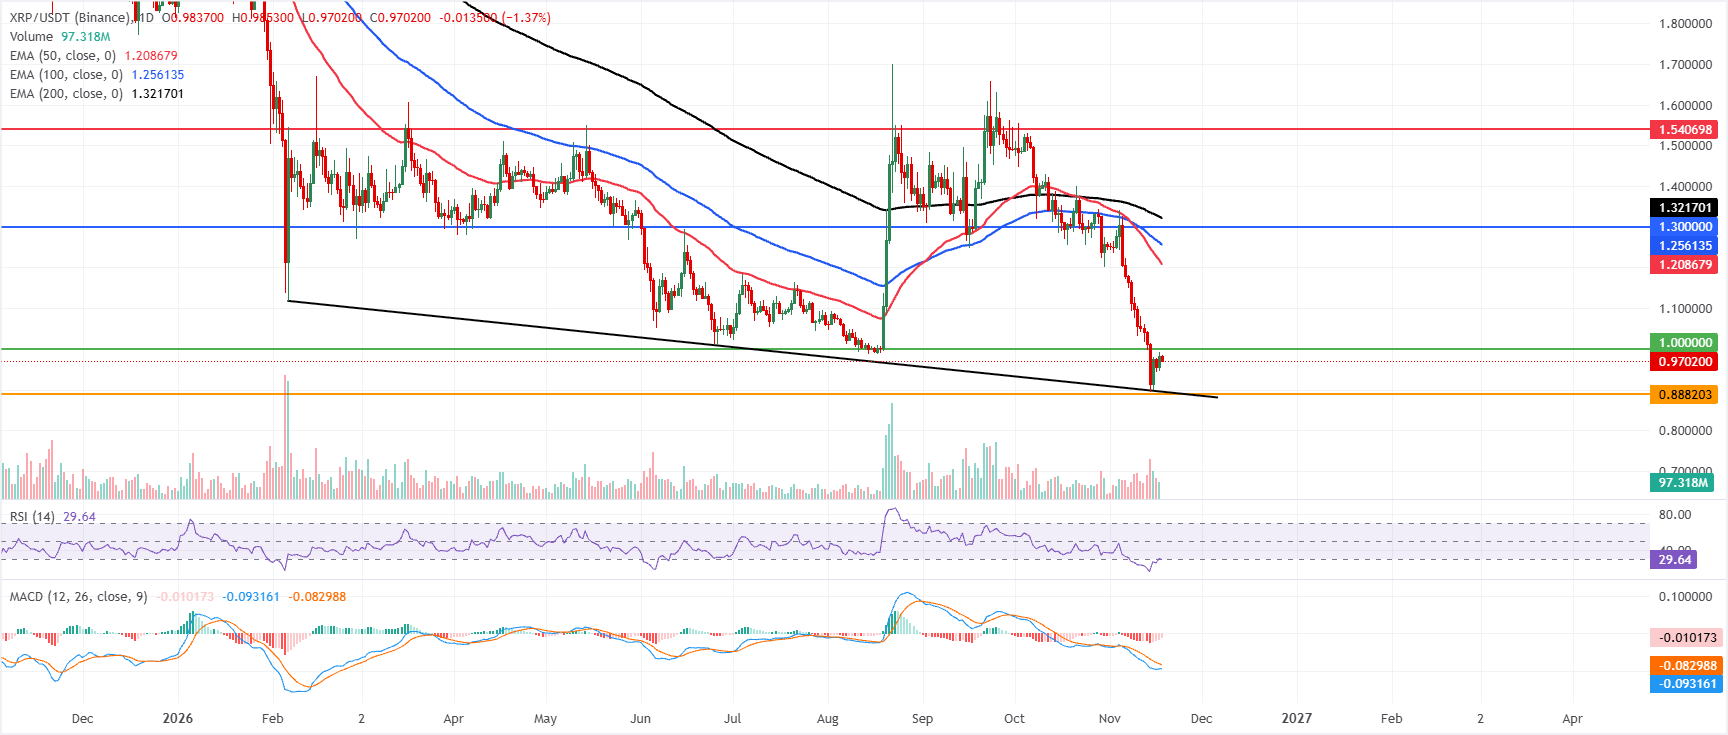
XRP trades at $0.970 on Wednesday, extending a bearish phase with price lodged well beneath the 50-day, 100-day, and 200-day EMAs at $1.208, $1.256, and $1.321, respectively. This stacked EMA configuration above spot suggests the market is firmly under downside pressure, while the RSI at about 29 signals oversold conditions that could slow, but not yet reverse, the decline; the MACD remains negative, reinforcing weak underlying momentum despite some moderation in its bearish slope.
On the topside, initial resistance appears at the psychological $1.000 handle, ahead of the 50-day EMA near $1.208 and the 100-day EMA around $1.256, with a more substantial cap at the $1.300 horizontal level; above these, the 200-day EMA at $1.321 and prior chart barriers at $1.540 and $1.900 define a broader medium-term supply zone.
On the downside, immediate support is seen at the previously plotted horizontal level of $0.888, and a clear break below this floor would expose the pair to further technical deterioration, while holding above it could allow an oversold bounce toward the nearby resistance band.
(The technical analysis of this story was written with the help of an AI tool. Know more.)
Open Interest, funding rate FAQs
Higher Open Interest is associated with higher liquidity and new capital inflow to the market. This is considered the equivalent of increase in efficiency and the ongoing trend continues. When Open Interest decreases, it is considered a sign of liquidation in the market, investors are leaving and the overall demand for an asset is on a decline, fueling a bearish sentiment among investors.
Funding fees bridge the difference between spot prices and prices of futures contracts of an asset by increasing liquidation risks faced by traders. A consistently high and positive funding rate implies there is a bullish sentiment among market participants and there is an expectation of a price hike. A consistently negative funding rate for an asset implies a bearish sentiment, indicating that traders expect the cryptocurrency’s price to fall and a bearish trend reversal is likely to occur.
Artigos Recomendados


