


Bitcoin sell-off deepens as 51% of supply falls underwater
- Bitcoin fell 14% over seven days, trading 8.5% below its 200-week average with over half of its circulating supply underwater.
- Bitcoin ETF outflows reached 44,900 BTC across 14 days, while leveraged ETF exposure dropped to its lowest level since March 2024.
- Major events to watch include Nvidia's earnings, Wednesday’s Fed minutes, October PCE data and Anthropic's public-market debut.
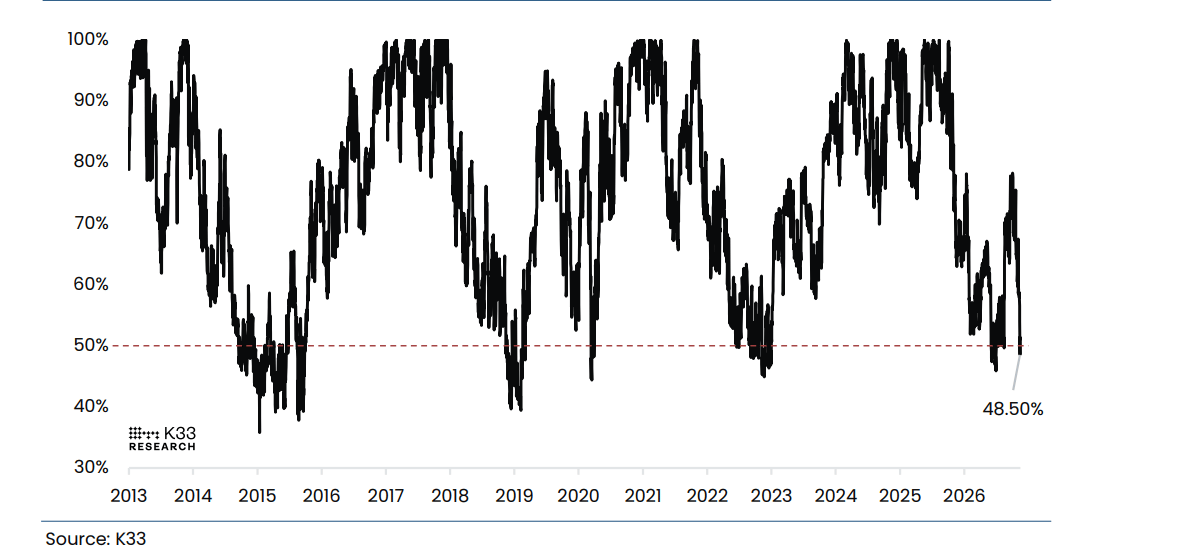
Bitcoin (BTC) has fallen 14% in seven days, trading below its 200-week moving average as K33 reports that 51.5% of circulating supply is now held at a loss. ETF withdrawals and elevated derivatives leverage add to market pressure.
Bitcoin sell-off pushes more than half of supply underwater
Bitcoin fell 14% in the past week, reaching levels last seen in early August and trading as much as 8.5% below its 200-week moving average on November 15. According to a Tuesday report from K33, last week's decline marked six consecutive negative seven-day periods, a streak that has previously occurred only twice in Bitcoin’s history. The sell-off has left 51.5% of Bitcoin circulating supply underwater.
“This puts BTC's price in territory where holders on average could have sold for more within the past 4 years,” K33 wrote.
K33 also highlighted 44,900 BTC in net outflows from ETFs in 14 trading days since October 29. Although below June’s 71,000 BTC record, the current outflows are “comparable to the extremes” recorded around previous local lows.
Leveraged ETF exposure also fell to 21,900 BTC, its lowest level since March 2024.
The report states that the relationship between 30-day flows for Bitcoin ETFs and BTC's price returns remains strong.
"This relationship has persisted for several years, with an R² of 0.71 between 30-day flows and returns in 2026," the firm stated.
Bitcoin derivatives maintain persistent leverage despite forced selling
On the derivatives angle, one-month 25-delta options skew moved above 20 for the first time since July, reflecting heavy demand for downside protection.
Bitcoin perpetual futures also came under pressure after the top crypto fell below $70,000. K33 noted that funding rates repeatedly turned negative alongside a sharp decline in open interest, signaling forced selling.
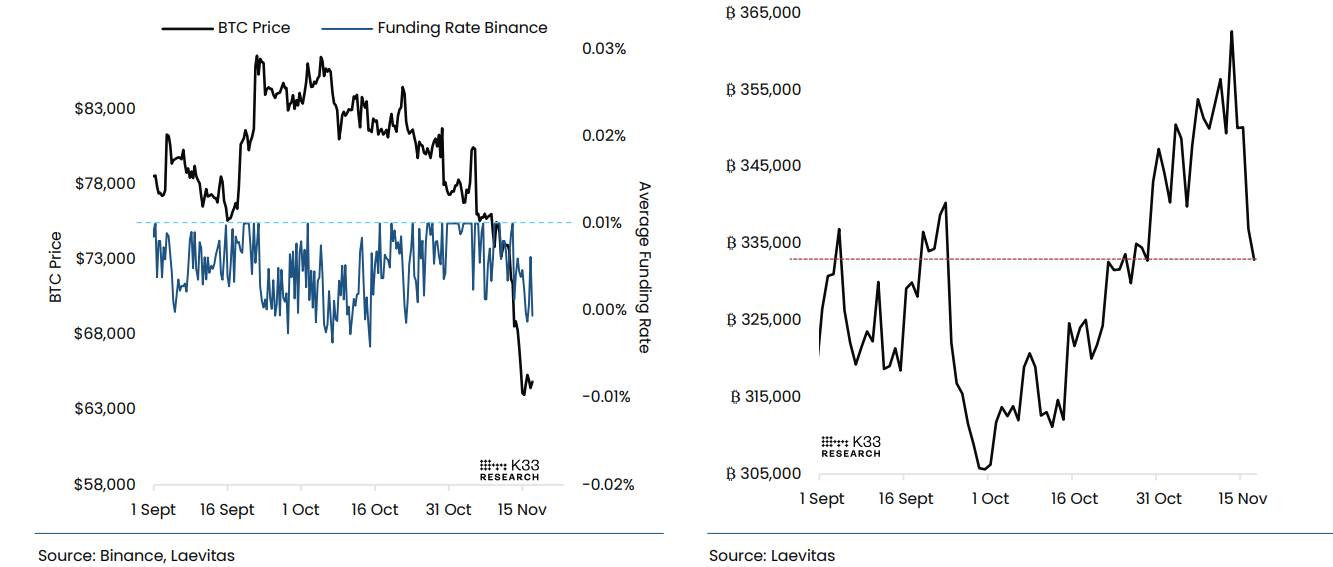
Roughly $1.3 billion in Bitcoin long positions were liquidated between November 13 and 14, the highest two-day total since October 2025. The move also marks the second-largest liquidation event of 2026. The liquidation wave reduced perpetual futures open interest by 30,000 BTC, but it remained above 330,000 BTC, close to September’s levels.
“Despite partial deleveraging amid the sharp drawdown, leverage remains elevated relative to historical norms,” the report noted.
Digital asset trading firm Wintermute offered a more defensive assessment, noting that the rally from July had proved a “fake-out,” according to a Tuesday report.
“This is a rates tape in which Bitcoin is the non-yielding funding leg, the ETF bid is gone and the technicals have broken, so we stay defensive and the path of least resistance still feels lower and we’ll likely chop here,” Wintermute wrote.
The firm stated that it would reconsider its defensive stance if Bitcoin reclaimed the 200-week moving average near $68,000 on a daily close, accompanied by net ETF inflows.
Wintermute also pointed to Wednesday’s Fed minutes, October PCE data and upcoming market events, including Nvidia’s results and Anthropic's public-market debut, as potential sources of volatility amid thin holiday liquidity.
Bitcoin is trading at $63,800, down 2% in the past 24 hours at the time of writing.
Artigos Recomendados


