


Gulf attacks lift Crude Oil, but most of Monday's drop stays
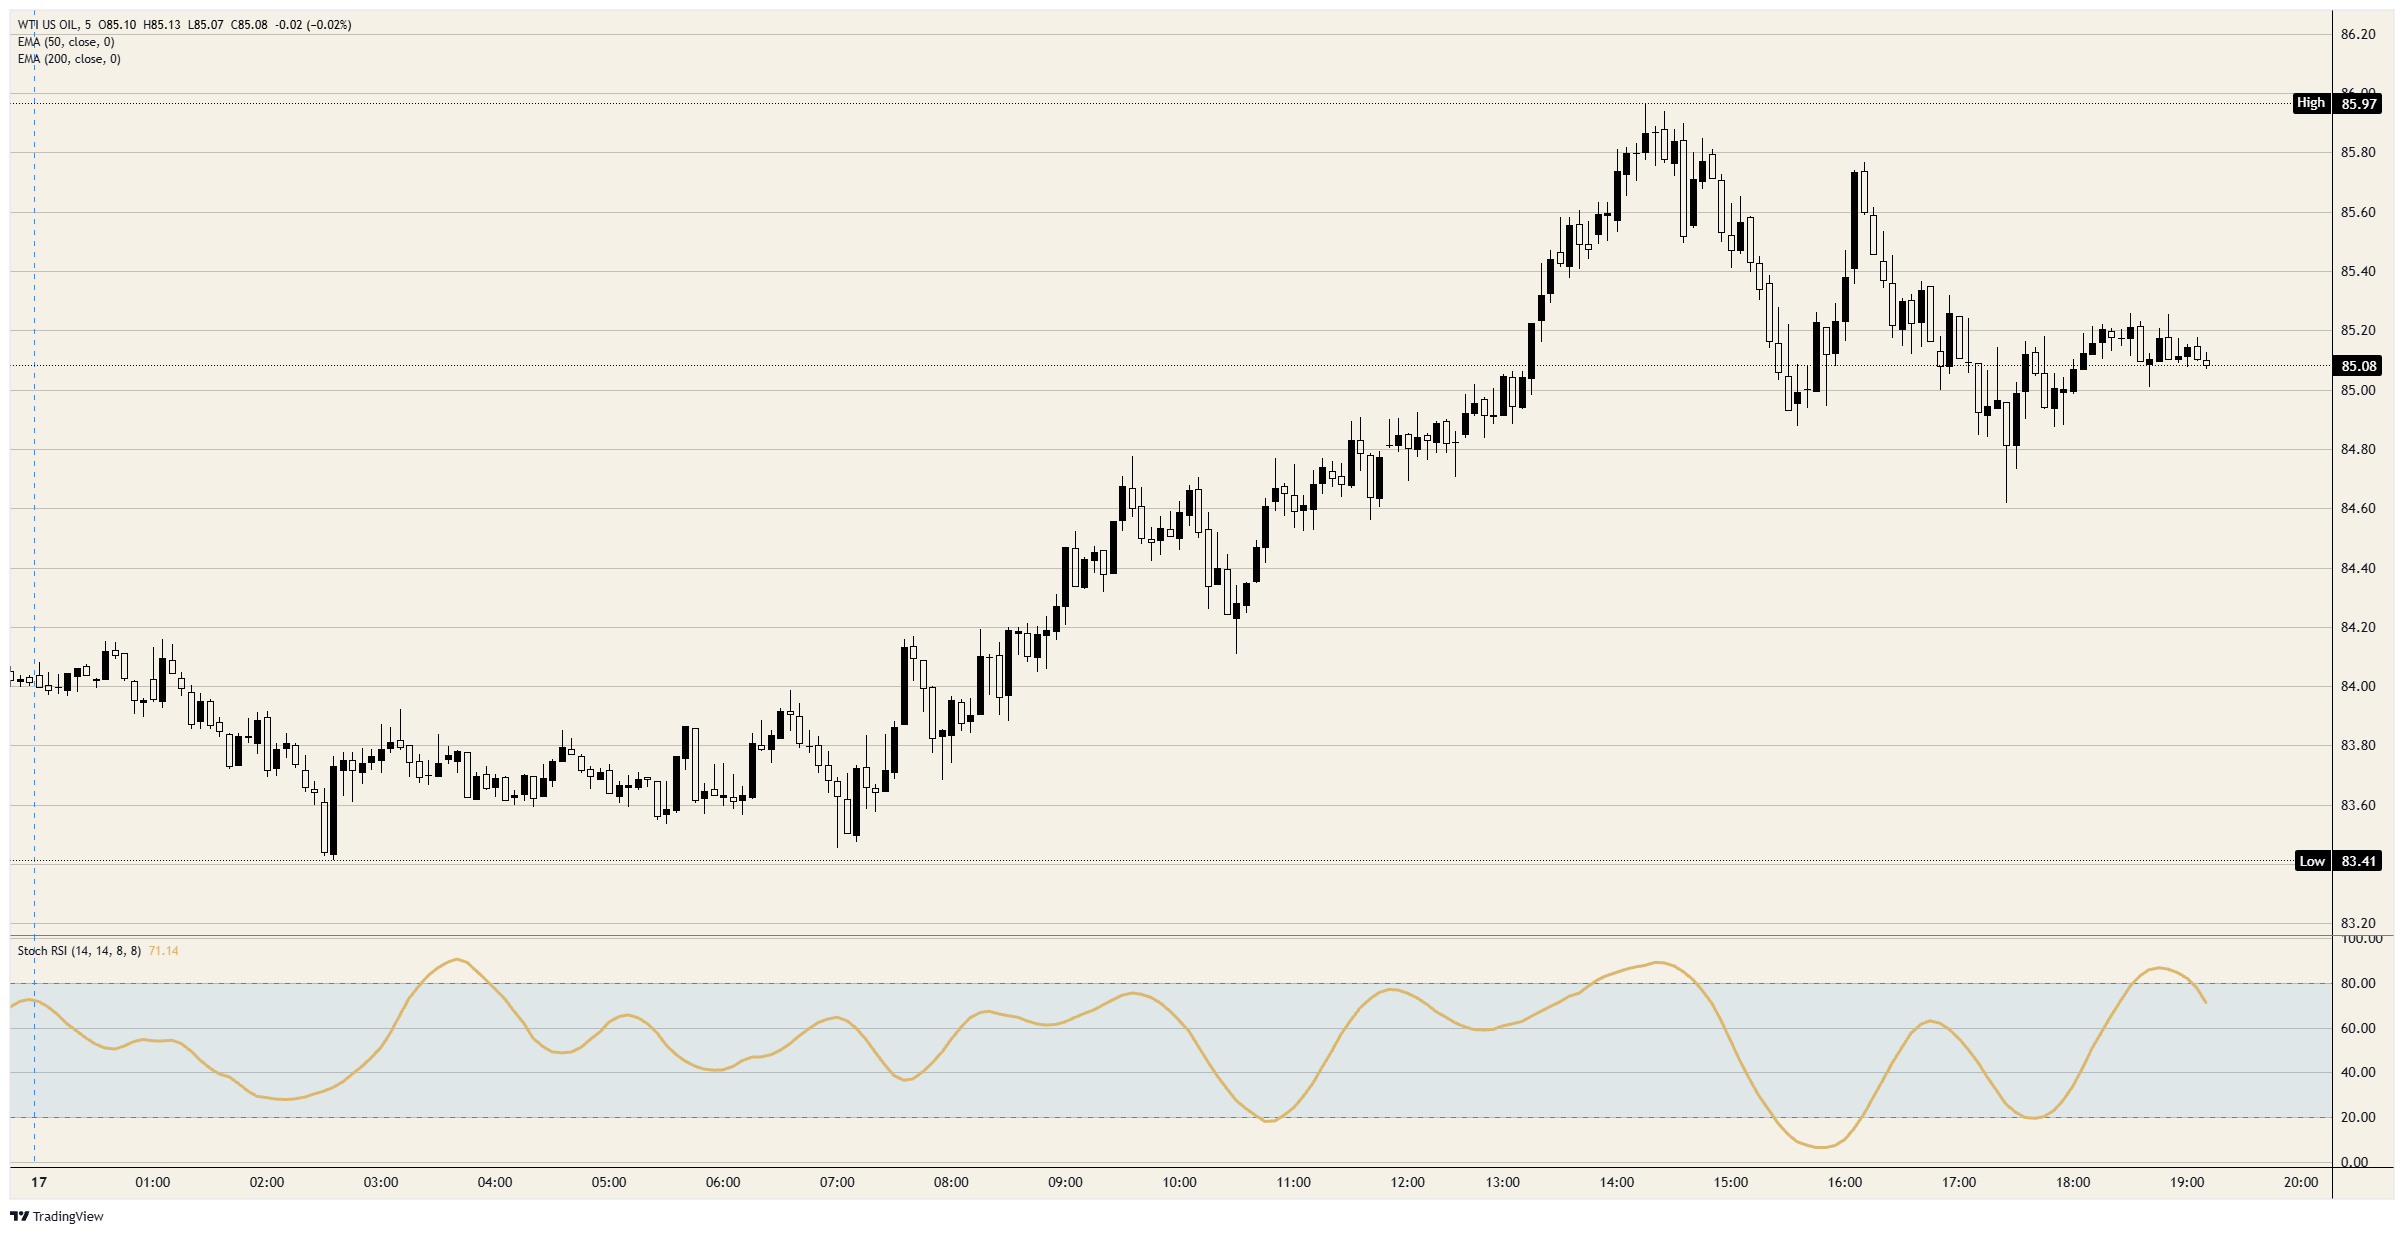
- WTI climbs from its lowest since November 10 to just under $86.00, then fades.
- Hormuz flows are near pre-war levels, and the IEA forecasts a surplus.
- The EIA's weekly US stock count is due Wednesday, a day after the API's.
A day of tanker fires, strikes and drone claims around the Gulf has returned only about a quarter of what Crude Oil lost on Monday. WTI fell to just under $83.50, its lowest since November 10, then climbed to just under $86.00. About a third of that climb is gone, and WTI is trading just above $85.00.
The climb came as Reuters reported Iranian attacks on US bases in Bahrain and Bloomberg reported vessel attacks around the Strait of Hormuz. It stopped before Iran's Revolutionary Guard navy said a fourth tanker had caught fire east of the strait, and before Iranian state media reported a US attack on Qeshm island. The Houthis then said they sent drones at a Saudi pipeline carrying about 4% of world supply, and WTI stayed within about 25 cents of $85.00.
Monday's fall came as Reuters reported shipments through the Strait of Hormuz nearly back to pre-war levels, and the International Energy Agency (IEA) forecasts a surplus this quarter. Bloomberg described a pattern of early-week falls when weekend fears of escalation don't play out, and WTI has fallen on each of the last three Mondays.
On the calendar
The American Petroleum Institute (API) reports US stockpiles at 21:30 GMT on Tuesday, and the Energy Information Administration (EIA) follows at 15:30 GMT on Wednesday. Reuters reported that traders expect Crude Oil stocks to fall. The EIA put them at 410 million barrels at the end of October, the lowest for that date since 2014, against the surplus forecast for the world market.
Asia-Pacific Economic Cooperation (APEC) leaders meet in Shenzhen on Wednesday and Thursday, where President Trump is expected to meet President Putin and President Xi. A senior source told Al Arabiya the US-Iran diplomatic track hasn't produced a breakthrough, and Iranian Foreign Minister Araghchi is in Muscat for talks. Russian and Iranian barrels are the supply those meetings could change.
On the charts
Monday's close was the first below the 200-day Exponential Moving Average (EMA) since early August, and WTI is trading back above the average. The drop from the October 30 high near $104.00 to the November 10 low near $83.00 is about a fifth, and the 50-day EMA is near $91.50. Daily momentum is oversold for the first time since early October.
Spot WTI Crude Oil 5-minute chart
WTI Oil FAQs
WTI Oil is a type of Crude Oil sold on international markets. The WTI stands for West Texas Intermediate, one of three major types including Brent and Dubai Crude. WTI is also referred to as “light” and “sweet” because of its relatively low gravity and sulfur content respectively. It is considered a high quality Oil that is easily refined. It is sourced in the United States and distributed via the Cushing hub, which is considered “The Pipeline Crossroads of the World”. It is a benchmark for the Oil market and WTI price is frequently quoted in the media.
Like all assets, supply and demand are the key drivers of WTI Oil price. As such, global growth can be a driver of increased demand and vice versa for weak global growth. Political instability, wars, and sanctions can disrupt supply and impact prices. The decisions of OPEC, a group of major Oil-producing countries, is another key driver of price. The value of the US Dollar influences the price of WTI Crude Oil, since Oil is predominantly traded in US Dollars, thus a weaker US Dollar can make Oil more affordable and vice versa.
The weekly Oil inventory reports published by the American Petroleum Institute (API) and the Energy Information Agency (EIA) impact the price of WTI Oil. Changes in inventories reflect fluctuating supply and demand. If the data shows a drop in inventories it can indicate increased demand, pushing up Oil price. Higher inventories can reflect increased supply, pushing down prices. API’s report is published every Tuesday and EIA’s the day after. Their results are usually similar, falling within 1% of each other 75% of the time. The EIA data is considered more reliable, since it is a government agency.
OPEC (Organization of the Petroleum Exporting Countries) is a group of 12 Oil-producing nations who collectively decide production quotas for member countries at twice-yearly meetings. Their decisions often impact WTI Oil prices. When OPEC decides to lower quotas, it can tighten supply, pushing up Oil prices. When OPEC increases production, it has the opposite effect. OPEC+ refers to an expanded group that includes ten extra non-OPEC members, the most notable of which is Russia.
Artigos Recomendados


