


Crypto Today: Bitcoin, Ethereum, XRP edge higher despite capital outflows via ETFs
- Bitcoin pares losses as the price lifts above $84,000, signaling a solid technical structure despite ETF outflows.
- Ethereum reaffirms neutral-to-bullish momentum, reclaiming the critical $2,500 support level despite ongoing capital outflows.
- XRP is on the verge of a key supply-range breakout, defined by the 50-day and 100-day EMAs.
Cryptocurrency prices are broadly recovering on Tuesday, as bulls stage a comeback. Bitcoin (BTC) leads the bullish return, rising above $84,000 ahead of the United States (US) Consumer Price Index (CPI) report on Wednesday.
Altcoins, including Ethereum (ETH) and Ripple (XRP), appear neutral to bullish, aligning with easing headwinds across the crypto market. ETH has reclaimed $2,500 as short-term support while XRP closes in on the structural $1.40 supply area.
Institutions withhold support ahead of US CPI
The upcoming US CPI report continues to shift market sentiment as investors reassess their risk exposure. This outlook, reflected in the Fear & Greed Index falling to 57 in the Greed territory on Tuesday, from 69 the day before, undermines appetite for related digital asset investment products.
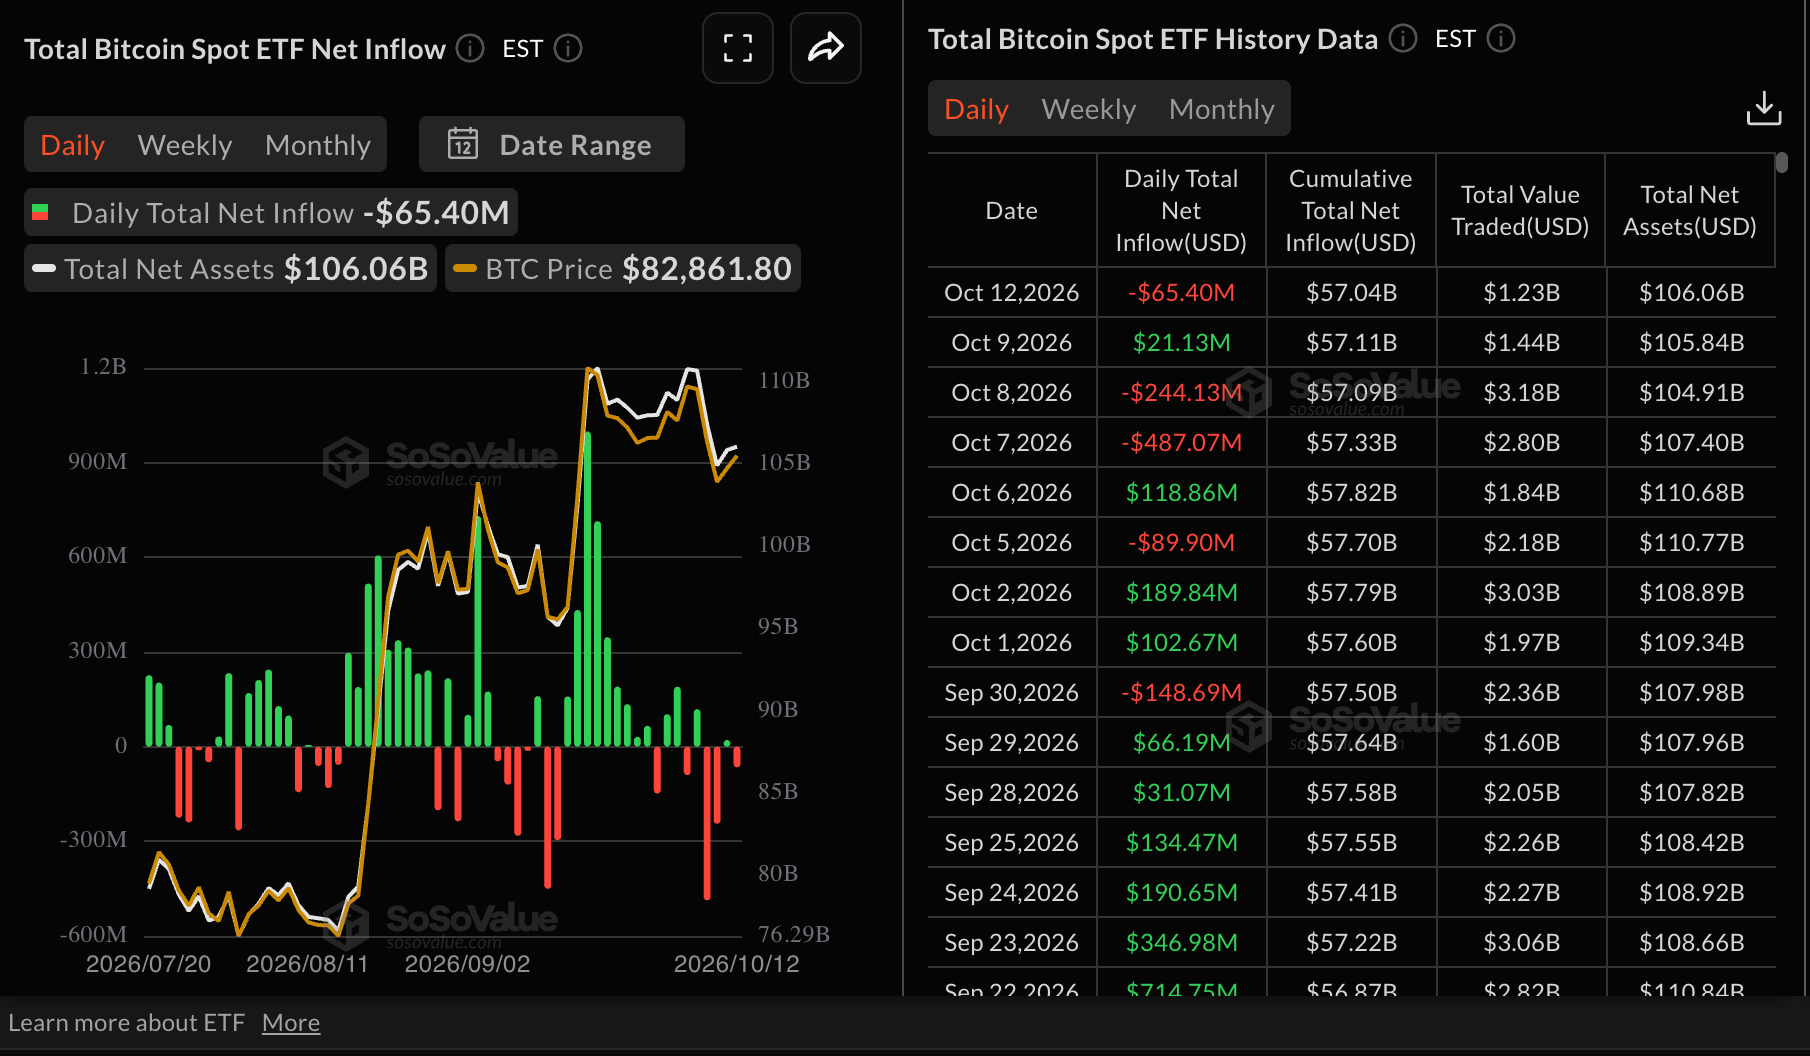
Bitcoin spot Exchange-Traded Funds (ETFs) recorded $65 million in outflows on Monday after minor inflows of $21 million last Friday. US-listed BTC ETFs cumulatively posted $681 million in outflows last week, indicating that macroeconomic uncertainty is weighing on demand.
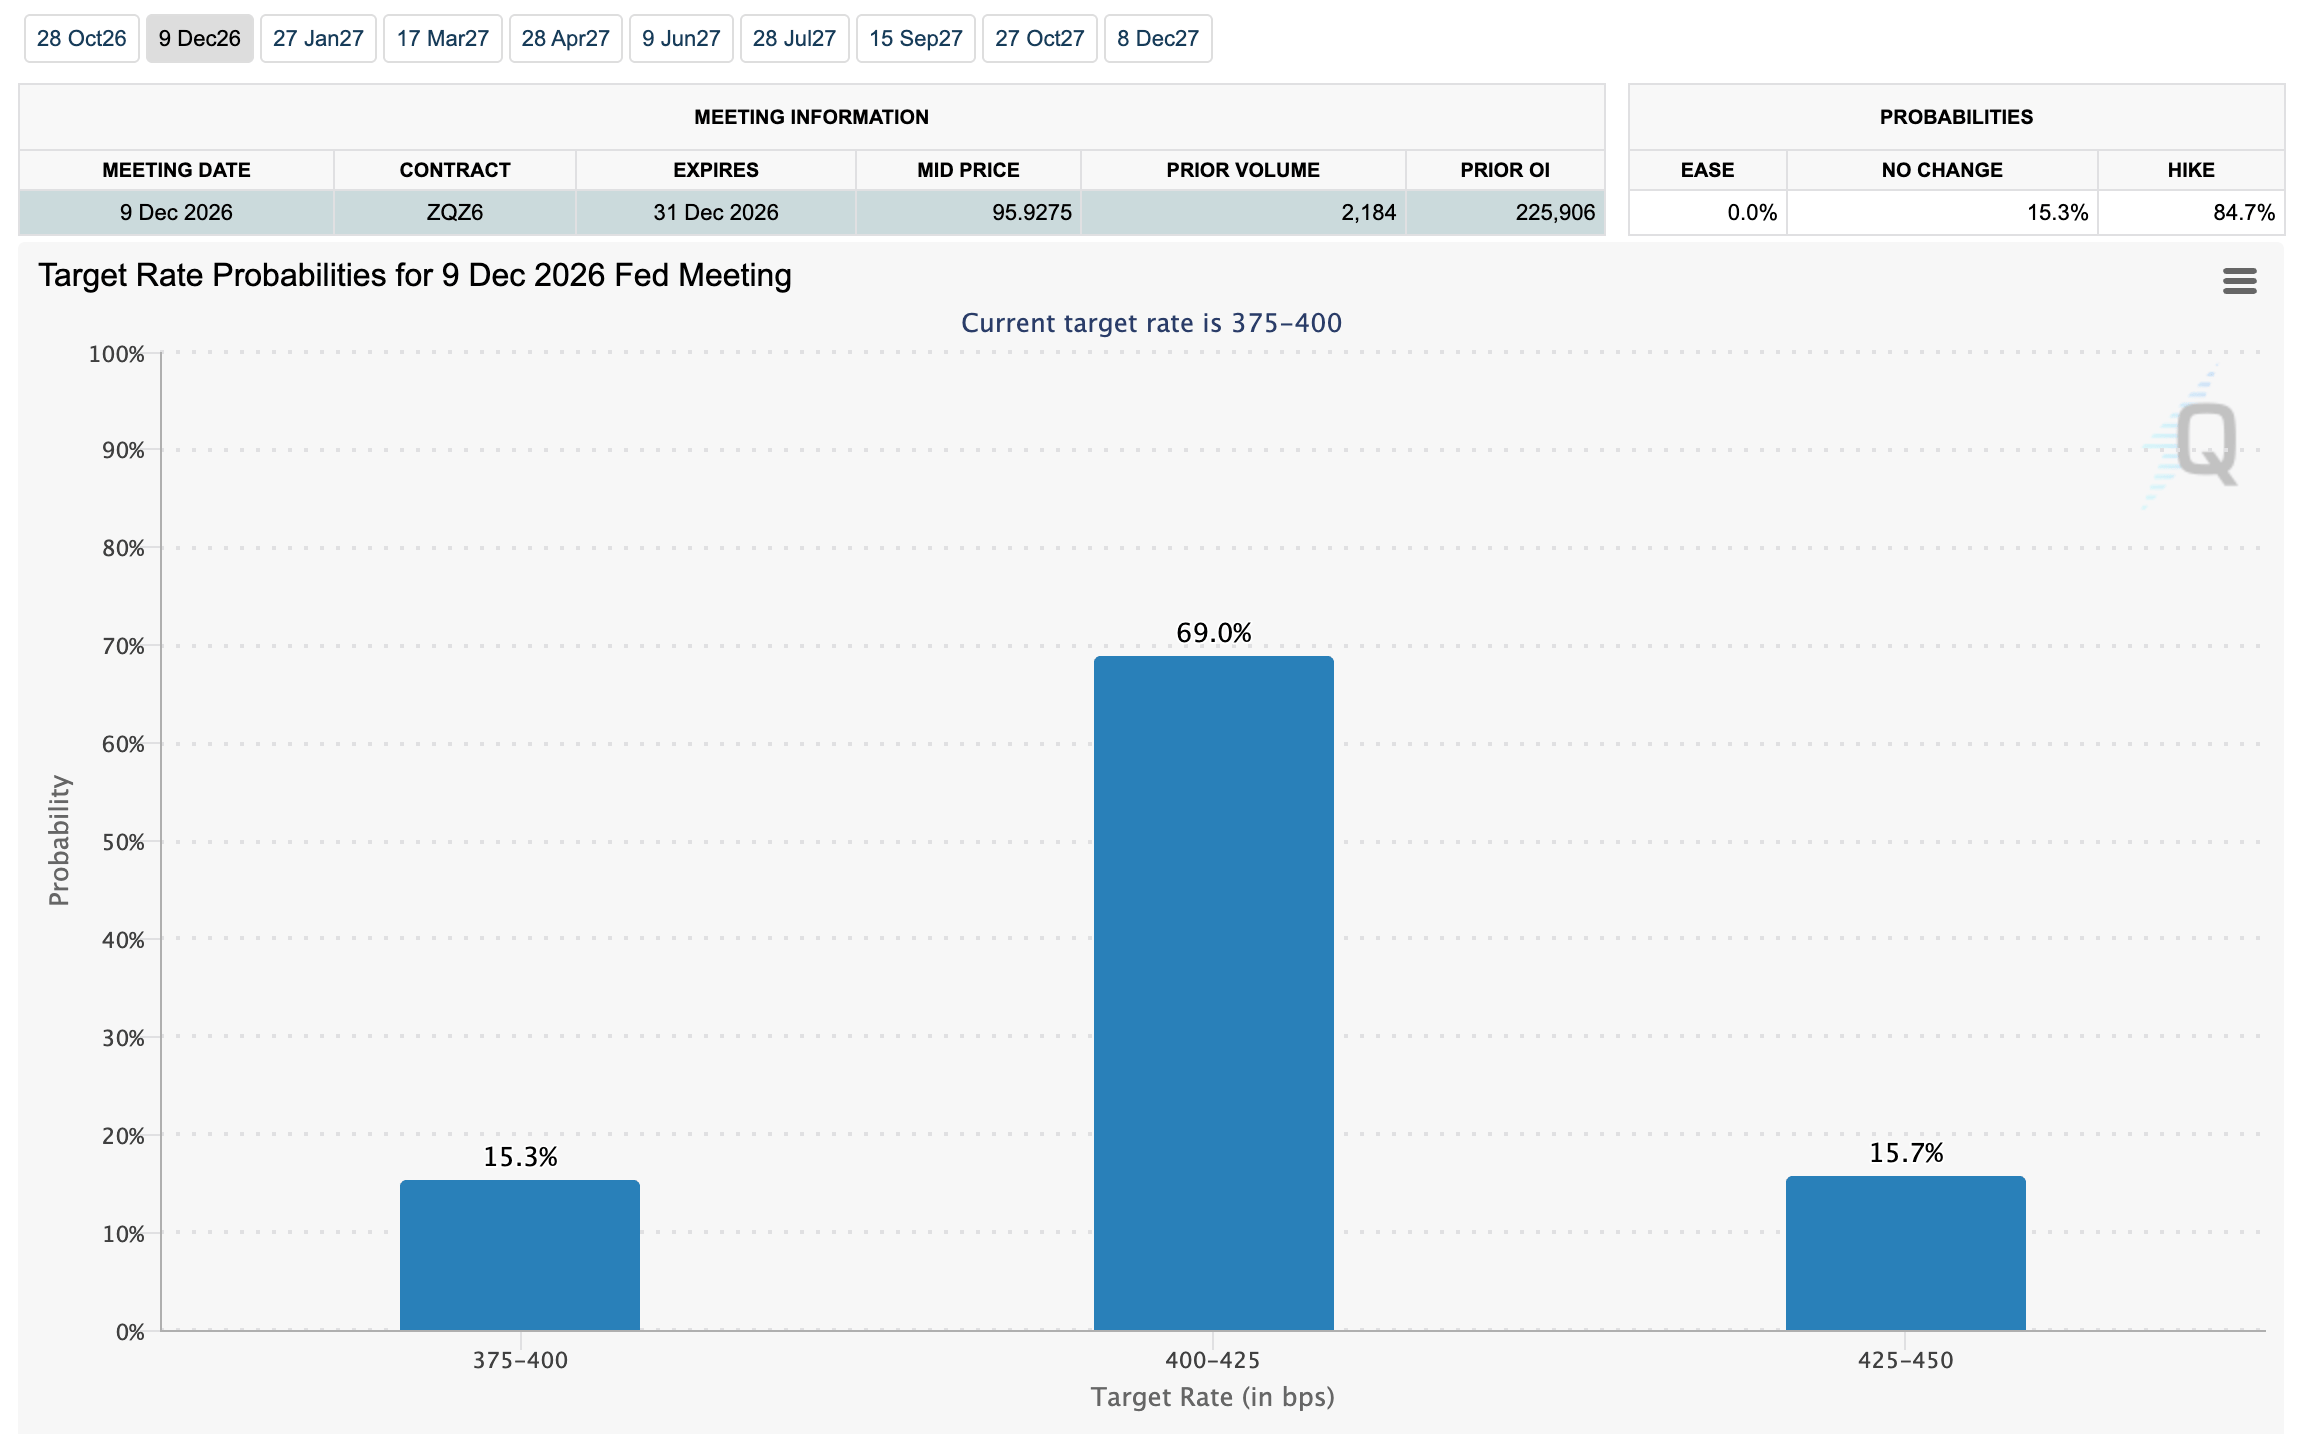
The CPI is an inflation gauge the Federal Reserve (Fed) uses alongside other economic indicators to shape monetary policy direction. A softer-than-expected reading would reinforce the odds of the Fed holding interest rates in the 3.5-4.00% range in October. According to the CME’s FedWatch tool, market participants are broadly pricing in a higher probability of at least one more rate cut before year-end.
“A softer inflation reading could support the opposite view by reinforcing expectations that financing conditions may gradually become more accommodative,” Maksym Sakharov, Co-founder and Group CEO of WeFi.co, said via email, adding, “the market’s response will depend less on the headline CPI figure than on how it reshapes expectations for the cost of capital.”
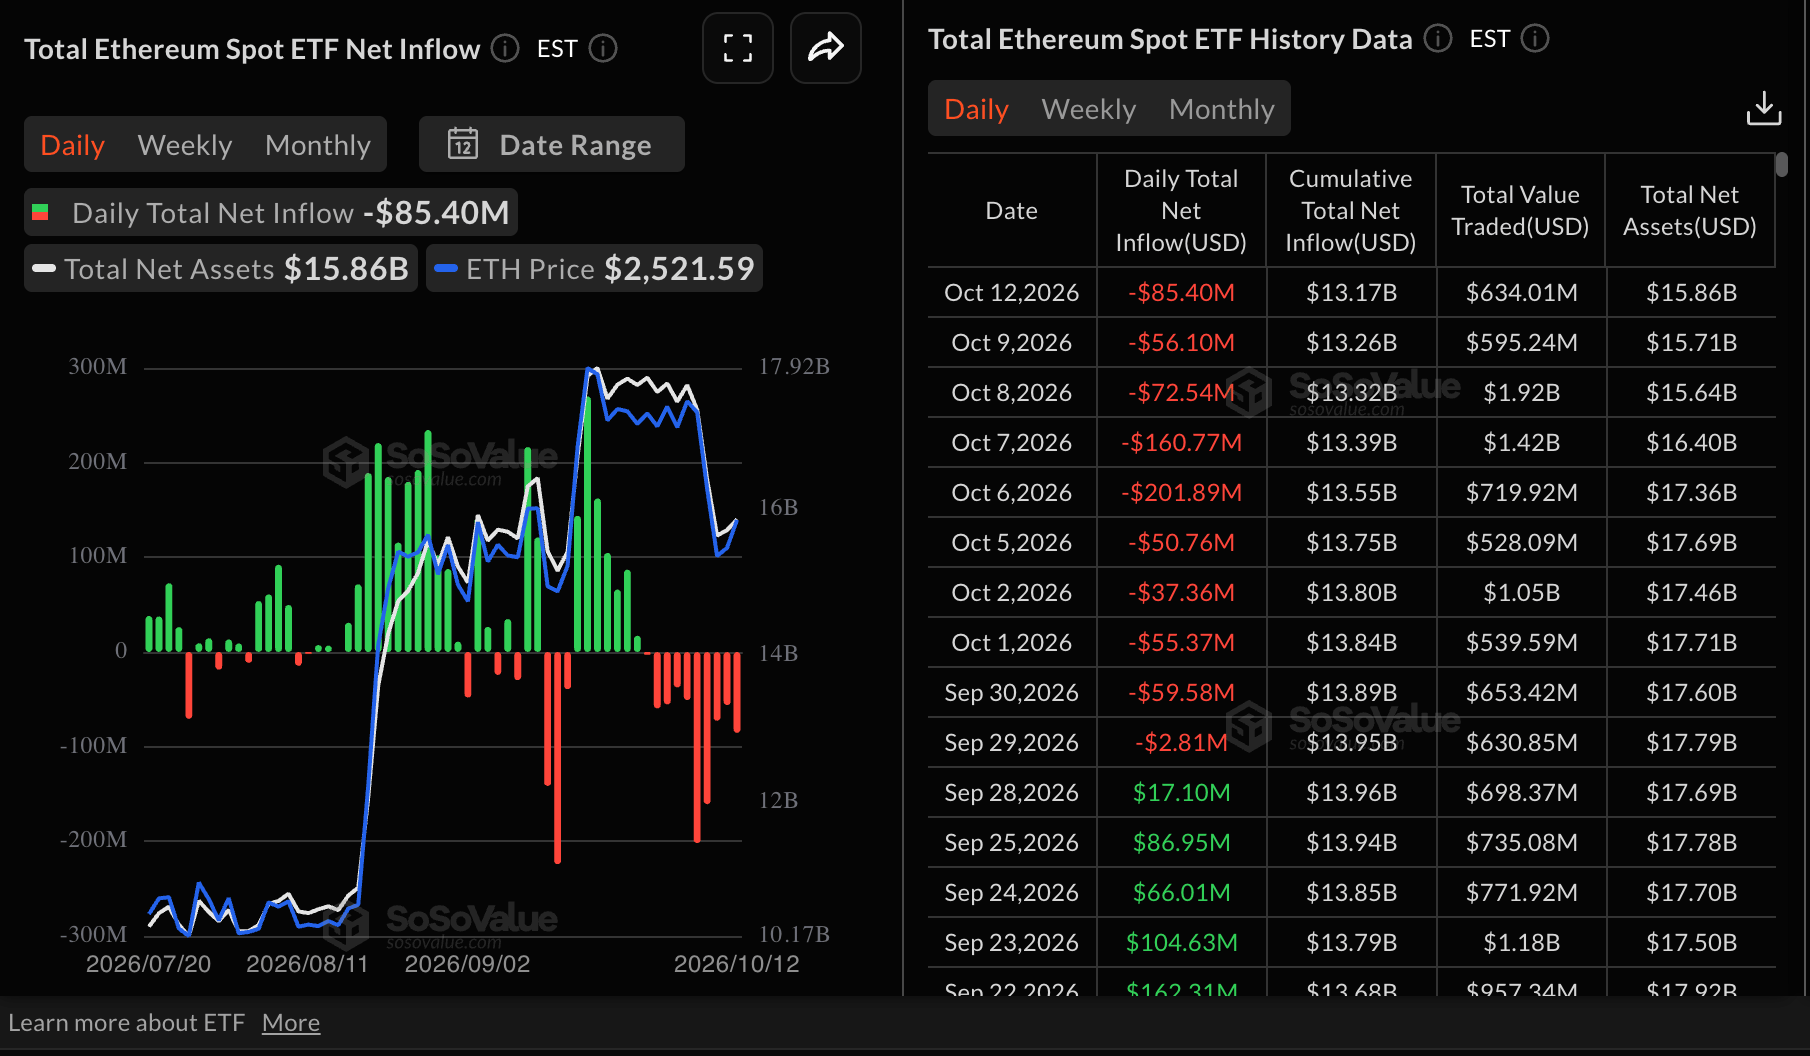
Ethereum ETFs are facing persistent outflows, with $85 million in outflows on Monday, marking a ten-day bearish streak. Last week’s drawings surged to $542 million through Friday, undermining risk-on sentiment. If this trend holds, it may weaken Ethereum’s ability to absorb headwinds and extend the recovery toward key supply zones at $2,600 and $2,800, respectively.
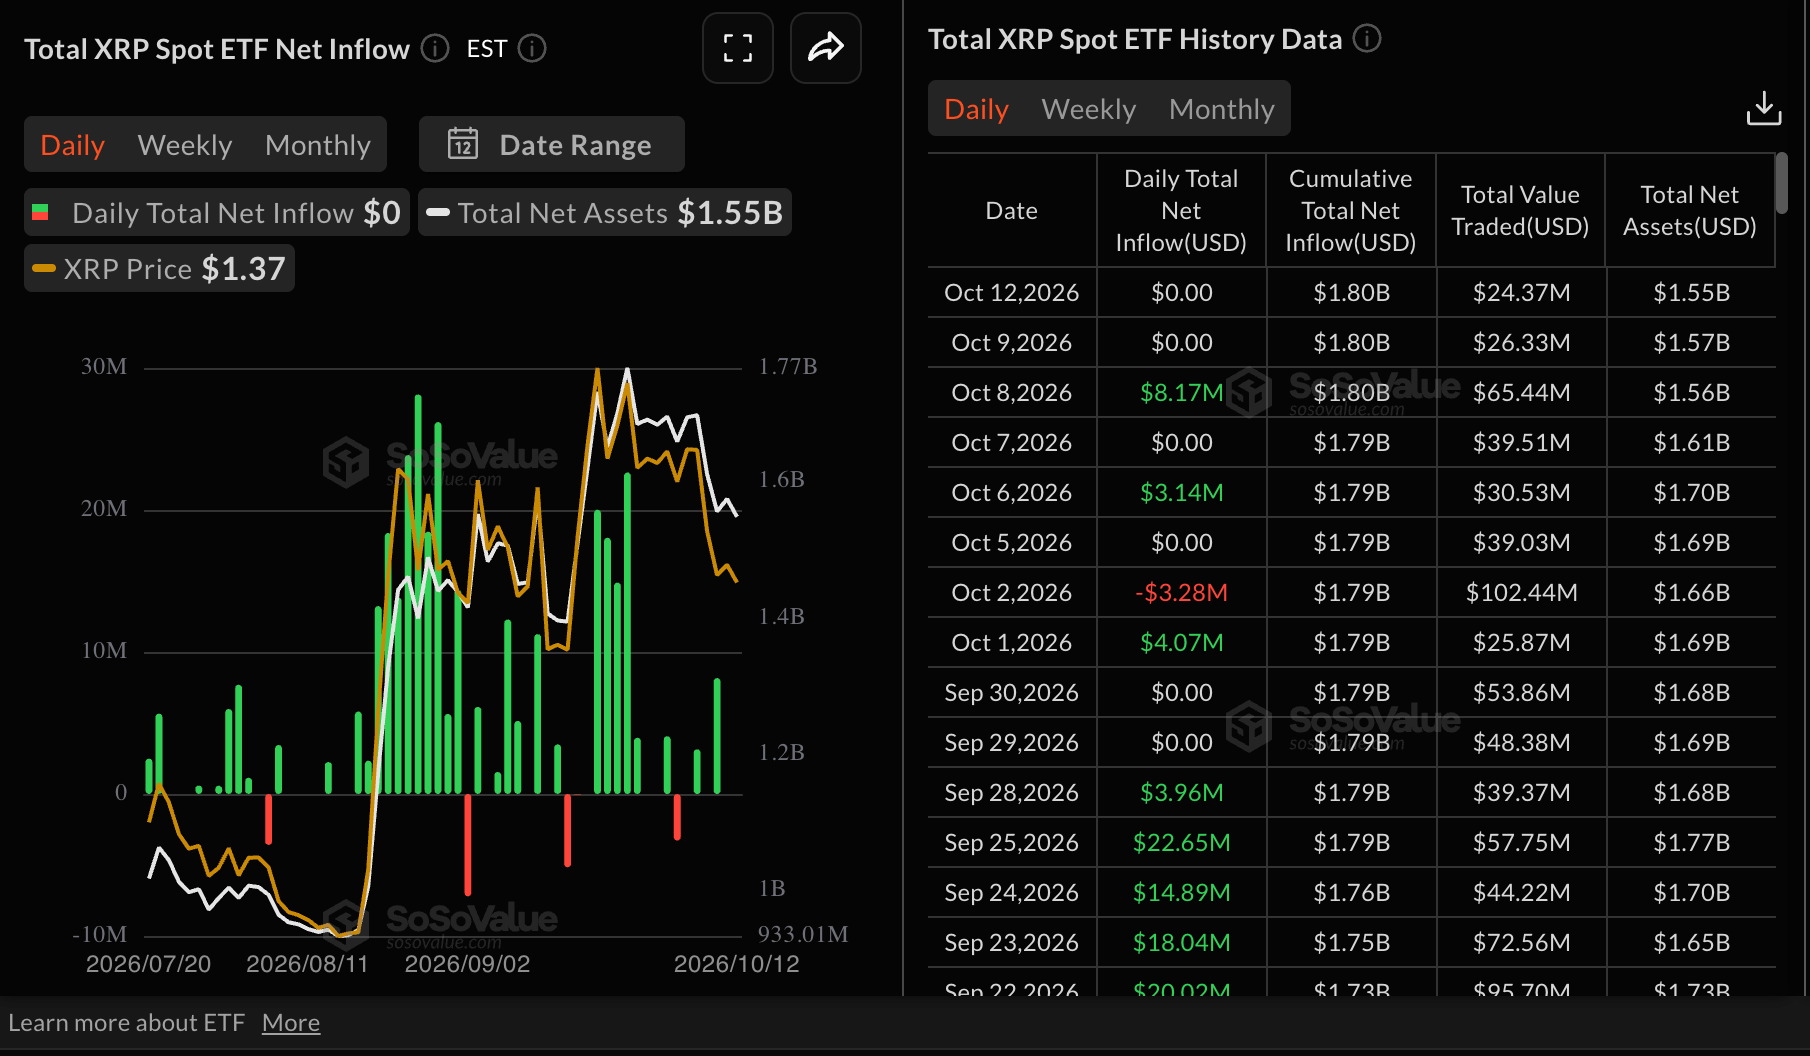
As for XRP, investor interest has taken a backseat, given that activity has stayed muted for two consecutive days. The last inflows came in at $8 million last Thursday, suggesting that investors could be deliberately reassessing their risk exposure. Nonetheless, cumulative inflows are positive at $1.8 billion, while net assets under management average $1.55 billion.
“As that trend continues, macroeconomic expectations are likely to have a greater influence on short-term price movements than crypto-specific narratives alone,” Sakharov added.
Technical analysis: BTC bulls stage a comeback
Bitcoin is gaining ground above $84,000 as bulls try to regain control after Monday's correction to $81,700. The Crypto King holds a bullish near-term bias as price remains comfortably above the 50-day Exponential Moving Average (EMA) at $80,276 and the SuperTrend line at $79,664, both reinforcing a supportive underlying structure.
The Relative Strength Index (RSI) around 54 leans slightly positive without reaching overbought territory; however, the Moving Average Convergence Divergence (MACD) stays below zero, suggesting that bullish momentum is constructive but not yet impulsive.
-1791881707360.png)
Immediate support lies at the current pivot zone near $84,008, with the 50-day EMA at $80,276 forming the next key floor, followed by a broader demand cluster around the SuperTrend level at $79,664. Deeper setbacks would expose the 100-day EMA at $76,520 and then the 200-day EMA at $75,631, where buyers are likely to defend the prevailing uptrend as long as daily closes remain above these longer-term averages.
Altcoins technical analysis: Ethereum and XRP recover as bulls tighten grip
Ethereum trades around $2,532, rising from weekly lows around $2,400. The smart contract token sits above the 50-day, 100-day and 200-day EMA, respectively, which collectively suggest a constructive near-term bullish bias with the trend supported by underlying demand.
However, the Parabolic SAR at $2,729 sits overhead as the next resistance trigger, while the MACD remains below zero with a negative reading and the RSI around 46, hinting that bullish momentum is modest rather than impulsive.
-1791882740379.png)
Initial support lies at the day’s open level near $2,532, followed by the 50-day EMA at $2,503, with deeper downside protection coming from the 100-day EMA at $2,353 and the 200-day EMA near $2,306 if sellers gain traction. On the topside, a daily close above the Parabolic SAR resistance at $2,729 would open the way for a stronger recovery phase, while failure to clear this level could keep ETH consolidating above the clustered EMAs and expose a corrective pullback toward the $2,400 area.
XRP, meanwhile, edges higher toward $1.40 as bulls tighten their grip in an attempt to take back control of the trend. Despite the price increase, the remittance token remains bearish in the near term, as price sits below the 50-day and 200-day EMAs at $1.40 and $1.38, respectively, while holding above the 100-day EMA at $1.34.
The MACD remains below zero, and the RSI at 43 stays under the midline, suggesting downside momentum still outweighs bullish attempts despite recent stabilization above the 100-day EMA.
-1791882767997.png)
Immediate resistance lies at the 200-day EMA at $1.38, followed by the 50-day EMA at $1.40, with the Parabolic SAR barrier higher up near $1.55 reinforcing a broader cap on the advance. On the downside, the 100-day EMA at $1.34 stands as the key underlying support. A daily close below this level would likely open the door to a deeper correction, while holding above it keeps the pair in a consolidative phase beneath the clustered moving-average resistance.
(The technical analysis of this story was written with the help of an AI tool. Know more.)
Crypto ETF FAQs
An Exchange-Traded Fund (ETF) is an investment vehicle or an index that tracks the price of an underlying asset. ETFs can not only track a single asset, but a group of assets and sectors. For example, a Bitcoin ETF tracks Bitcoin’s price. ETF is a tool used by investors to gain exposure to a certain asset.
Yes. The first Bitcoin futures ETF in the US was approved by the US Securities & Exchange Commission in October 2021. A total of seven Bitcoin futures ETFs have been approved, with more than 20 still waiting for the regulator’s permission. The SEC says that the cryptocurrency industry is new and subject to manipulation, which is why it has been delaying crypto-related futures ETFs for the last few years.
Yes. The SEC approved in January 2024 the listing and trading of several Bitcoin spot Exchange-Traded Funds, opening the door to institutional capital and mainstream investors to trade the main crypto currency. The decision was hailed by the industry as a game changer.
The main advantage of crypto ETFs is the possibility of gaining exposure to a cryptocurrency without ownership, reducing the risk and cost of holding the asset. Other pros are a lower learning curve and higher security for investors since ETFs take charge of securing the underlying asset holdings. As for the main drawbacks, the main one is that as an investor you can’t have direct ownership of the asset, or, as they say in crypto, “not your keys, not your coins.” Other disadvantages are higher costs associated with holding crypto since ETFs charge fees for active management. Finally, even though investing in ETFs reduces the risk of holding an asset, price swings in the underlying cryptocurrency are likely to be reflected in the investment vehicle too.
Artigos Recomendados


