

Pi Network Price Forecast: PI tests 50-day EMA breakout as market hype builds

Fonte Fxstreet
  • Pi Network ticks higher on Wednesday, hovering above $0.0910 after a bullish close the previous day.
  • A steady increase in PI futures Open Interest points to firm derivatives demand as the broader cryptocurrency market maintains a risk-on sentiment.
  • The technical outlook for PI shows a near-term upside bias, with bulls testing the 50-day EMA breakout.

Pi Network (PI) edges above $0.0910 at press time on Wednesday, advancing the mild recovery from the previous day. The PI futures Open Interest shows a positional buildup, possibly supporting a rebound amid broader market risk-on sentiment. The technical outlook for PI indicates a mild bullish bias as the near-term recovery tests the 50-day Exponential Moving Average (EMA) breakout at $0.0917.

Retail speculations hold firm amid broader market risk-on sentiment

Pi Network builds retail strength as investors' risk appetite remains elevated. CoinAnk data shows the PI futures Open Interest (OI) stands at $10.57 million on Wednesday, up from $10.05 million the previous day, suggesting an increase in the notional value of all active contracts. 
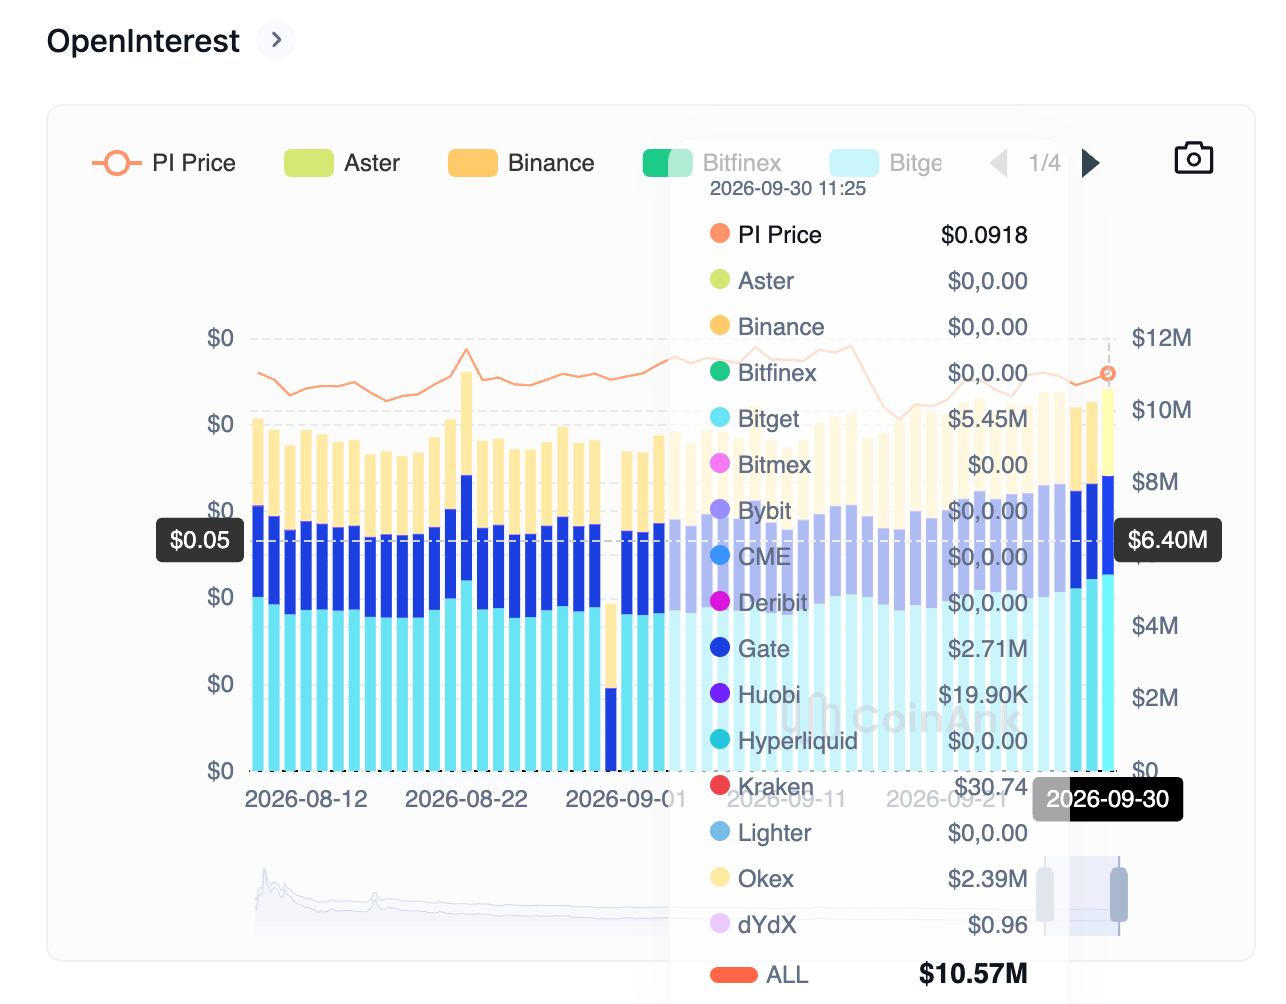
PI token Open Interest chart. Source: CoinAnk

At the same time, CoinMarketCap’s Fear and Greed Index stands at 67, continuing its decline from 74 last week. Still, the indicators suggest elevated risk appetite as it rests well above the upper band of the neutral range at 60.
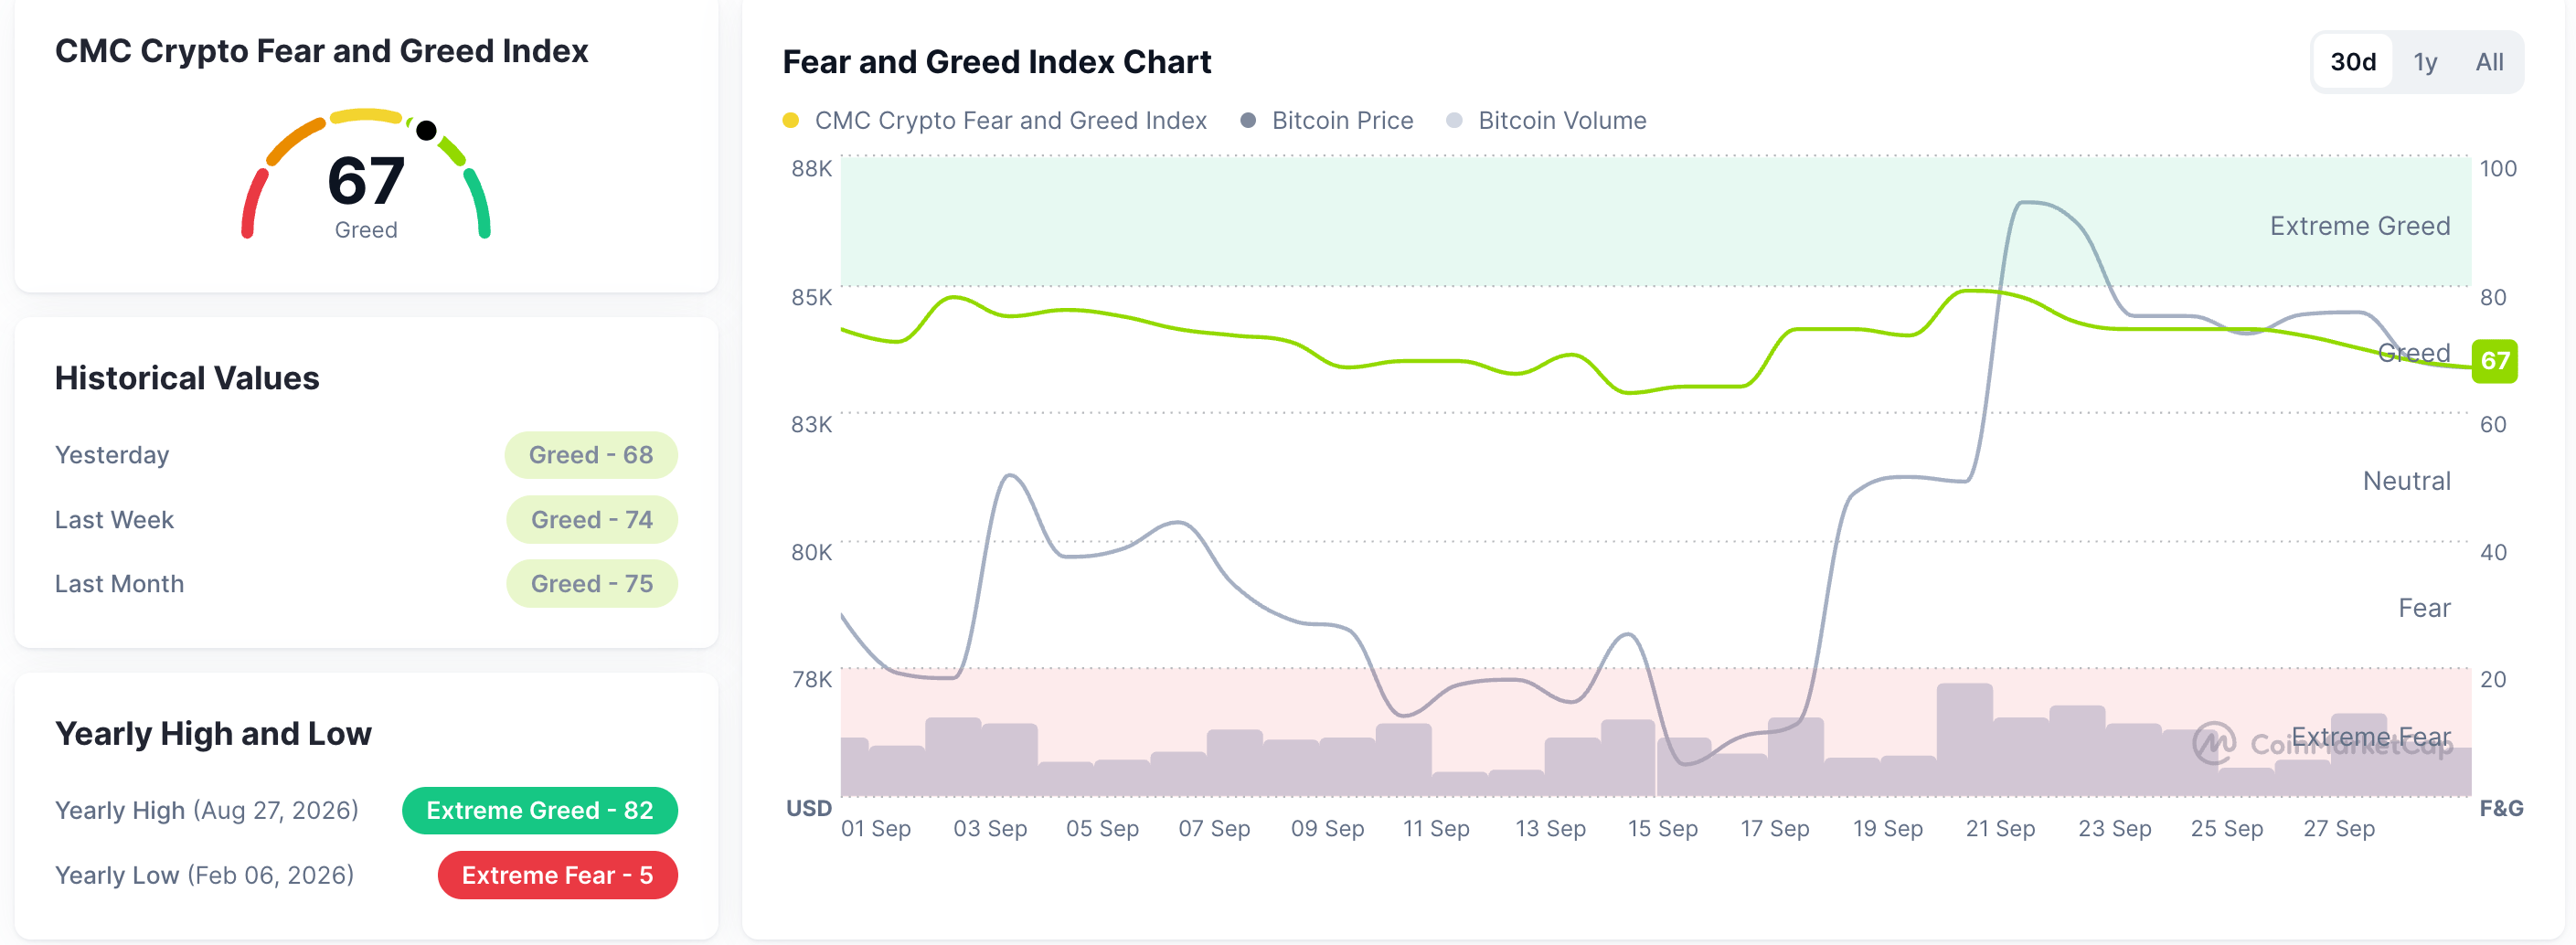
Fear and Greed Index. Source: CoinMarketCap

Technical outlook: Pi Network recovery eyes 50-day EMA breakout

Pi trades at $0.0918 at press time on Wednesday, extending its mild gains from the previous day. Still, the PI token maintains a near-term bearish bias as it tests the breakout of the 50-day EMA at $0.0917 and sits well below the 100- and 200-day EMAs at $0.1002 and $0.1235, respectively.

A confirmed breakout above the 50-day EMA could target the overhead resistance cluster formed by the 50% retracement level of the downswing from $0.1341 to $0.0704 at $0.0990 and the 100-day EMA at $0.1002.

Momentum on the daily chart remains mostly neutral, with the Relative Strength Index (RSI) at 52, rising above the midline, while the Moving Average Convergence Divergence (MACD) remains in the negative territory but holds marginally above its signal line.

Chart Analysis PI/USD (baha Crypto)
PI/USD daily price chart.

Looking down, a potential reversal from the 50-day EMA could test the 23.6% Fibonacci retracement level at $0.0827, reinforced by the July 31 low at $0.0801. Any deeper pullbacks could likely test the all-time low of $0.0704.

(The technical analysis of this story was written with the help of an AI tool. Know more.)

Isenção de responsabilidade: Apenas para fins informativos. O desempenho passado não é indicativo de resultados futuros.
placeholder
Previsão do Preço das Ações da Tesla: As Ações da TSLA Podem Ter um Novo Rally com a Aproximação do Lançamento do Roadster de Nova Geração?A Tesla (TSLA) está prestes a realizar o altamente antecipado lançamento de um novo veículo.A Tesla declarou que a nova geração do Roadster, originalmente prevista para estrear oficialmen
Autor  TradingKey
13 horas atrás
A Tesla (TSLA) está prestes a realizar o altamente antecipado lançamento de um novo veículo.A Tesla declarou que a nova geração do Roadster, originalmente prevista para estrear oficialmen
placeholder
Prévia do Payroll de Setembro nos EUA: Crescimento do Emprego Pode Desacelerar, Como as Ações dos EUA, o Dólar e o Ouro Irão Reagir? Na sexta-feira, 2 de outubro (EDT), os EUA divulgarão seu relatório de empregos não agrícolas (payroll) de setembro, com os mercados focados em saber se o crescimento do emprego conseguir
Autor  TradingKey
13 horas atrás
Na sexta-feira, 2 de outubro (EDT), os EUA divulgarão seu relatório de empregos não agrícolas (payroll) de setembro, com os mercados focados em saber se o crescimento do emprego conseguir
placeholder
Ações do Japão e da Coreia do Sul divergem: Nikkei 225 sobe quase 2%, Kospi cai 0,48% após queda de 18,8% no terceiro trimestreTradingKey - Em 30 de setembro, os mercados de ações do Japão e da Coreia do Sul divergiram, com as ações japonesas se fortalecendo significativamente, enquanto os papéis sul-coreanos registraram leve
Autor  TradingKey
9 Mês 30 Dia Qua
TradingKey - Em 30 de setembro, os mercados de ações do Japão e da Coreia do Sul divergiram, com as ações japonesas se fortalecendo significativamente, enquanto os papéis sul-coreanos registraram leve
placeholder
Previsão do Preço do Ouro: PCE de Agosto dos EUA Iminente, o Preço do Ouro Vai Subir ou Cair no Curto Prazo?TradingKey - Na sessão europeia de 30 de setembro, os preços do ouro (XAUUSD) continuaram a se recuperar após uma forte queda no início desta semana, retomando o patamar de US$ 4.200 no intradiário, c
Autor  TradingKey
9 Mês 30 Dia Qua
TradingKey - Na sessão europeia de 30 de setembro, os preços do ouro (XAUUSD) continuaram a se recuperar após uma forte queda no início desta semana, retomando o patamar de US$ 4.200 no intradiário, c
placeholder
Previsão do Preço do Ouro: Ouro despenca para a mínima de sete semanas, o suporte de US$ 4.100 vai resistir?TradingKey - O ouro à vista (XAUUSD) despencou 4% na segunda-feira, fechando a US$ 4.114,93 por onça-troy, após atingir a mínima intradia de US$ 4.110,80, seu menor nível desde 5 de agosto. No início
Autor  TradingKey
9 Mês 29 Dia Ter
TradingKey - O ouro à vista (XAUUSD) despencou 4% na segunda-feira, fechando a US$ 4.114,93 por onça-troy, após atingir a mínima intradia de US$ 4.110,80, seu menor nível desde 5 de agosto. No início
goTop
quote