


Ripple and Stellar outlook: Facing pullback amid broader uptrend
- XRP steadies near $1.509 on Thursday after declining 4.56% the previous day.
- XLM pulls back toward $0.202 after falling 6.52% mid-week; remains within the broader uptrend.
- Robust institutional demand through XRP ETFs and continued network partnerships for Stellar back a constructive outlook for both altcoins.
Ripple (XRP) and Stellar (XLM) faces a healthy correction following their recent strong rallies. XRP trades near $1.509 after falling 4.56% the previous day, while XLM hovers around $0.202 following a 6.52% decline. Despite the short-term pullback, renewed institutional demand for XRP through spot Exchange Traded Funds (ETFs) and continued developments and partnerships across the Stellar network support a constructive outlook for both altcoins.
XRP sees further growth in institutional demand
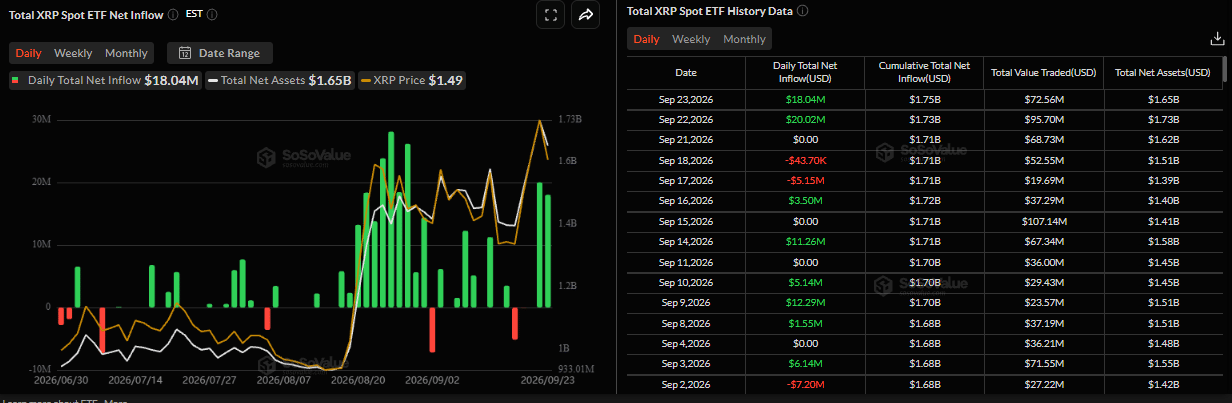
SoSoValue data showed that spot XRP ETFs recorded an inflow of $18.04 million on Wednesday, after a $20.02 million inflow on Tuesday, indicating strong investor demand. If these inflows continue and intensify throughout this week, XRP could extend the ongoing rally in the coming days.
XLM’s growing partnerships
Stellar’s official X account announced on Tuesday that its blockchain is now live on BVNK Finance.
“This integration gives enterprise customers access to the blockchain designed for high-volume, sub-penny digital asset transfers. Cross-border payments, remittances, and treasury management,” said Stellar in its post.
This partnership indicates growing institutional adoption of the Stellar network. In addition, the collaboration could expand access and strengthen the network, supporting a bullish long-term outlook for Stellar and its native token, XLM.
Some signs of caution
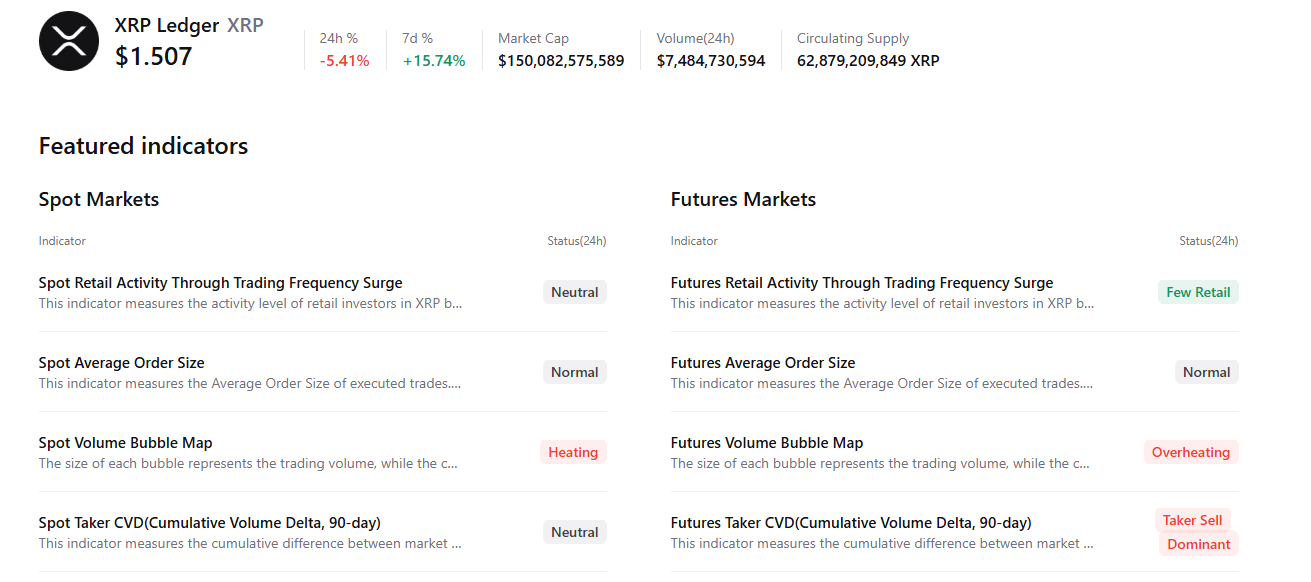
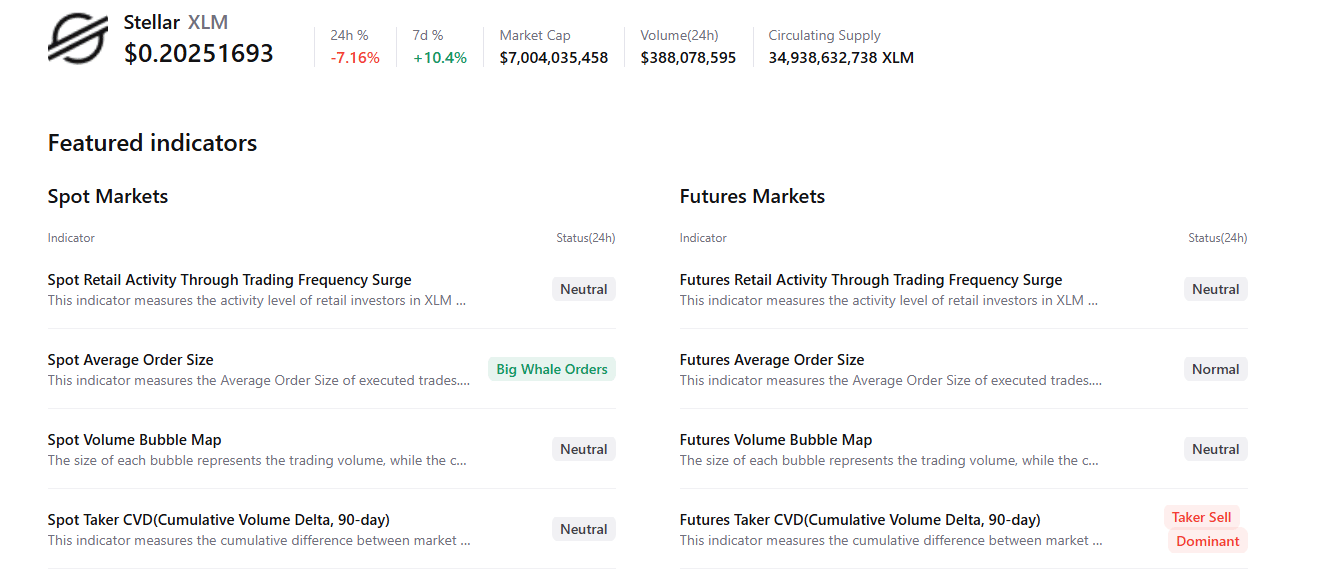
CryptoQuant’s summary data shows cautious signs for XRP and XLM. XRP’s futures markets show sell-side dominance and overheating conditions, with few retail investors actively following the massive price surge. In addition, spot markets show heating conditions while other metrics remain neutral, highlighting a mildly bearish, cautious sentiment bias among XRP traders.
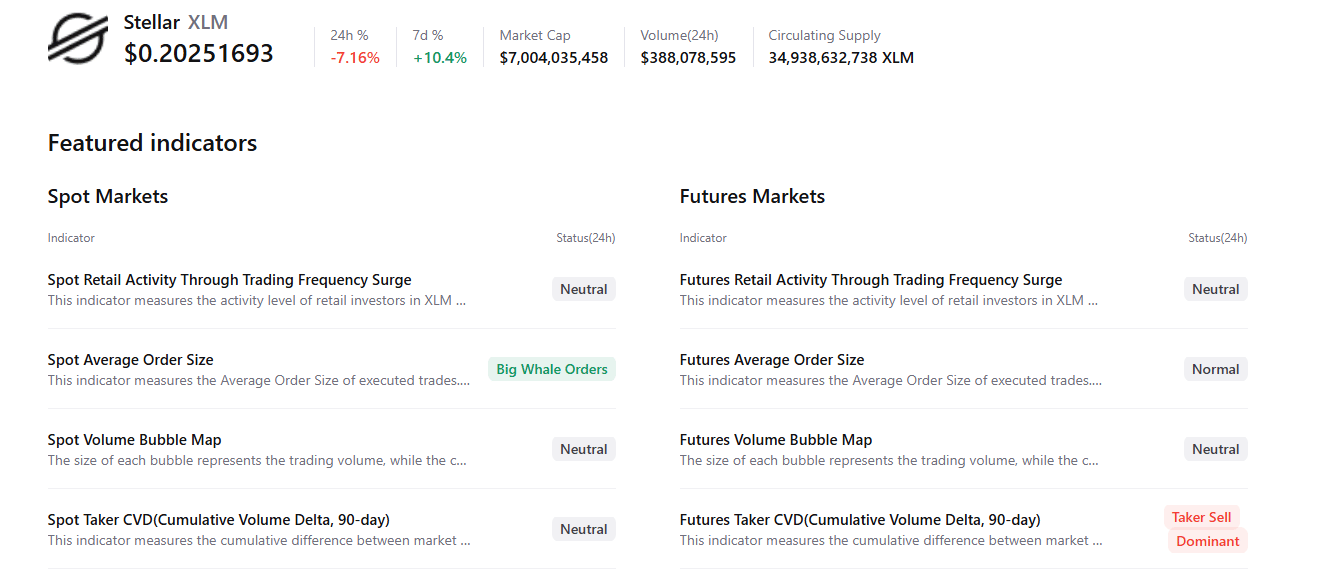
Similarly, XLM futures markets show sell-side dominance, while spot markets show large whale orders; other metrics remain neutral, signaling a cautious sentiment bias among XLM traders.
XRP technical outlook: Bulls remain in control
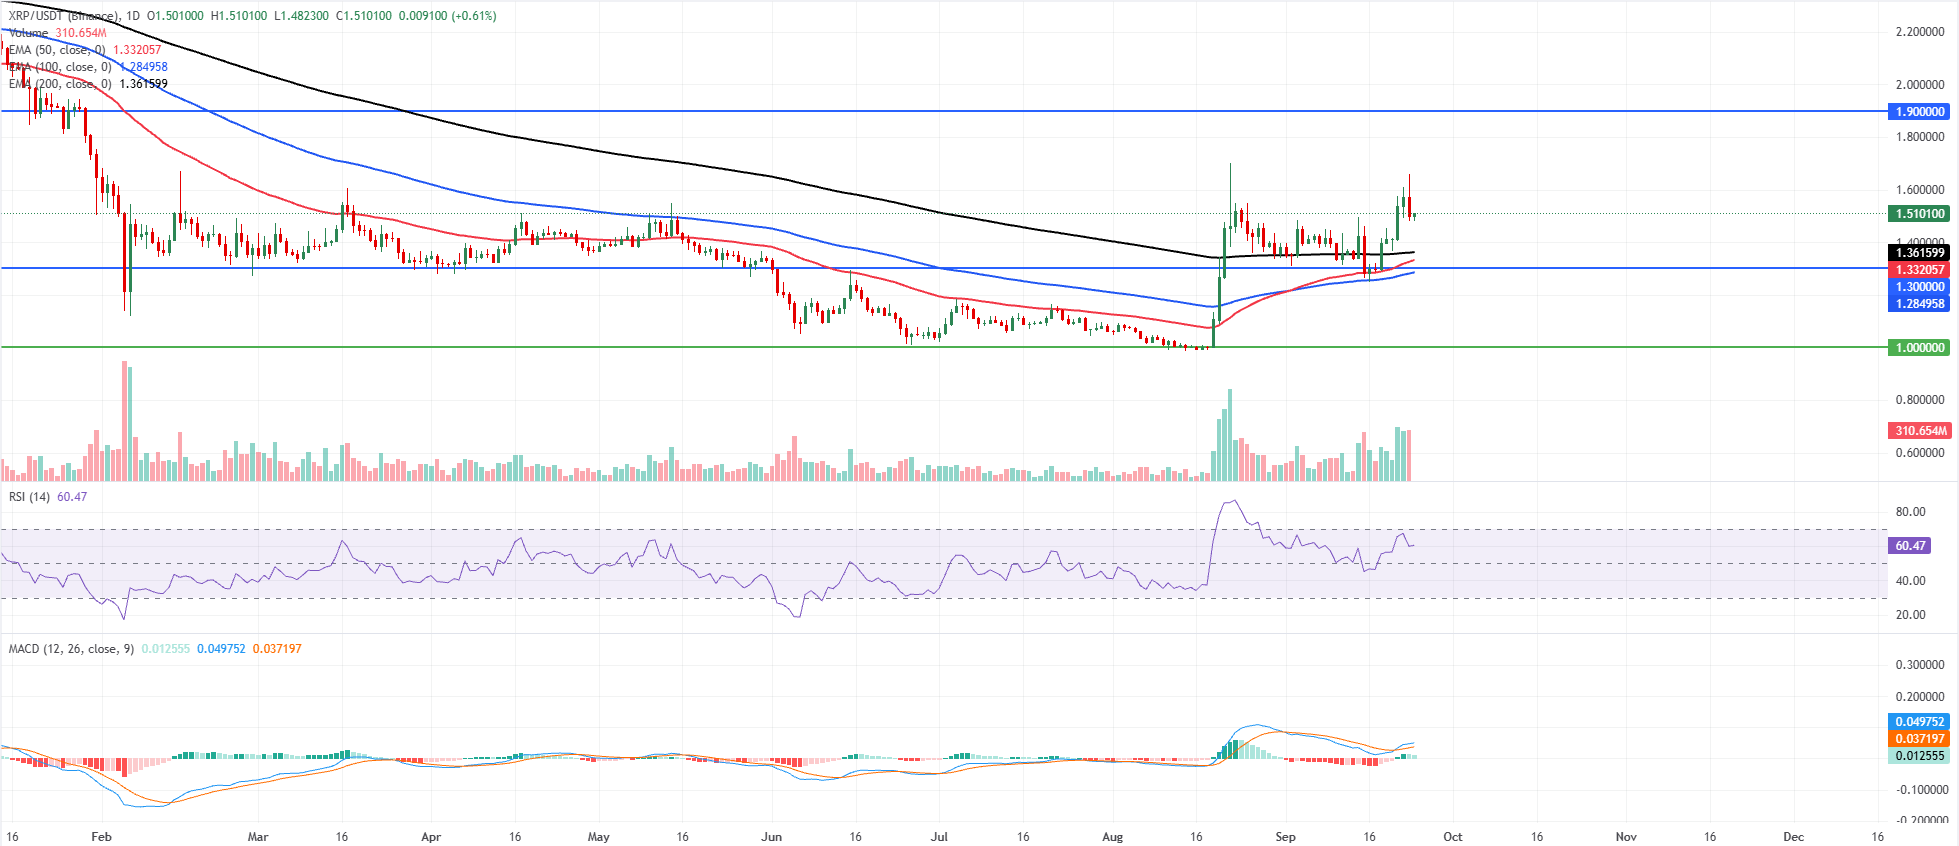
XRP price trades at $1.509 on Thursday, extending a bullish near-term bias as it holds well above the 50-day, 100-day and 200-day Exponential Moving Averages (EMAs), clustered between roughly $1.280 and $1.360.
This positioning suggests underlying demand remains firm after the recent advance, while the Relative Strength Index (RSI) around 60 keeps momentum constructive without signaling overbought conditions. The Moving Average Convergence Divergence (MACD) indicator remains marginally positive, with the MACD line above zero and a modestly positive histogram, reinforcing the view of a still-supportive trend rather than an overextended spike.
On the downside, immediate support is seen at the 200-day EMA near $1.361, followed by the 50-day EMA at $1.332 and the horizontal level at $1.300, which together define a broader demand zone before deeper bids are expected around the 100-day EMA at $1.284 and the structural floor at $1.000.
On the topside, the next notable resistance is the horizontal barrier at $1.900, and a sustained break above this cap would open the way for continued upside. At the same time, failure to overcome it could trigger consolidation back toward the EMA cluster.
XLM technical outlook: Holds above key EMAs
XLM price trades at $0.202 on Thursday, holding comfortably above the 50-day, 100-day, and 200-day EMAs at $0.185, $0.183, and $0.189, respectively, reinforcing a constructive near-term bias.
The RSI around 58 stays in positive territory without being overbought. At the same time, the MACD remains positive with the line above zero, suggesting bullish momentum persists even as the recent advance starts to consolidate.
On the downside, initial support sits at the EMA cluster between the 200-day EMA at $0.189 and the 50-day EMA at $0.185, followed by the 100-day EMA at $0.183, where buyers could try to defend the short-term trend. A deeper pullback would expose the horizontal support level near $0.177, with a more distant structural floor at $0.142, which would come into play only if selling pressure accelerates and the broader bullish context deteriorates.
(The technical analysis of this story was written with the help of an AI tool. Know more.)
Artigos Recomendados


