


Polygon Price Forecast: POL extends rally as bull market discovers steady network growth
- Polygon is up over 4% on Tuesday, adding to its 45% gains from last week.
- On-chain data shows a steady growth in Polygon’s network activity and economic value so far in 2026.
- The technical outlook for PI is bullish, with elevated upside momentum suggesting a trend reversal.
Polygon (POL) advances to a steady recovery above $0.1200 on Tuesday for the fifth consecutive day, sustaining its 45% gains from last week. The Polygon network is witnessing steady growth in transaction activity and real economic value. The technical outlook for POL indicates a bullish bias as price reclaims the $0.1000 psychological barrier and upside momentum.
Polygon’s renewed network strength gains attention
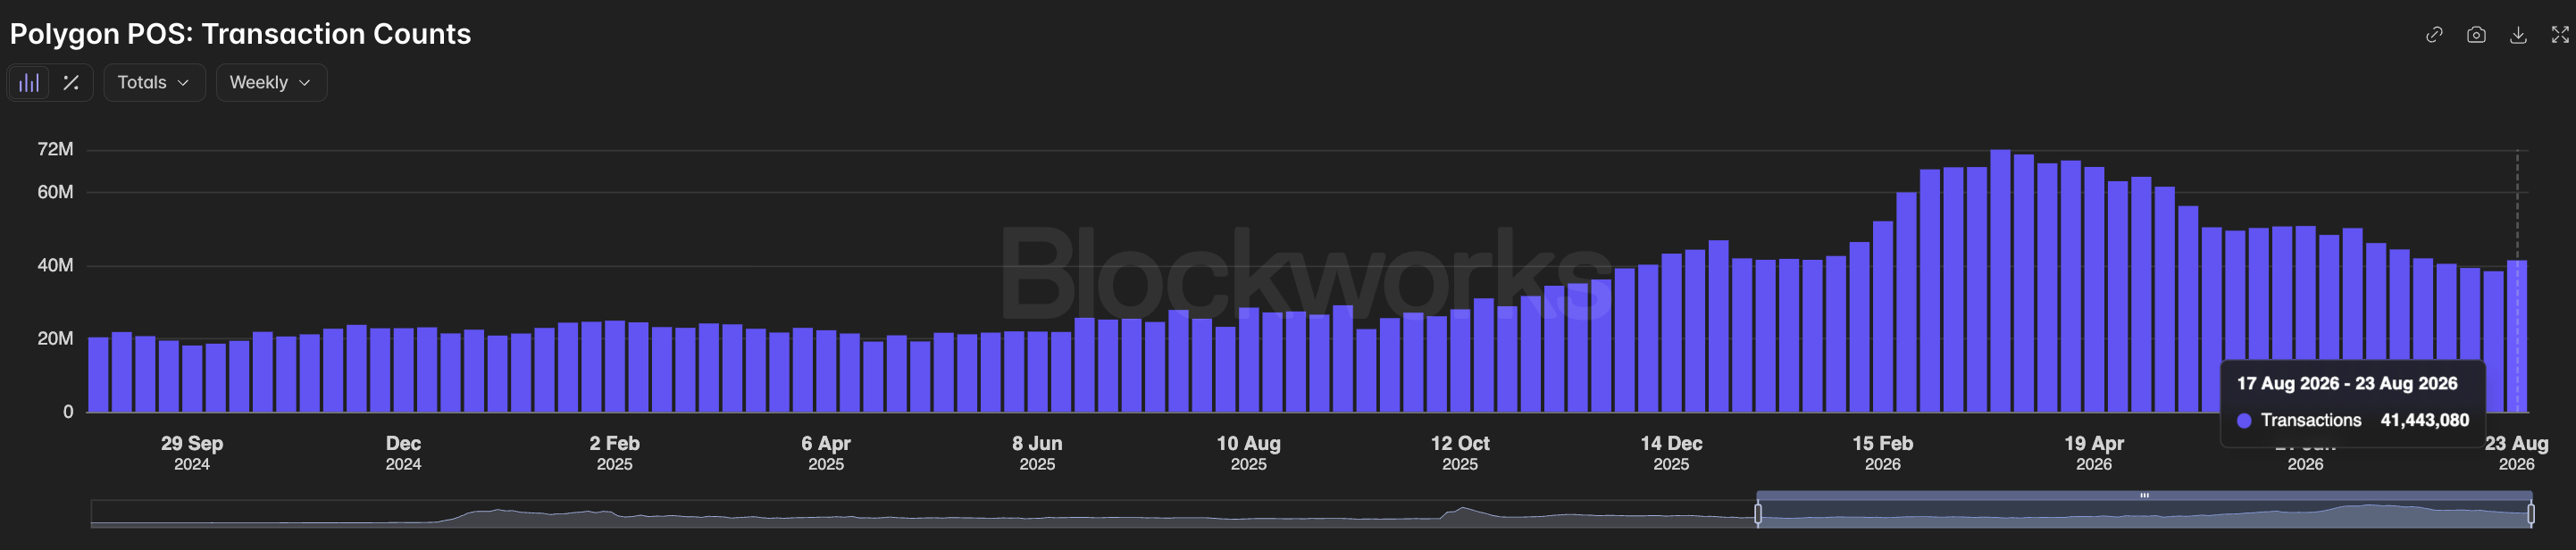
Polygon’s network is heating up with steady growth in transaction activity so far in 2026. Blockworks data shows that Polygon recorded 41.44 million transactions last week, up from 38.45 million the previous week. This suggests a near-term increase in activity, following a drop from 71.27 million transactions in mid-March. Still, weekly activity is well above the late-2025 average of 30 million transactions, reaffirming the renewed activity.
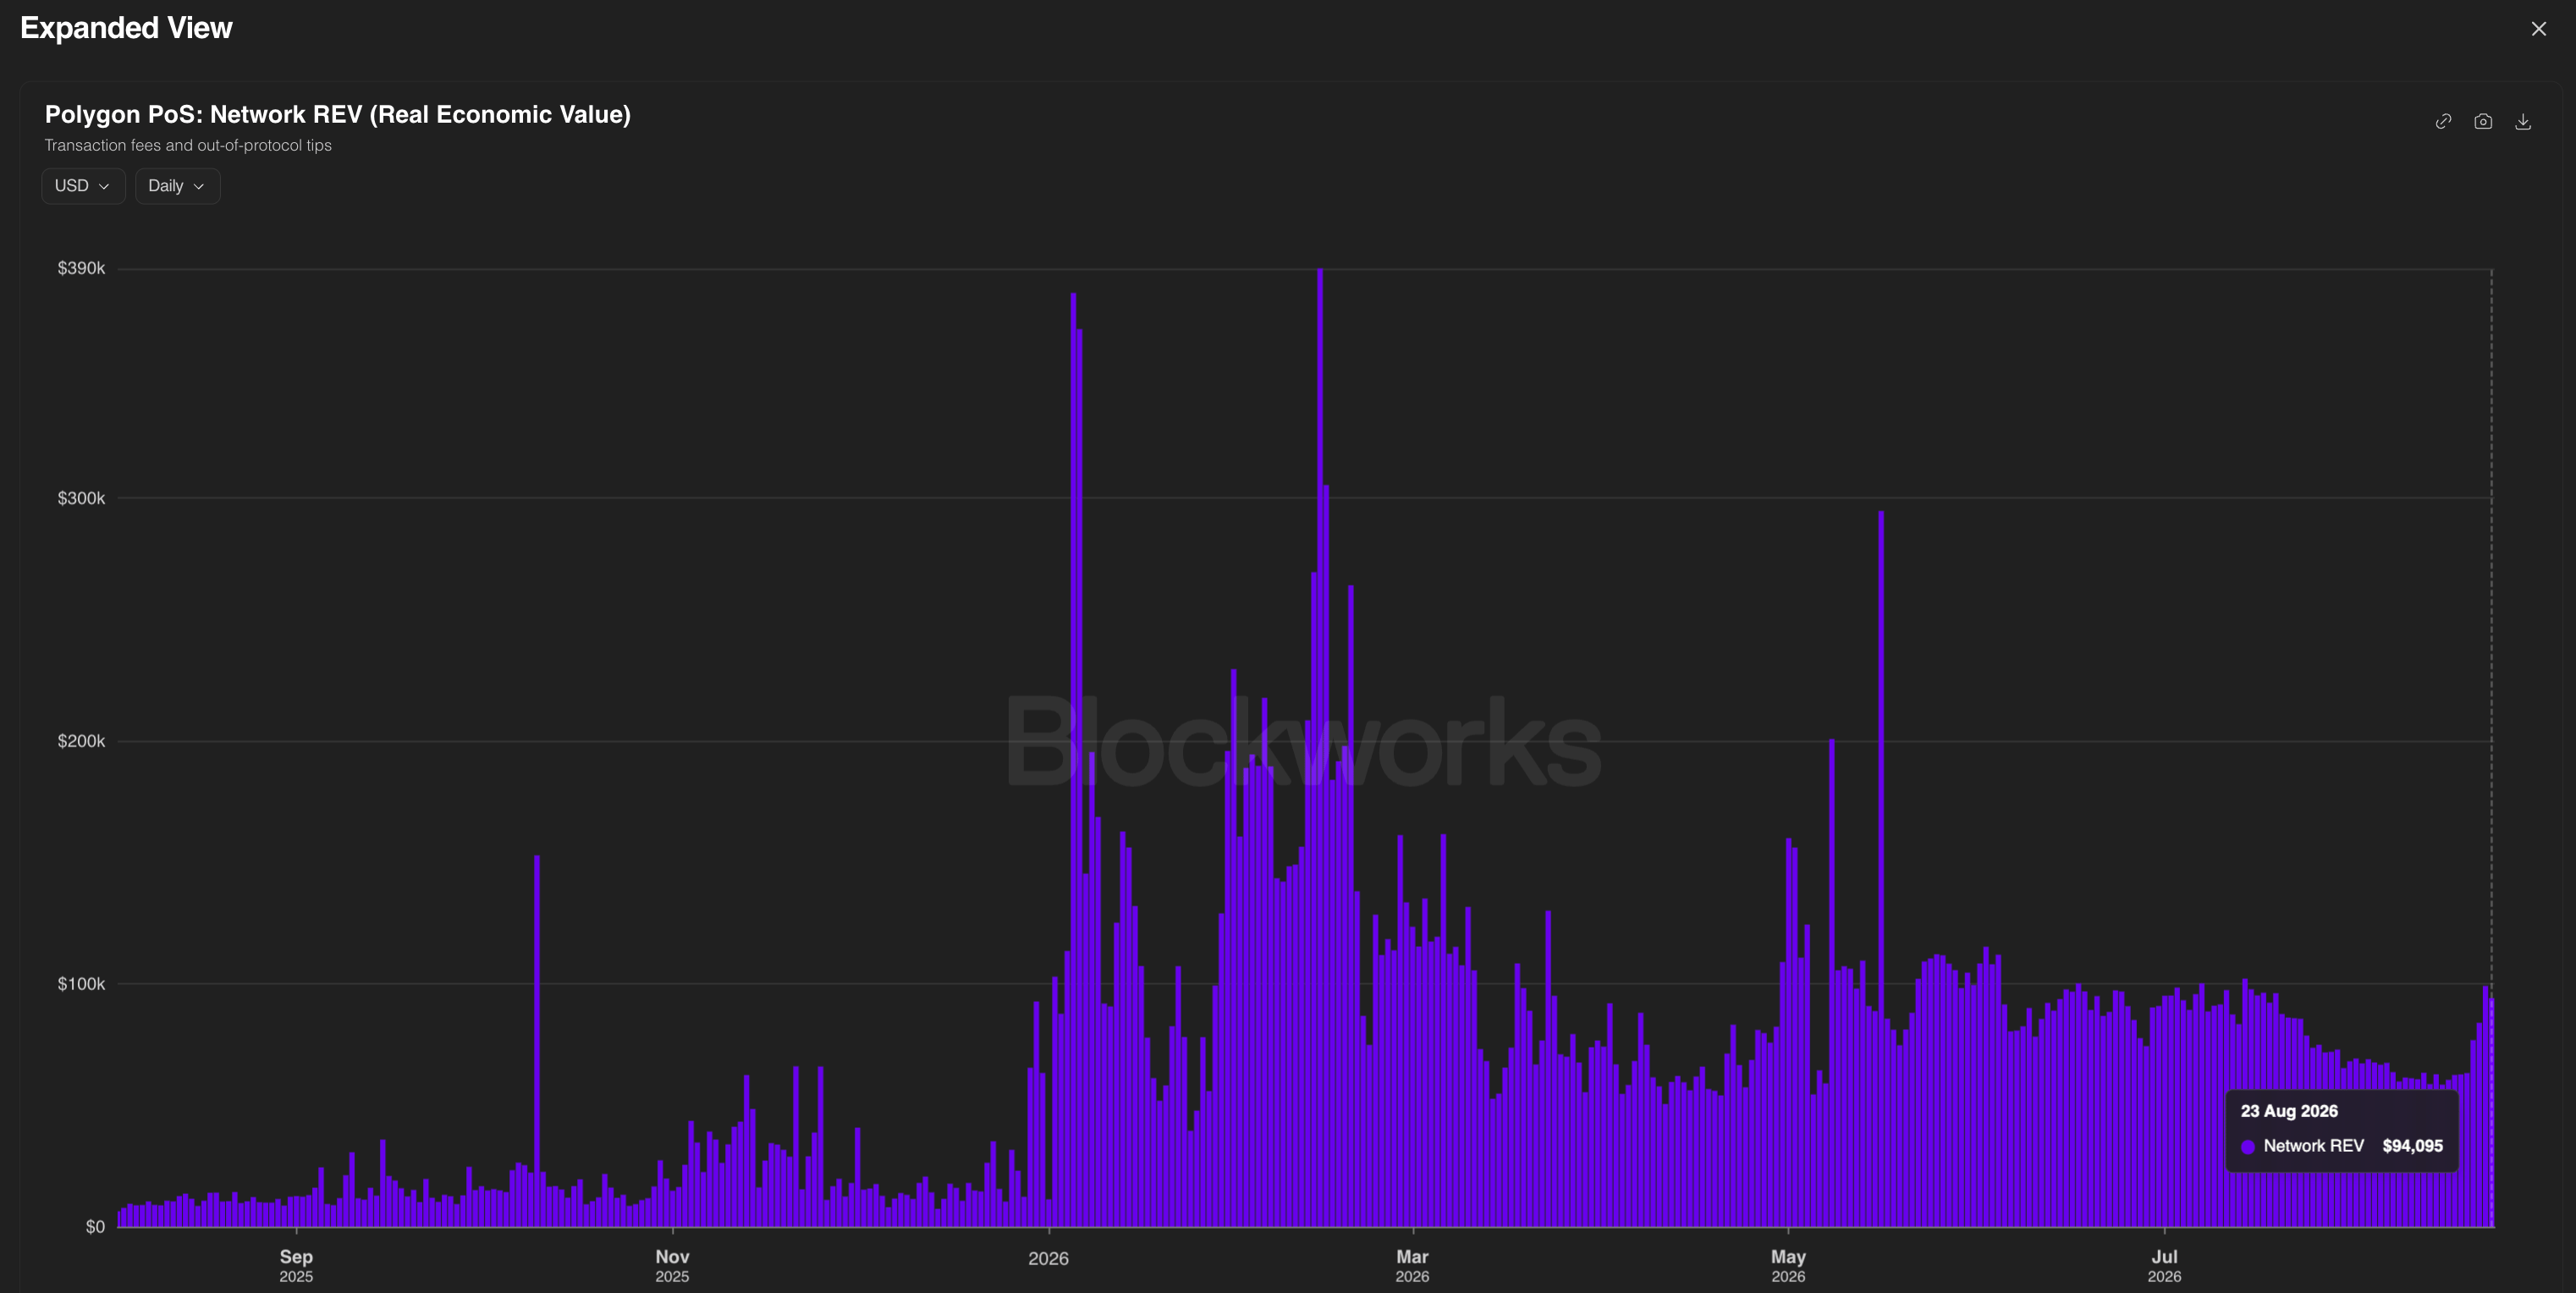
Polygon network’s Real Economic Value (REV) – the total of base transaction fees and priority fee tips – has increased to 6.06 million POL, including 2.44 million POL in priority fees last week, up from 5.65 million POL in the previous week. The weekly chart shows a steady weekly REV of above 5 million POL since early May, reaffirming the rise in network demand.
Technical outlook: How high will POL rise?
Polygon trades above $0.1200 at press time on Tuesday, holding a near-term bullish bias above the 50-day Exponential Moving Average (EMA) at $0.0833 and the 200-day EMA at $0.0967. The POL token shows a sharp vertical rise over the last ten days, surpassing a long-term resistance trendline near $0.0840, which reinforces the constructive structure.
Momentum on the daily chart supports the uptrend, with the Moving Average Convergence Divergence (MACD) scaling higher in the positive territory, with the histogram expanding above the zero line. At the same time, the Relative Strength Index (RSI) hovers in extreme overbought territory near 91, hinting that the risk of a corrective pullback is rising even within this dominant uptrend.
Looking up, the immediate target for POL aligns with the October 11 low at $0.1795, followed by the $0.2000 round figure.
On the downside, initial support emerges at the $0.1000 psychological mark, followed by the 200-day EMA near $0.0967, with the reclaimed trendline around $0.0840 and the 50-day EMA at $0.0833 offering a broader demand band on deeper pullbacks.
(The technical analysis of this story was written with the help of an AI tool. Know more.)
Artigos Recomendados


