

Chainlink Price Forecast: LINK stalls near 200-day EMA following recent gains

Fonte Fxstreet
  • Chainlink price pauses gains near the 200-day EMA at $9.56, with the 61.8% Fibonacci retracement at $9.39 holding strong.
  • Derivatives metrics show early signs of weakness, potentially limiting LINK’s upside.
  • US-listed spot ETFs recorded an inflow of $2.07 million on Monday, marking their largest single-day inflow since July 22.

Chainlink (LINK) faces resistance near $9.56 on Tuesday and pauses gains after rallying over 14% last week. The cautious tone is supported by weakening derivatives metrics, suggesting bullish momentum may be losing steam. However, renewed demand from institutional investors hints LINK could push higher.

Derivatives traders show signs of weakness

Derivatives data shows early signs of weakness and cautious sentiment among traders. CoinGlass’ long-to-short ratio for LINK reads 0.76 on Tuesday, nearing its lowest levels in a month. A ratio below one indicates bearish sentiment, as traders bet asset prices will fall.
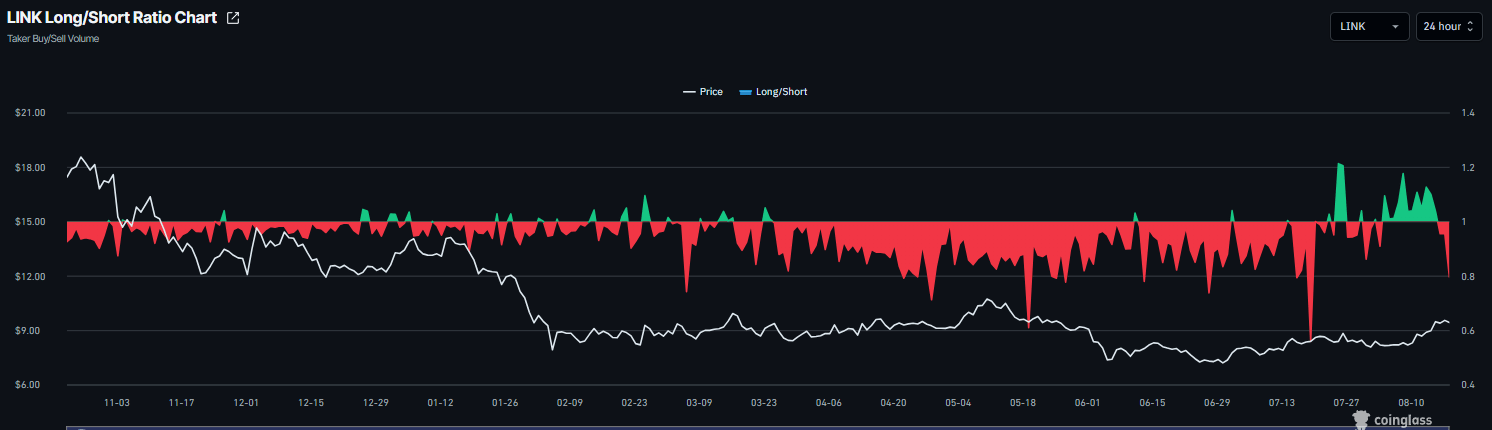
LINK long-to-short ratio chart. Source: Coinglass

In addition, Chainlink’s funding rate flipped negative, reading -0.0050% on Tuesday. This negative rate indicates that short traders are paying longs and reflects a bearish bias.
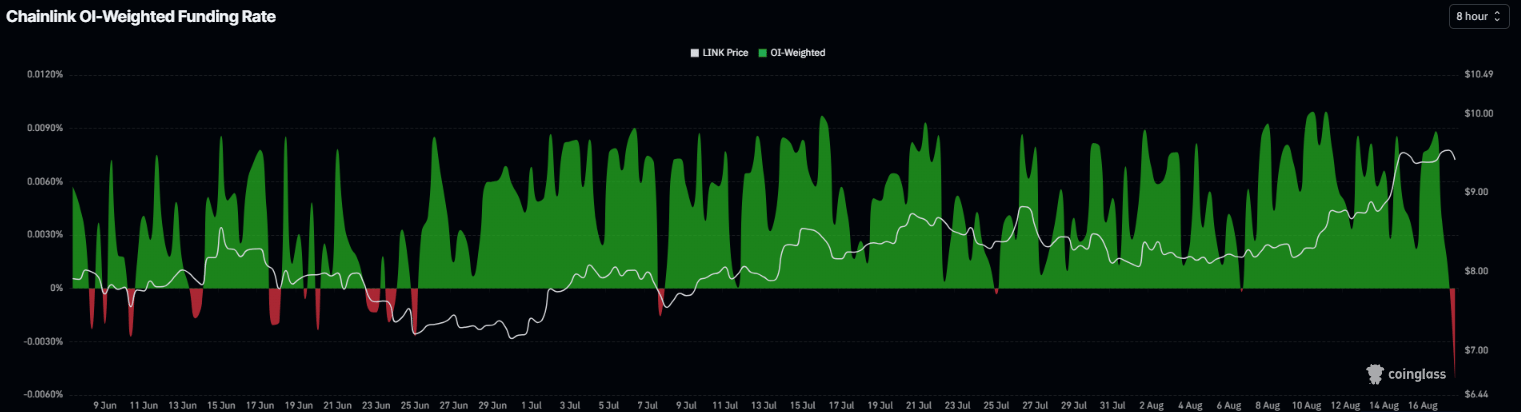
Chainlink funding rates chart. Source: Coinglass

Institutional demand remains strong

Institutional demand started the week on a positive note. SoSoValue data shows that spot LINK ETFs recorded an inflow of $2.07 million on Monday, marking its largest single-day inflow since July 22. If this trend continues and intensifies throughout the week, Chainlink could see a further rally.
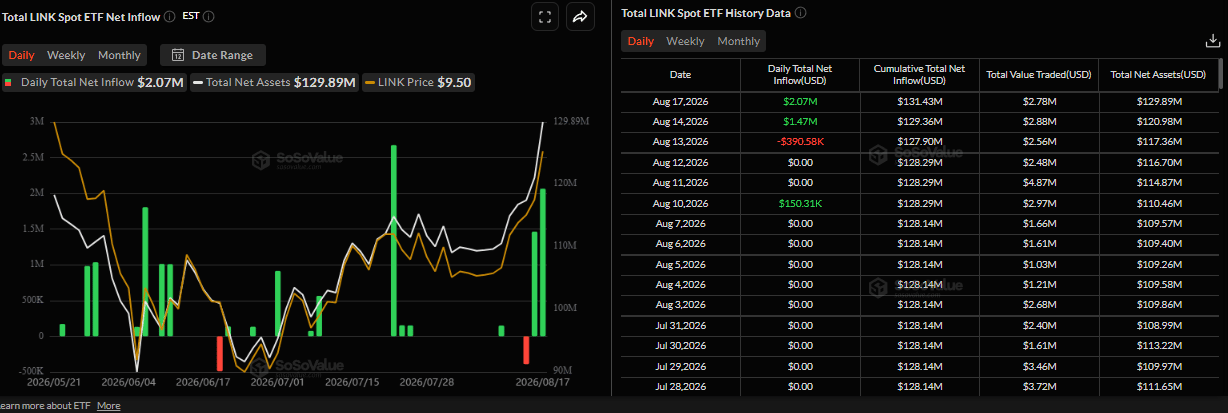
Total LINK spot ETF net inflow daily chart. Source: SoSoValue

Chainlink Price Forecast: LINK struggles near 200-day EMA

Chainlink price trades at $9.42 on Tuesday, holding above the 50-day and 100-day Exponential Moving Averages (EMAs) at $8.50 and $8.60, reinforcing a mildly constructive bias despite the pair still trading below the 200-day EMA at $9.56. 

LINK has reclaimed the 61.8% Fibonacci retracement at $9.39 as immediate support. At the same time, the Relative Strength Index (RSI) at 67 sits just shy of overbought territory, and the Moving Average Convergence Divergence (MACD) remains positive, together suggesting that upside momentum is firm but approaching a potentially stretched zone.

On the downside, initial demand is seen at the 61.8% Fibonacci retracement at $9.39, followed by a broader support band around the 50% retracement level at $8.94 and the clustered 100-day and 50-day EMAs at $8.60 and $8.50, which underpin the medium-term floor.

On the topside, buyers face first resistance at the 200-day EMA at $9.56, ahead of the horizontal barrier at $9.92; a daily close above these caps would open the way toward the 78.6% Fibonacci retracement at $10.04, with the cycle high region near $10.87 remaining a distant bullish objective.
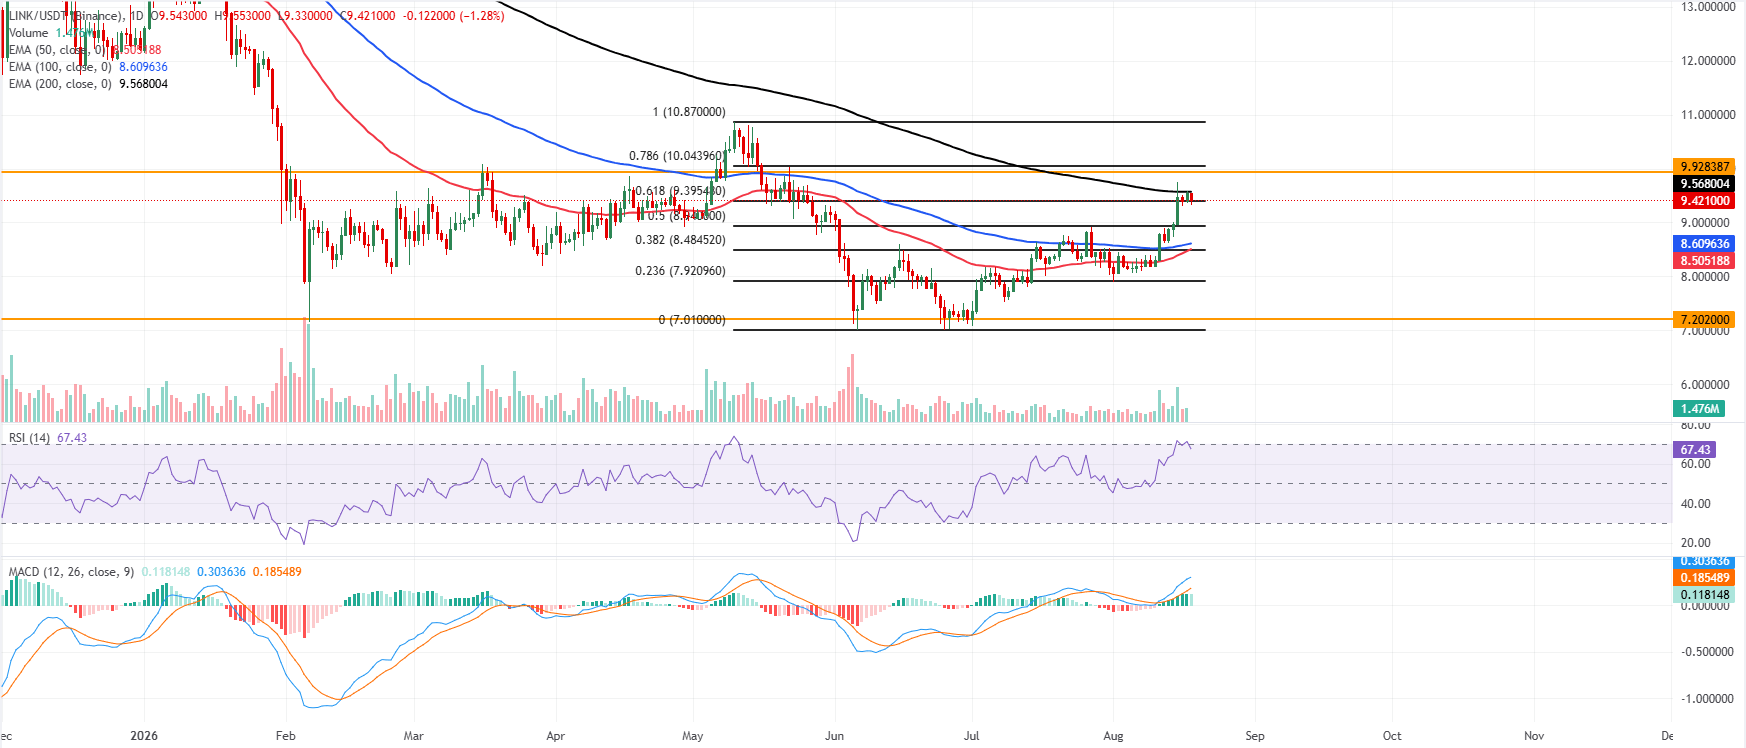
LINK/USDT daily chart

(The technical analysis of this story was written with the help of an AI tool. Know more.)

Isenção de responsabilidade: Apenas para fins informativos. O desempenho passado não é indicativo de resultados futuros.
placeholder
Kospi despenca mais de 3%, Nikkei 225 cai abaixo de 60.000 enquanto SK Hynix e Kioxia desabam mais de 7%TradingKey - As bolsas do Japão e da Coreia do Sul despencaram, com o KOSPI caindo 3,59%, para perto dos 5.000 pontos, e o Nikkei perdendo o nível-chave dos 60.000 pontos.Na sessão asiática de 16 de n
Autor  TradingKey
10 horas atrás
TradingKey - As bolsas do Japão e da Coreia do Sul despencaram, com o KOSPI caindo 3,59%, para perto dos 5.000 pontos, e o Nikkei perdendo o nível-chave dos 60.000 pontos.Na sessão asiática de 16 de n
placeholder
Preço da prata cai abaixo de US$ 50 e atinge mínima em quase um ano: por que a prata está caindo?TradingKey - Na sessão asiática de segunda-feira (16 de novembro), os preços da prata (XAGUSD) ampliaram sua recente trajetória de queda, recuando pelo terceiro pregão consecutivo e caindo quase 3% no
Autor  TradingKey
10 horas atrás
TradingKey - Na sessão asiática de segunda-feira (16 de novembro), os preços da prata (XAGUSD) ampliaram sua recente trajetória de queda, recuando pelo terceiro pregão consecutivo e caindo quase 3% no
placeholder
Ouro segue perto da mínima no ano com Fed e Oriente Médio apoiando o dólarO ouro (XAU/USD) avança levemente no início de uma nova semana, embora enfrente dificuldades para capitalizar essa alta e fracasse perto da marca de US$ 3.900 durante a sessão asiática.
Autor  FXStreet
14 horas atrás
O ouro (XAU/USD) avança levemente no início de uma nova semana, embora enfrente dificuldades para capitalizar essa alta e fracasse perto da marca de US$ 3.900 durante a sessão asiática.
placeholder
Kospi apaga ganhos e cai abaixo de 5,300 enquanto SK Hynix cai 3%, SoftBank despenca 5%TradingKey - As ações do Japão e da Coreia do Sul divergiram à tarde, com o KOSPI virando para o campo negativo e fechando em baixa de 0,98%, enquanto o Nikkei subiu 0,53% e reconquistou a marca dos 6
Autor  TradingKey
11 Mês 13 Dia Sex
TradingKey - As ações do Japão e da Coreia do Sul divergiram à tarde, com o KOSPI virando para o campo negativo e fechando em baixa de 0,98%, enquanto o Nikkei subiu 0,53% e reconquistou a marca dos 6
placeholder
Ethereum cai abaixo de US$ 2.000 após despencar mais de 20% em um mês, enquanto chances de reteste de US$ 1.500 disparamTradingKey - Ethereum despenca mais de 20% em um mês e corre o risco de retestar US$ 1.500 após perder a linha de defesa de US$ 2.000.Em 13 de novembro, o Ethereum (ETH) despencou mais de 5%, caindo o
Autor  TradingKey
11 Mês 13 Dia Sex
TradingKey - Ethereum despenca mais de 20% em um mês e corre o risco de retestar US$ 1.500 após perder a linha de defesa de US$ 2.000.Em 13 de novembro, o Ethereum (ETH) despencou mais de 5%, caindo o
Produtos relacionados
goTop
quote