


XRP and XLM outlook: Mild recovery attempts emerge amid mixed market signals
- XRP steadies at $1.10 on Thursday as bearish momentum shows early signs of easing.
- XLM recovers slightly after retesting its key support zones.
- Traders should remain cautious, as derivatives and on-chain metrics for both altcoins signal mixed sentiment, capping potential recovery.
Ripple (XRP) and Stellar (XLM) show mild signs of recovery on Thursday after extending losses earlier this week. XRP is holding above the $1.10 level as bearish momentum begins to fade, while XLM has bounced modestly from a key support zone. Despite a mildly improving technical outlook, derivatives and on-chain metrics continue to signal mixed sentiment for both altcoins, suggesting that any recovery could remain fragile.
On-chain data shows mixed sentiment
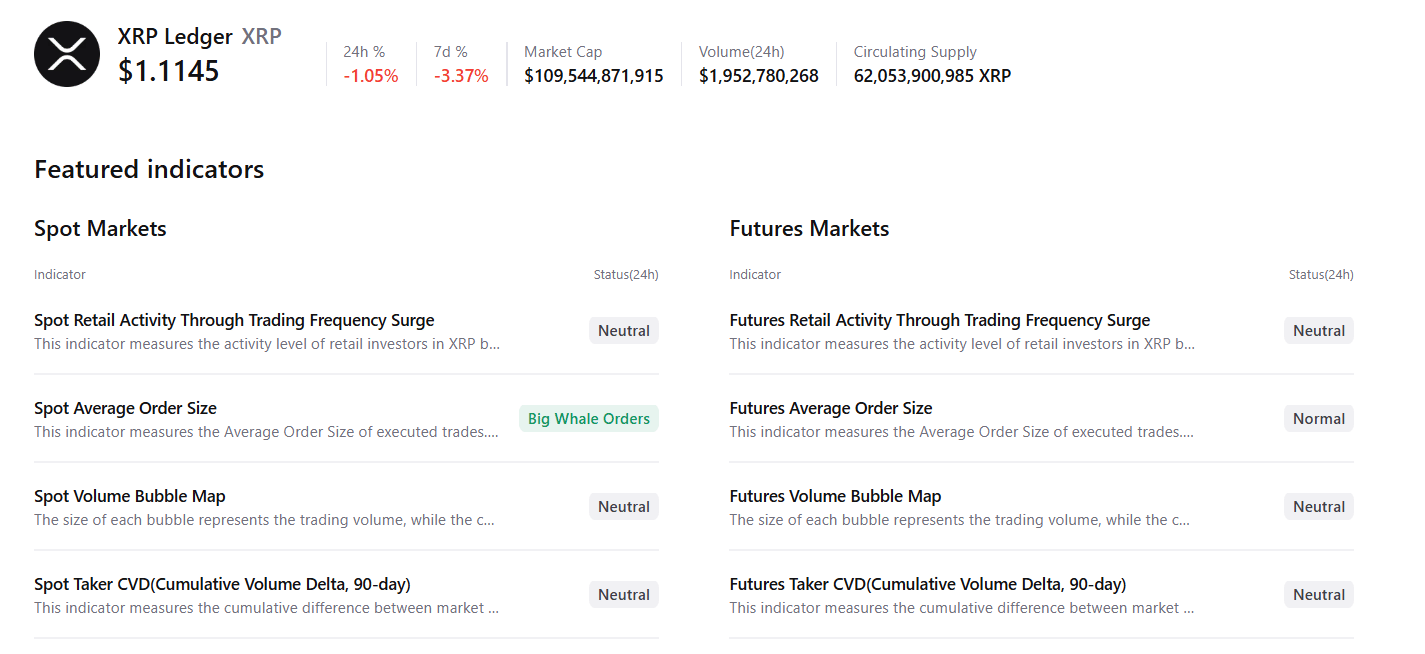
CryptoQuant’s summary data show mixed sentiment. XRP’s spot markets show large whales' orders with neutral conditions in other metrics, supporting a potential recovery.
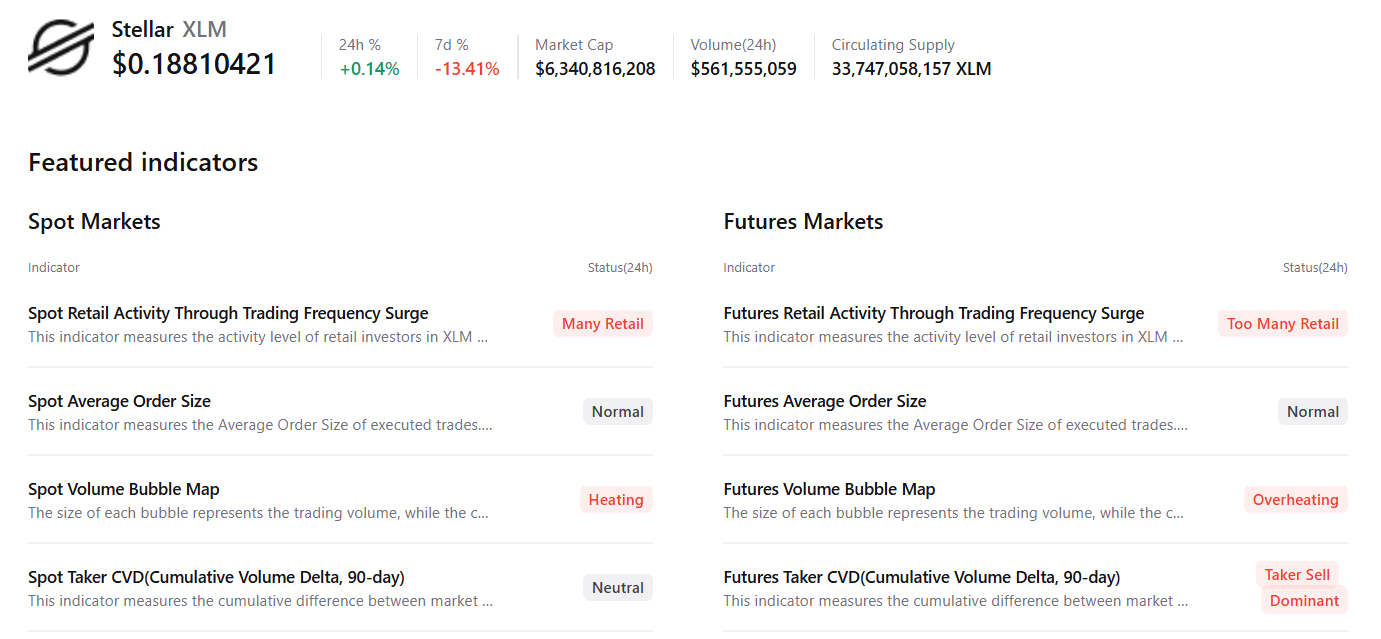
However, XLM shows an overheating condition in the spot and futures markets, with rising retail activity and sell-side dominance, hinting at bearish sentiment among traders and capping any potential recovery.
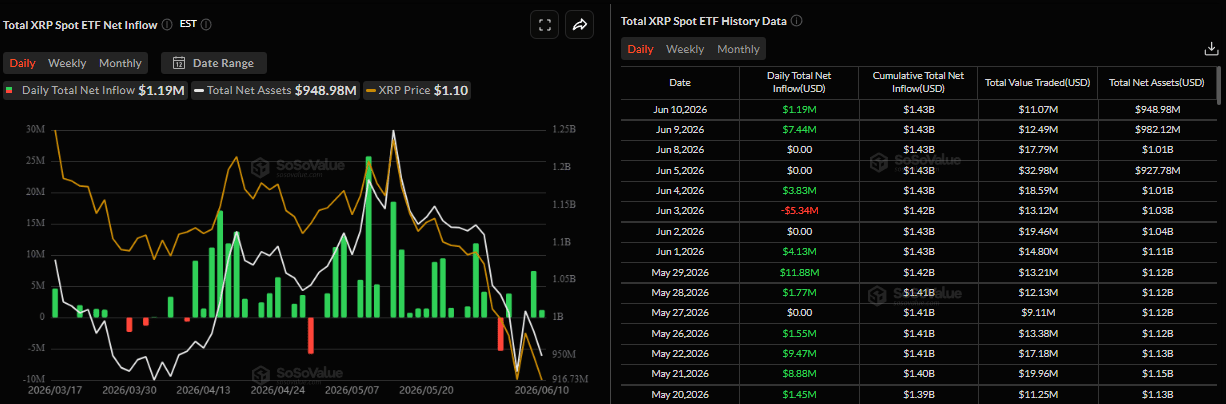
SoSoValue data shows some signs of optimism. Spot Exchange Traded Funds (ETFs) recorded an inflow of $1.19 on Wednesday after $7.44 million the previous day. If this inflow trend continues and intensifies, XRP could see a recovery ahead.
Derivatives data show a slight bearish tilt
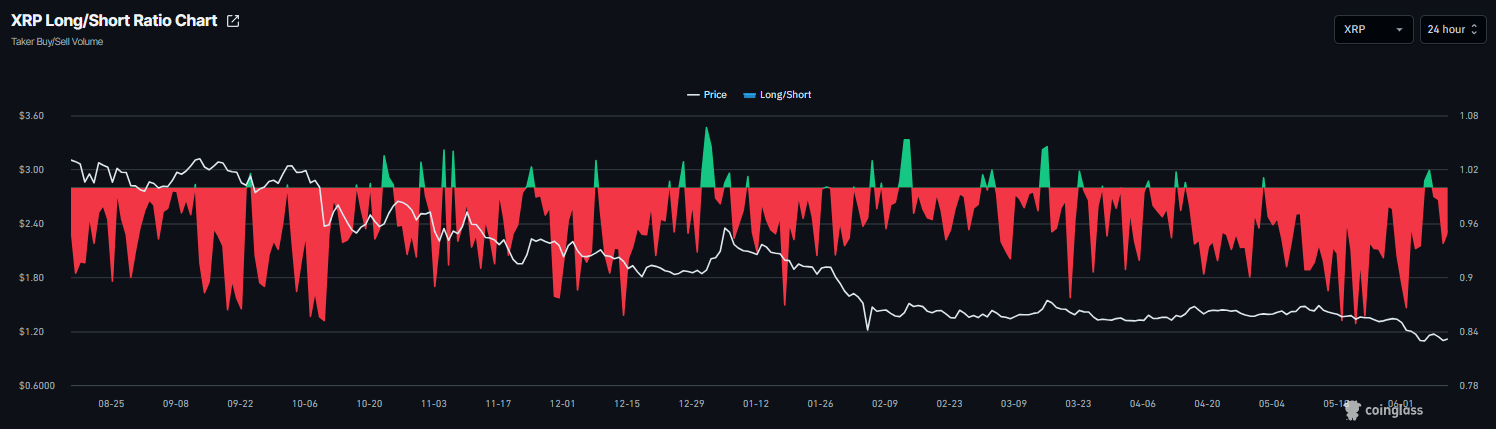
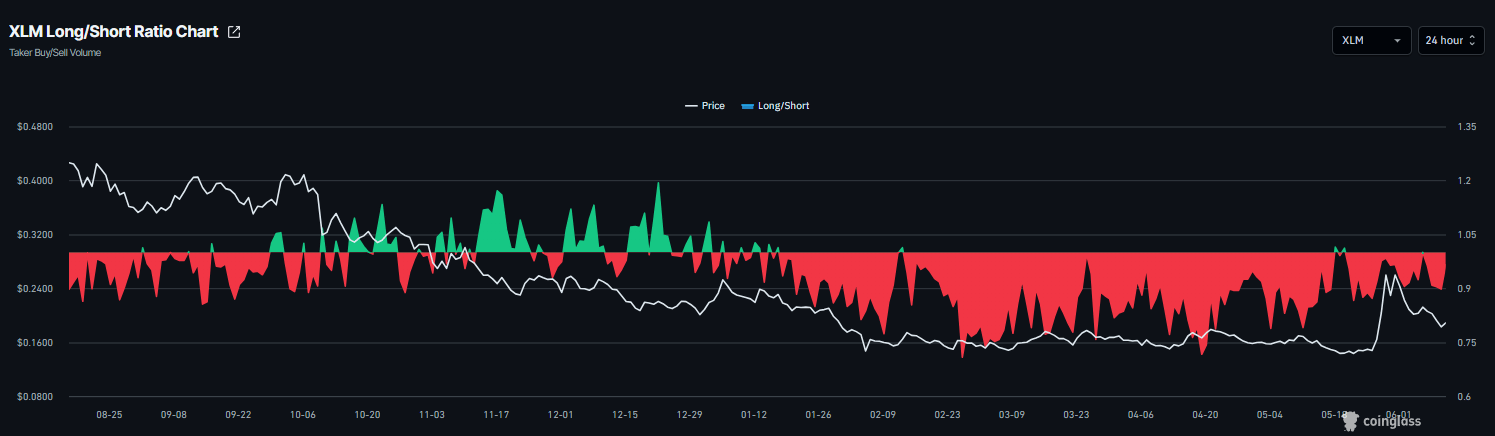
Derivatives data shows a bearish tilt. CoinGlass’ long-to-short ratio for both XRP and XLM read 0.95 and 0.96, respectively, on Thursday, nearing their lowest levels in over a month. The ratio being below one, indicates bearish sentiment, as traders are betting the assets' prices will fall.
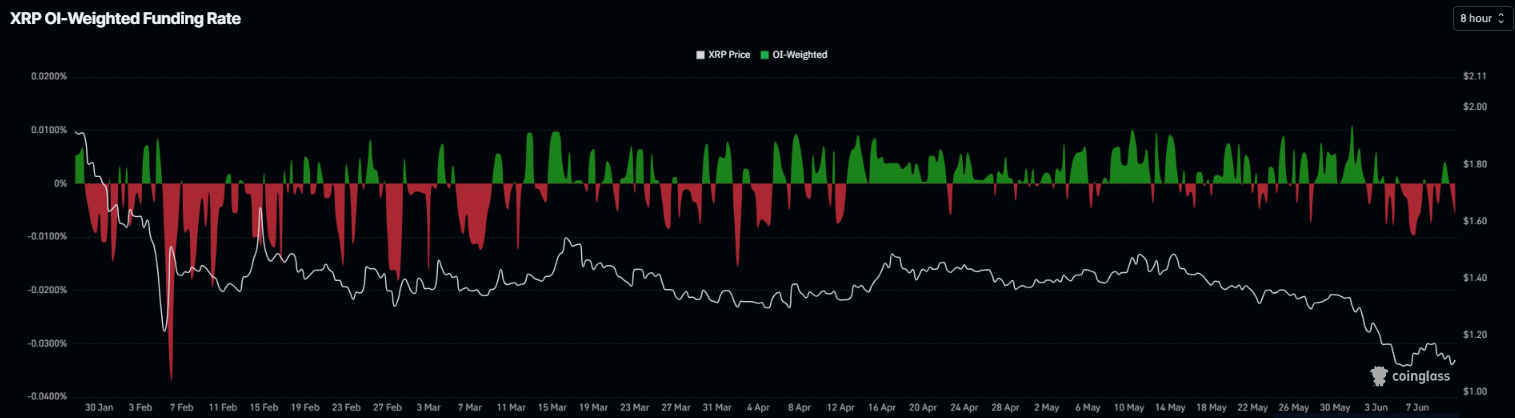
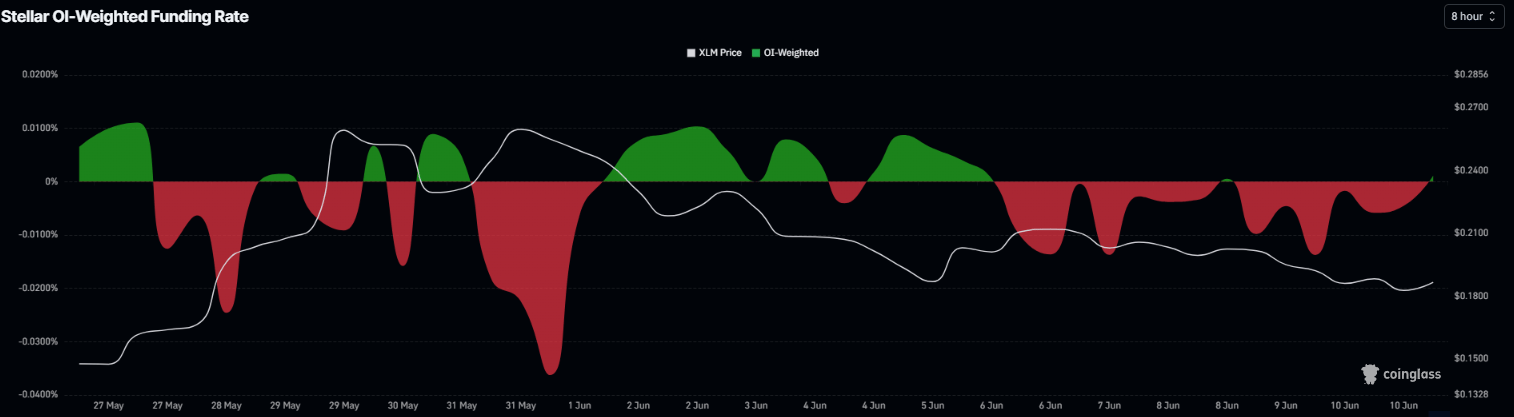
In addition, XRP funding rates turned negative on Wednesday, reading -0.006% on Thursday, indicating that shorts are paying longs and projecting bearish sentiment. However, XLM funding rates flipped positive on Thursday, suggesting mild optimism.
XRP technical outlook: Early signs of rebound
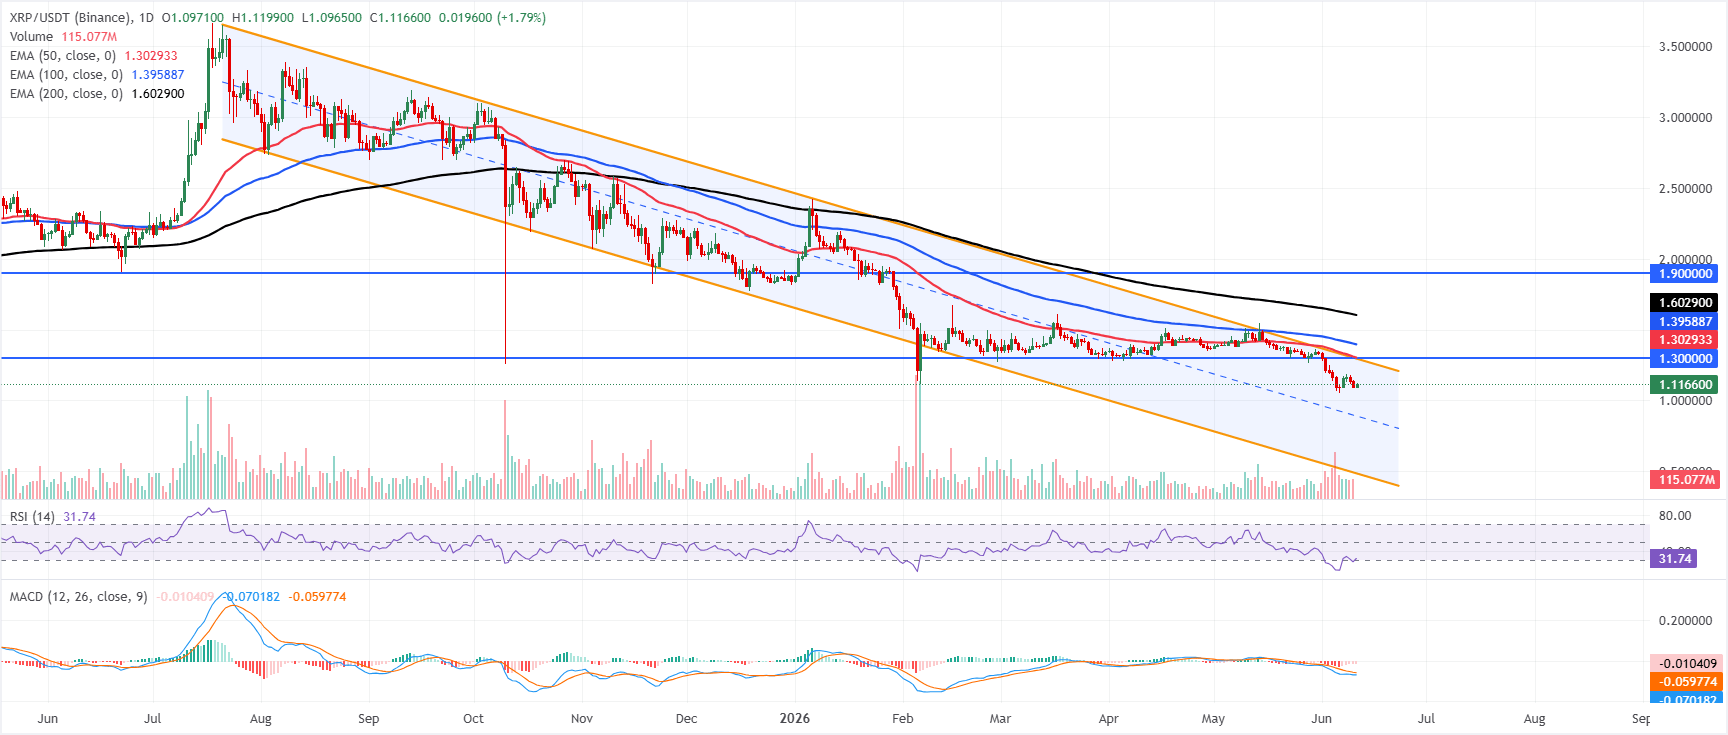
XRP price trades at $1.11 on Thursday after extending correction earlier this week. XRP remains under clear bearish pressure, holding well below the 50-day, 100-day, and 200-day Exponential Moving Averages (EMAs) at $1.30, $1.39, and $1.60, respectively, reinforcing a capped tone after the recent slide.
The Relative Strength Index (RSI) hovers just above oversold territory near 32, while the Moving Average Convergence Divergence (MACD) shows fading red histogram bars, suggesting that bearish momentum is weakening and selling pressure may be starting to ease.
On the topside, initial resistance is clustered around the parallel channel boundary at $1.29 and the horizontal barrier at $1.30, with the 50-day EMA at $1.30 adding weight to this congestion zone. Above there, the 100-day EMA at $1.39 and the 200-day EMA at $1.60 are the next levels where sellers could re-emerge, ahead of a more distant horizontal resistance near $1.90.
With no clear structural support levels immediately below the market in this dataset, a sustained break back above the $1.29–$1.30 area would be needed to ease the current bearish bias.
XLM technical outlook: Retest key supports
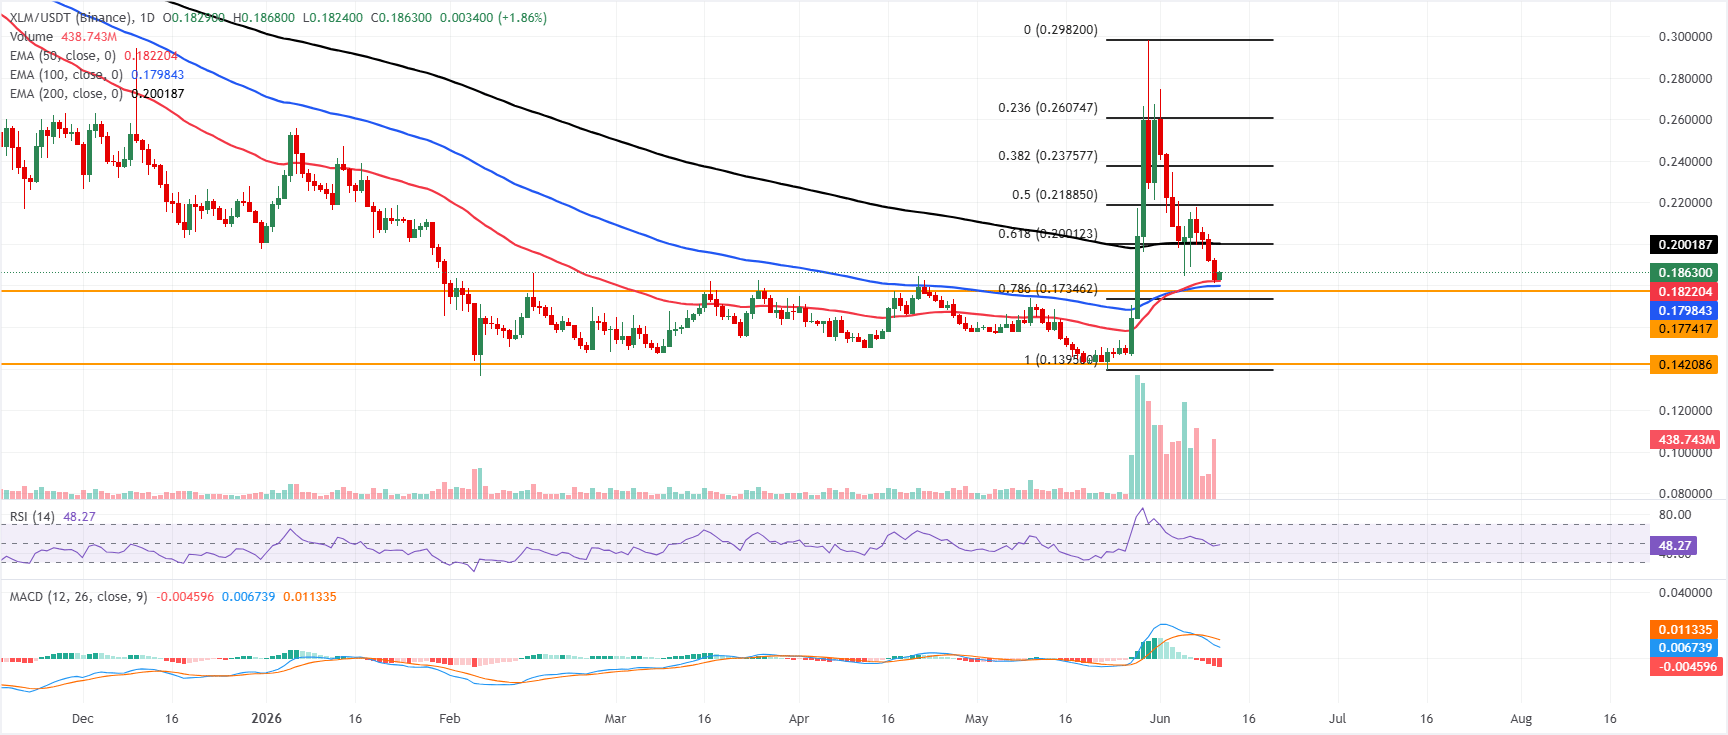
XLM trades at $0.186 on Thursday and consolidates after its recent pullback, sitting above the 50-day and 100-day EMAs at $0.1822 and $0.179, which hint at underlying trend support, but still below the longer-term 200-day EMA at $0.200 and the 61.8% Fibonacci retracement at $0.200 of the latest upswing, which cap the topside for now.
The RSI around 48 shows momentum fading back toward neutral. At the same time, the MACD has slipped below zero, with the negative line suggesting waning bullish pressure and a market that could remain range-bound unless price breaks decisively out of this EMA-Fibonacci squeeze.
On the topside, immediate resistance aligns in a tight cluster around $0.199–$0.200, where the 61.8% Fibonacci retracement and the 200-day EMA converge, and a daily close above this area would open the door toward the $0.218 and $0.237 Fibonacci retracements, ahead of the higher barrier at $0.260.
On the downside, initial support is seen at the 50-day EMA at $0.182, followed by the 100-day EMA at $0.179 and the prior horizontal floor at $0.177, with deeper losses exposing the 78.6% retracement at $0.173 before the more distant horizontal support near $0.142.
(The technical analysis of this story was written with the help of an AI tool.)
Artigos Recomendados


