

Natural Gas jumps 7% on major shale driller cutting output
- Natural Gas up over 7% intraday in European trading.
- Traders are sending Gas higher as the supply side will soon see reduced flows.
- The US Dollar Index is back above 104 after its decline Tuesday and ahead of the Fed Minutes.
Natural Gas (XNG/USD) is jumping back to $1.80 in a steep rally which is mainly headline driven. One of the major Shale drillers, Chesapeake, is planning to cut its Natural Gas production already in 2024. The recent crash in Gas prices makes its Gas mining operations nearly unprofitable, and forces the company to cut its output, which means the global supply side will become tighter.
The US Dollar (USD) is jumping higher this Wednesday after its small retreat on Tuesday. Traders had some catching up to do with the US Public Holiday on Monday, and sent the US Dollar Index (DXY) snapping below 104. Ahead of the US opening bell, the DXY is back above 104 ahead of the US Federal Reserve Minutes from its most recent rate decision meeting.
Natural Gas is trading at $1.78 per MMBtu at the time of writing.
Natural Gas market movers: Surplus just got smaller
- The overall Gas supply just got smaller with Chesapeake reducing its output production for 2024. It is set to reduce nearly 20% of its total output for 2024 already.
- LNG is flowing above average with more than 17% inflow on top of the normal 30-day average.
- The bullet point above shows that Europe is busy refilling and restocking its Gas stores with its eye on the next heating season.
- Several benchmark futures are soaring with that active buying taking place in the Natural Gas futures markets.
Natural Gas Technical Analysis: The catalyst markets were waiting for
Natural Gas is finding some reasoning to jump higher, back to the $1.80 pivotal level. The move comes with finally the supply side seeing some disruption ahead for 2024 and which means a repricing (higher) is needed to factor this event in. It becomes very clear that should Gas prices want to move further up, any supply side disruption will be key to accomplish this.
On the upside, Natural Gas is facing some pivotal technical levels to get back to. Once $1.80 is surpassed, the next stop is $1.99, – the level which, when broken, saw an accelerated decline. After that the blue line at $2.13 comes into view, with the triple bottoms from 2023. In case Natural Gas sees sudden demand pick up, possibly $2.40 could come into play.
Keep an eye on $1.80, which was a pivotal level back in July 2020 and acts as a cap with a firm rejection earlier this Wednesday. Should the recent headlines start to fade, or more supply emerge in the markets from other firms or countries to fill the gap, $1.64 and $1.53 (the low of 2020) are targets to look out for.
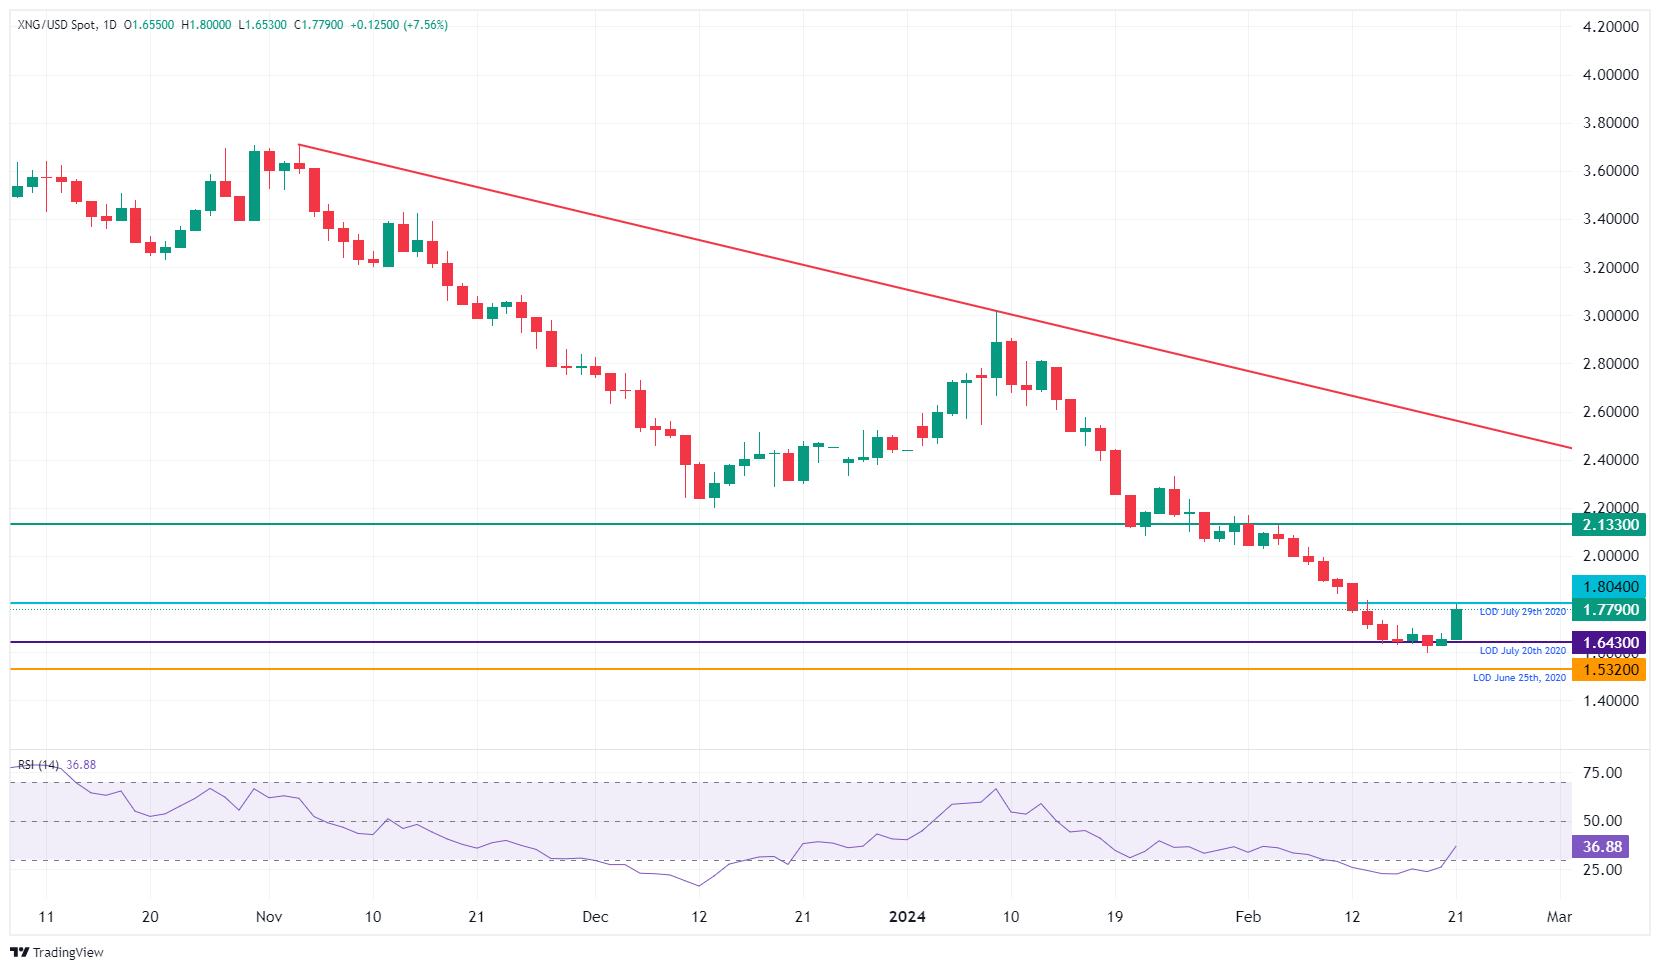
XNG/USD (Daily Chart)
US Dollar FAQs
What is the US Dollar?
The US Dollar (USD) is the official currency of the United States of America, and the ‘de facto’ currency of a significant number of other countries where it is found in circulation alongside local notes. It is the most heavily traded currency in the world, accounting for over 88% of all global foreign exchange turnover, or an average of $6.6 trillion in transactions per day, according to data from 2022.
Following the second world war, the USD took over from the British Pound as the world’s reserve currency. For most of its history, the US Dollar was backed by Gold, until the Bretton Woods Agreement in 1971 when the Gold Standard went away.
How do the decisions of the Federal Reserve impact the US Dollar?
The most important single factor impacting on the value of the US Dollar is monetary policy, which is shaped by the Federal Reserve (Fed). The Fed has two mandates: to achieve price stability (control inflation) and foster full employment. Its primary tool to achieve these two goals is by adjusting interest rates.
When prices are rising too quickly and inflation is above the Fed’s 2% target, the Fed will raise rates, which helps the USD value. When inflation falls below 2% or the Unemployment Rate is too high, the Fed may lower interest rates, which weighs on the Greenback.
What is Quantitative Easing and how does it influence the US Dollar?
In extreme situations, the Federal Reserve can also print more Dollars and enact quantitative easing (QE). QE is the process by which the Fed substantially increases the flow of credit in a stuck financial system.
It is a non-standard policy measure used when credit has dried up because banks will not lend to each other (out of the fear of counterparty default). It is a last resort when simply lowering interest rates is unlikely to achieve the necessary result. It was the Fed’s weapon of choice to combat the credit crunch that occurred during the Great Financial Crisis in 2008. It involves the Fed printing more Dollars and using them to buy US government bonds predominantly from financial institutions. QE usually leads to a weaker US Dollar.
What is Quantitative Tightening and how does it influence the US Dollar?
Quantitative tightening (QT) is the reverse process whereby the Federal Reserve stops buying bonds from financial institutions and does not reinvest the principal from the bonds it holds maturing in new purchases. It is usually positive for the US Dollar.
Artigos Recomendados


