Silver Price Analysis: XAG/USD flat lines above mid-$29.00s, 50-day SMA holds the key for bulls

Fonte Fxstreet
  • Silver struggles to register any meaningful recovery from a multi-day low touched this Monday.
  • The mixed technical setup warrants caution before placing bullish bets around the XAG/USD. 
  • A convincing break below the 50-day SMA is needed to support prospects for further losses.

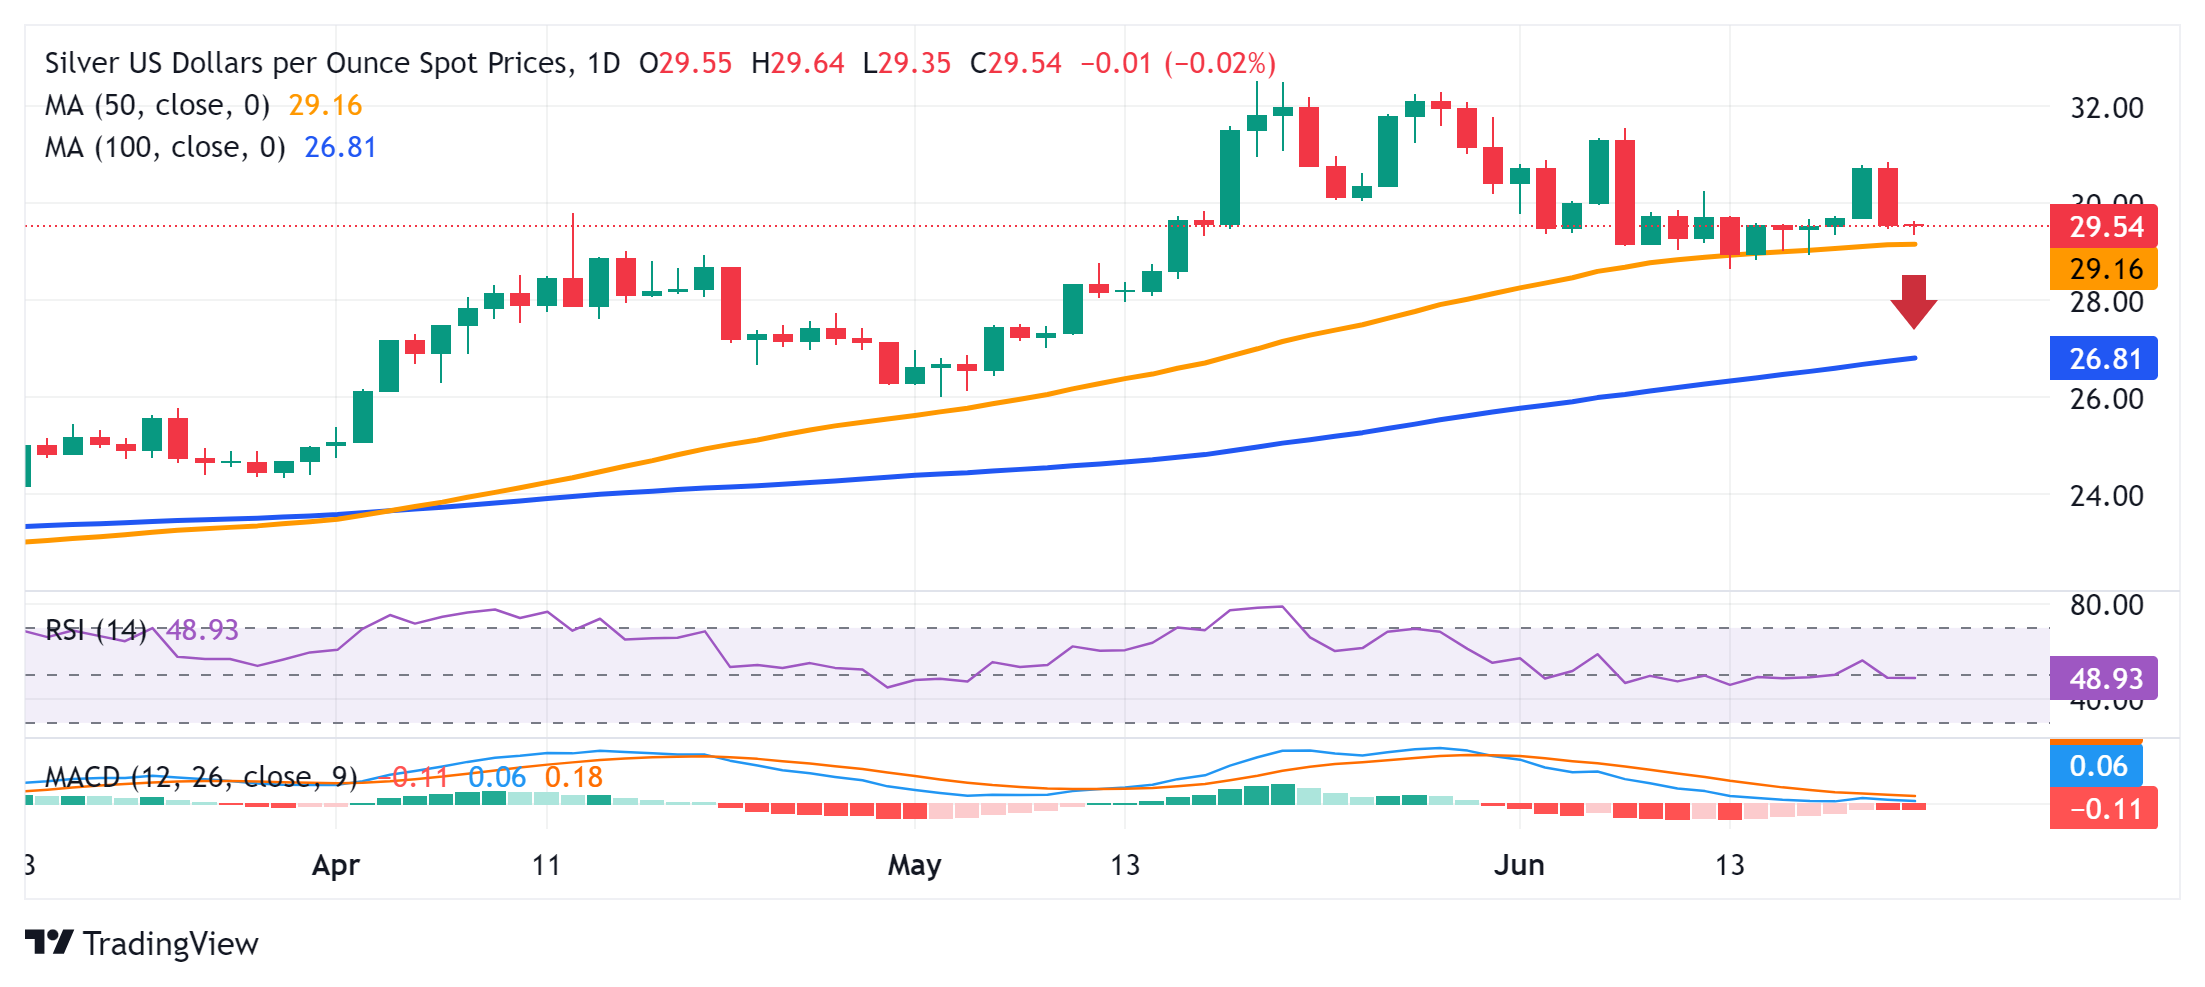
Silver (XAG/USD) finds some support ahead of the 50-day Simple Moving Average (SMA) and stages a modest bounce from a three-day low, around the $29.35 region touched during the Asian session on Monday. The white metal, for now, seems to have stalled its retracement slide from the vicinity of the $31.00 mark, or a two-week high touched on Friday, though struggles to attract any meaningful buyers. 

From a technical perspective, the XAG/USD is holding above 50-day, 100-day and 200-day SMAs, which favors bullish traders. That said, oscillators on the daily chart have just started drifting in negative territory and warrant some caution before positioning for any further appreciating move. Meanwhile, the 50-day SMA, currently pegged near the $29.15 area, is likely to protect the immediate downside ahead of the $29.00 round-figure mark. 

A convincing break below the latter will shift the near-term bias in favor of bearish traders and set the stage for some meaningful downside. The XAG/USD might then accelerate the fall towards the next relevant support near the $28.30-28.25 region and eventually drop to the $28.00 mark. The downward trajectory could extend further towards the $27.55 support en route to the $27.00 round figure and the 100-day SMA, around the $26.90-26.85 area. 

On the flip side, the $30.00 psychological mark might act as an immediate strong barrier ahead of the $30.45-30.50 region. This is followed by the $30.70 supply zone, above which the XAG/USD could aim to surpass the $31.00 round figure and test the next relevant hurdle near the $31.35 area. The subsequent move-up should allow bulls to reclaim the $32.00 mark and retest the $32.50 supply zone, or the YTD peak touched in May.

Silver daily chart
fxsoriginal

XAG/USD

Overview
Today last price 29.56
Today Daily Change 0.01
Today Daily Change % 0.03
Today daily open 29.55
 
Trends
Daily SMA20 30.22
Daily SMA50 29.15
Daily SMA100 26.74
Daily SMA200 24.95
 
Levels
Previous Daily High 30.86
Previous Daily Low 29.47
Previous Weekly High 30.86
Previous Weekly Low 28.93
Previous Monthly High 32.51
Previous Monthly Low 26.02
Daily Fibonacci 38.2% 30
Daily Fibonacci 61.8% 30.33
Daily Pivot Point S1 29.06
Daily Pivot Point S2 28.57
Daily Pivot Point S3 27.67
Daily Pivot Point R1 30.45
Daily Pivot Point R2 31.34
Daily Pivot Point R3 31.83


Isenção de responsabilidade: Apenas para fins informativos. O desempenho passado não é indicativo de resultados futuros.
placeholder
O ouro recua em meio à contínua compra de USD, enquanto os traders aguardam o relatório adiado do NFP dos EUA.O ouro (XAU/USD) atrai novos vendedores após um aumento durante a sessão asiática para a região de US$ 4.110 nesta quinta-feira e recua ainda mais em relação à máxima semanal atingida no dia anterior.
Autor  FXStreet
17 horas atrás
O ouro (XAU/USD) atrai novos vendedores após um aumento durante a sessão asiática para a região de US$ 4.110 nesta quinta-feira e recua ainda mais em relação à máxima semanal atingida no dia anterior.
placeholder
Ibovespa cai antes do feriado; dólar sobe a R$ 5,33 com cautela e queda do petróleoO Ibovespa encerrou esta quarta-feira (19) em queda de 0,73%, aos 155.380,66 pontos, registrando uma perda de mais de 1.100 pontos. O movimento marca a terceira baixa consecutiva do índice, uma sequência negativa que não era vista desde o início de outubro.
Autor  Pedro Augusto Prazeres
19 horas atrás
O Ibovespa encerrou esta quarta-feira (19) em queda de 0,73%, aos 155.380,66 pontos, registrando uma perda de mais de 1.100 pontos. O movimento marca a terceira baixa consecutiva do índice, uma sequência negativa que não era vista desde o início de outubro.
placeholder
HGLG11 projeta alta na vacância para 2026; RZAK11 paga yield de 1,35% e RZAT11 reduz dividendoO fundo imobiliário CSHG Logística (HGLG11) divulgou seu relatório gerencial referente ao mês de outubro, informando um resultado distribuível de R$ 32,246 milhões. O montante representa um recuo em relação ao desempenho de setembro, quando o fundo havia registrado R$ 36,939 milhões.
Autor  Pedro Augusto Prazeres
19 horas atrás
O fundo imobiliário CSHG Logística (HGLG11) divulgou seu relatório gerencial referente ao mês de outubro, informando um resultado distribuível de R$ 32,246 milhões. O montante representa um recuo em relação ao desempenho de setembro, quando o fundo havia registrado R$ 36,939 milhões.
placeholder
Bitcoin (BTC) cai com ata do Fed; "Medo Extremo" e capitulação podem sinalizar fundoO Bitcoin (BTC) aprofundou sua correção nesta quarta-feira (19), caindo para baixo do patamar de US$ 89.000 e atingindo sua mínima em sete meses. O movimento de aversão ao risco foi intensificado pela divulgação das atas da reunião do Federal Reserve (Fed) realizada em 28 e 29 de outubro.
Autor  Pedro Augusto Prazeres
20 horas atrás
O Bitcoin (BTC) aprofundou sua correção nesta quarta-feira (19), caindo para baixo do patamar de US$ 89.000 e atingindo sua mínima em sete meses. O movimento de aversão ao risco foi intensificado pela divulgação das atas da reunião do Federal Reserve (Fed) realizada em 28 e 29 de outubro.
placeholder
A Semrush se une à Adobe para impulsionar a próxima geração de marketing generativo com IA.A Adobe adquire a Semrush por US$ 1,9 bilhão, integrando ferramentas de SEO e marketing com inteligência artificial para aumentar a visibilidade da marca em plataformas digitais e baseadas em IA.
Autor  Cryptopolitan
21 horas atrás
A Adobe adquire a Semrush por US$ 1,9 bilhão, integrando ferramentas de SEO e marketing com inteligência artificial para aumentar a visibilidade da marca em plataformas digitais e baseadas em IA.
Produtos relacionados
goTop
quote