

Gold crosses Rubicon higher, reviving bullish hopes
- Gold trades higher on Friday on the back of continued expectations global interest rates will decline.
- As a non-interest-bearing asset, lower interest rates increase the attractiveness of Gold.
- XAU/USD’s break above key resistance invalidates the bearish Head-and-Shoulders pattern that formed on the daily chart.
Gold (XAU/USD) has broken back above its 50-day Simple Moving Average (SMA) and trades in the $2,360s on Friday as investors continue to bet on the US Federal Reserve (Fed) lowering interest rates, a key determinant of Gold price. Lower interest rates are positive for the yellow metal as they reduce the opportunity cost of holding Gold, which is non-coupon paying, compared to other assets like bonds.
Gold breaks higher as bargain hunters enter market
Gold trades higher at the end of the week on expectations that interest rates in the US – and other major economies – are set to fall. Lower-than-expected Retail Sales data for May out of the US and a rise in Jobless Claims on Thursday suggest economic momentum in the US may be slowing. This, in turn, is likely to lead to a cooling off in inflation and a greater possibility the Fed will move to cut interest rates. Such a chain of events would be positive for Gold.
Further afield, the Swiss National Bank’s (SNB) decision to cut interest rates by 0.25% to 1.25% on Thursday; the Bank of England’s (BoE) mildly dovish hold at its meeting; and the People’s Bank of China’s (PBoC) decision to hold its 1-year and 5-year prime loan rates at 3.45% and 3.95%, respectively, point to a flat-to-negative trajectory for interest rates which is positive for Gold, according to Kitco’s Jim Wyckoff.
Gold also benefits from strong central bank buying, according to a survey of international central bank reserve managers conducted by the World Gold Council (WGC). The survey’s findings found that 81% of respondents thought central banks would increase their holdings in 2024 – the highest percentage since the survey began in 2019.
A large share of the central-bank buying has been by Asian central banks hoarding Gold as a hedge against a strengthening US Dollar. With the Fed dialing back expectations of interest-rate cuts from three to one in 2024, according to the latest Fed dot-plot, the year has seen many Asian currencies depreciate significantly versus the Greenback.
The trend of using Gold as a buffer against the strength of the US Dollar has been magnified by the increasingly partisan division of world trade between BRICS nations and the West. A major policy plank of the BRICS and their allies is to break the dominance of the US Dollar so that it cannot be used as a weapon against their members (which include Russia and now Iran) in sanctions. One of the few realistic replacements to the Dollar would be conducting trade in Gold-denominated financial assets.
The split between the BRICS and the West, moreover, has been accelerated by Russia’s invasion of Ukraine and Israel’s war against Hammas, which has divided the world along ideological and political lines. Given these conflicts are not set to end any time soon, they are likely to continue providing a backdraught of demand for Gold, both as a potential medium of exchange and a safe-haven.
Technical Analysis: Gold break higher invalidates Head-and-Shoulders pattern
Gold decisively breaks above a key resistance level at the 50-day Simple Moving Average (SMA) and a trendline connecting the May 7 and June 20 highs.
The break is critical as it invalidates the bearish Head-and-Shoulders (H&S) pattern that had been forming on the daily chart.
XAU/USD Daily Chart
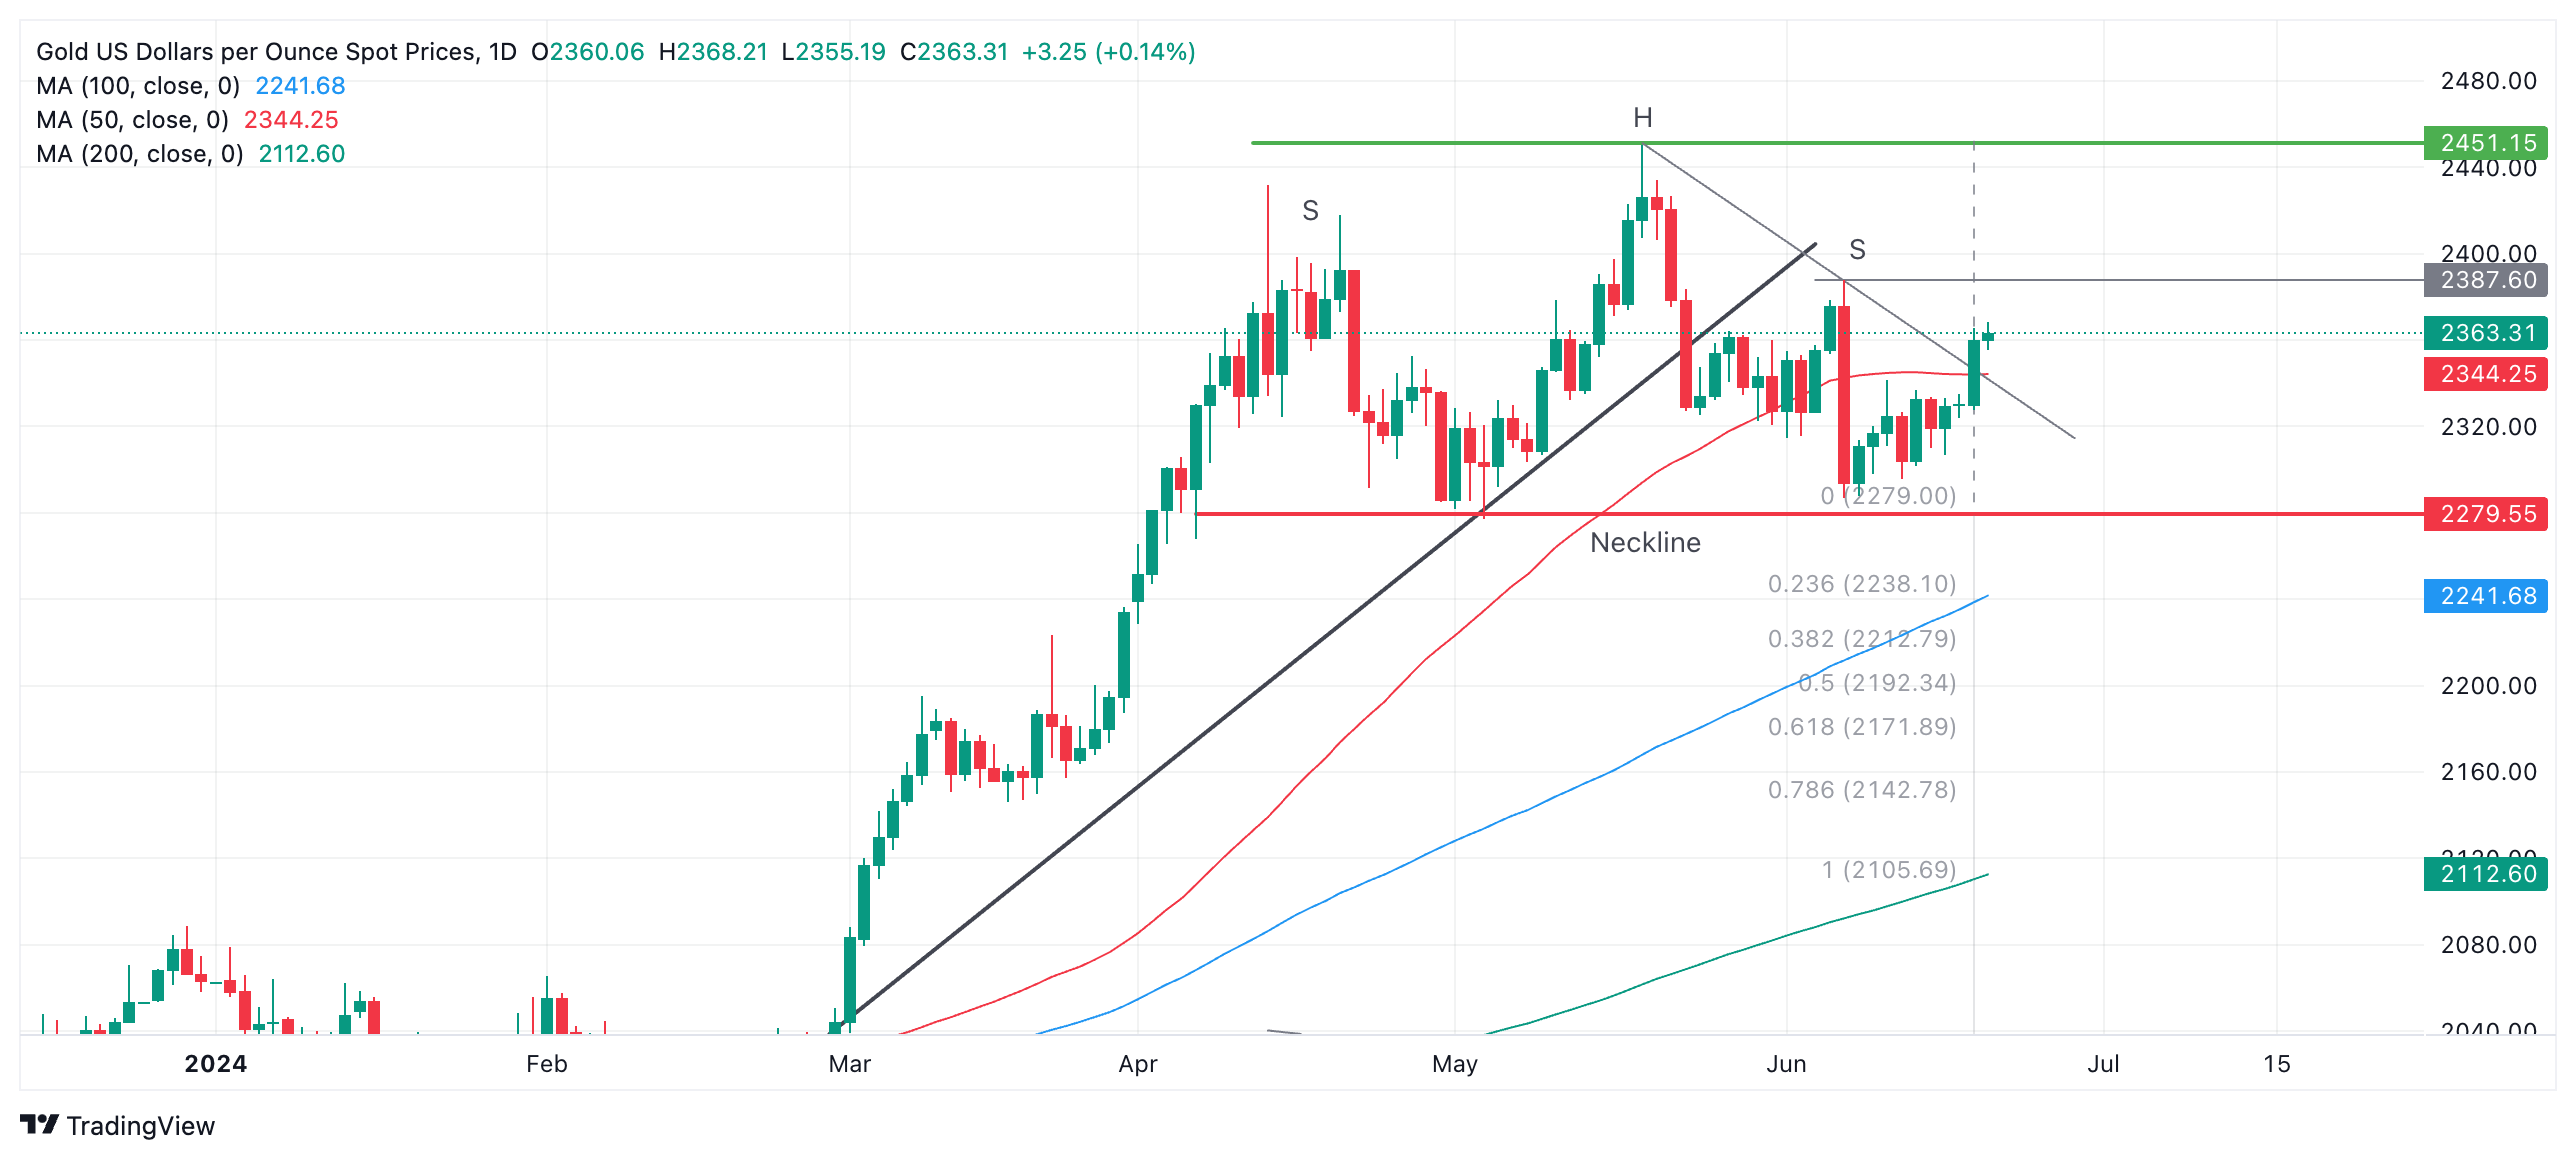
Gold’s follow-through higher after the break is likely to reach an initial target in the mid $2,380s (June 7 high).
A break above the June 7 high would indicate a probable continuation up to the May – and all-time – high at $2,450.
A break above that would confirm a resumption of the broader uptrend.
Economic Indicator
Retail Sales (MoM)
The Retail Sales data, released by the US Census Bureau on a monthly basis, measures the value in total receipts of retail and food stores in the United States. Monthly percent changes reflect the rate of changes in such sales. A stratified random sampling method is used to select approximately 4,800 retail and food services firms whose sales are then weighted and benchmarked to represent the complete universe of over three million retail and food services firms across the country. The data is adjusted for seasonal variations as well as holiday and trading-day differences, but not for price changes. Retail Sales data is widely followed as an indicator of consumer spending, which is a major driver of the US economy. Generally, a high reading is seen as bullish for the US Dollar (USD), while a low reading is seen as bearish.
Read more.Last release: Tue Jun 18, 2024 12:30
Frequency: Monthly
Actual: 0.1%
Consensus: 0.2%
Previous: 0%
Source: US Census Bureau
Retail Sales data published by the US Census Bureau is a leading indicator that gives important information about consumer spending, which has a significant impact on the GDP. Although strong sales figures are likely to boost the USD, external factors, such as weather conditions, could distort the data and paint a misleading picture. In addition to the headline data, changes in the Retail Sales Control Group could trigger a market reaction as it is used to prepare the estimates of Personal Consumption Expenditures for most goods.
Artigos Recomendados


