

Silver Price Forecast: XAG/USD holds key support of $29 as cooler US CPI boosts Fed rate-cut bets

Fonte Fxstreet
  • Silver price gains ground above $29.00 as soft US price pressures weigh on bond yields.
  • Traders price in two rate cuts this year against one signaled by the Fed.
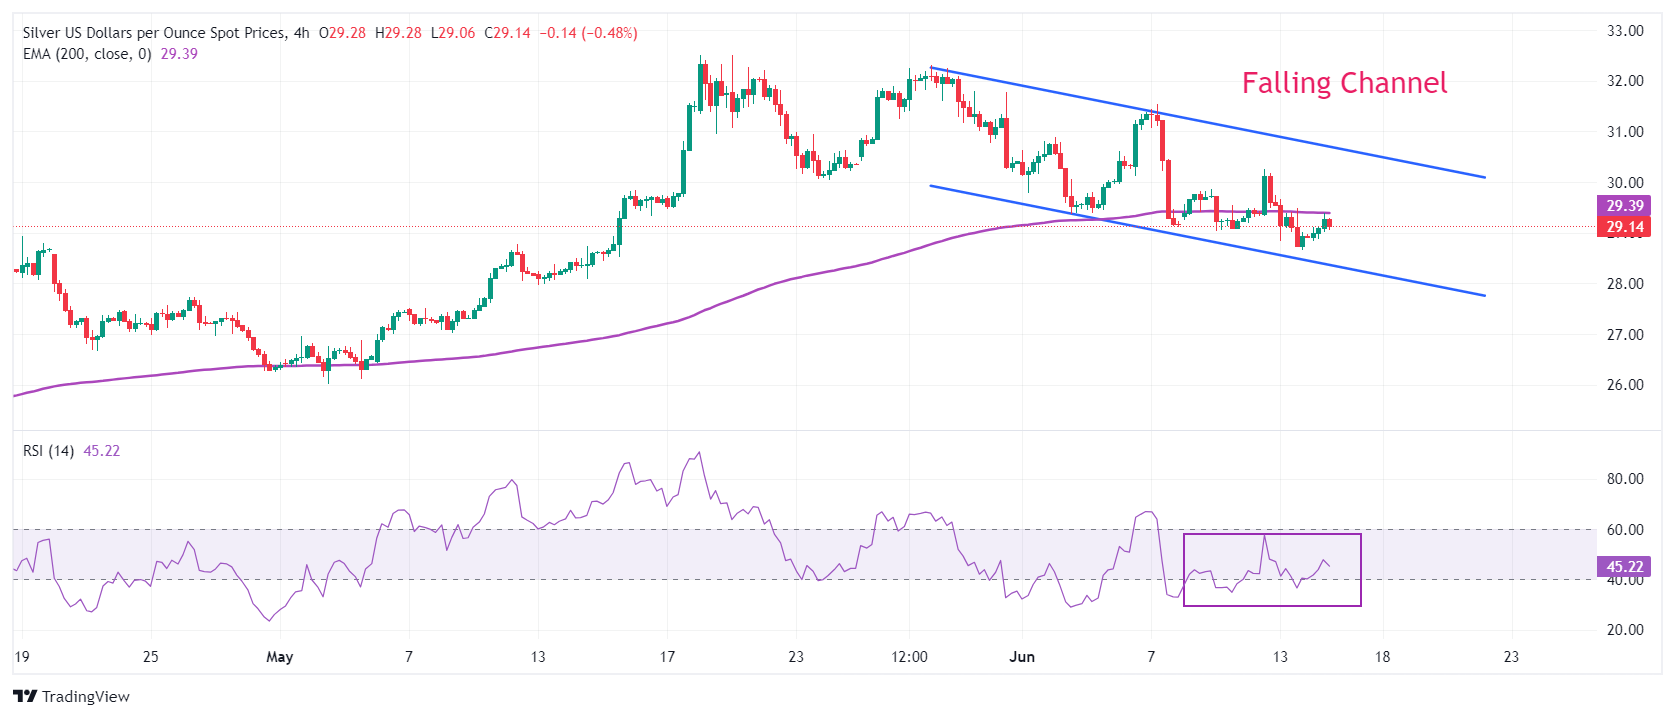
  • Silver price trades in a Falling Channel formation.

Silver price (XAG/USD) clings to key support of $29.00 in Friday’s American session. The white metal rebounds as US bond yields come under pressure due to improved speculation that the Federal Reserve (Fed) will start reducing interest rates from the September meeting.

10-year US Treasury yields have dropped to near 4.20%. Lower yields on interest-bearish assets reduce the opportunity cost of holding an investment in non-yielding assets, such as Silver.

The CME FedWatch tool shows that the probability for rate cuts in September has improved to almost 71% from 50.4% recorded a week ago. Market expectations for Fed rate cuts have risen as the United States (US) consumer and produce inflation decline on monthly and an annual basis in May. Major contribution to decline in price pressures came from soft gasoline prices.

The CME FedWatch Tool also shows that there will be two rate cuts this year against one signalled by Fed policymakers in their latest dot plot. Fed officials lowered potential number of rate cuts in the forecast report from three forecasted in March as they were concerned over inflation remaining stubborn due to strong labor market conditions.

Meanwhile, the US Dollar Index (DXY), which tracks the Greenback’s value against six major currencies, jumps to 105.70.

Silver technical analysis

Silver price trades inside Thursday’s trading range. The white metal trades in a Falling Channel chart pattern in which each pullback is considered as selling opportunity by market participants. The asset has dropped below the 200-period Exponential Moving Average (EMA), which trades around $29.40, indicating the overall trend has turned bearish.

The 14-period Relative Strength Index (RSI) oscillates in the 40.00-60.00 range, suggesting a consolidating ahead.

Silver four-hour chart
XAG/USD

Overview
Today last price 29.16
Today Daily Change 0.20
Today Daily Change % 0.69
Today daily open 28.96
 
Trends
Daily SMA20 30.62
Daily SMA50 28.93
Daily SMA100 26.34
Daily SMA200 24.75
 
Levels
Previous Daily High 29.73
Previous Daily Low 28.66
Previous Weekly High 31.55
Previous Weekly Low 29.12
Previous Monthly High 32.51
Previous Monthly Low 26.02
Daily Fibonacci 38.2% 29.07
Daily Fibonacci 61.8% 29.32
Daily Pivot Point S1 28.5
Daily Pivot Point S2 28.04
Daily Pivot Point S3 27.43
Daily Pivot Point R1 29.58
Daily Pivot Point R2 30.19
Daily Pivot Point R3 30.66


Isenção de responsabilidade: Apenas para fins informativos. O desempenho passado não é indicativo de resultados futuros.
placeholder
Previsão do preço do ouro: ouro sustenta suporte-chave de US$ 3.850, vendas no varejo dos EUA em outubro podem impulsionar recuperação rumo a US$ 4.000TradingKey - Na sessão asiática de terça-feira (17 de novembro), o ouro (XAUUSD) manteve uma leve recuperação no intradia de hoje, após recentes quedas contínuas para uma mínima em quase um ano, avanç
Autor  TradingKey
11 horas atrás
TradingKey - Na sessão asiática de terça-feira (17 de novembro), o ouro (XAUUSD) manteve uma leve recuperação no intradia de hoje, após recentes quedas contínuas para uma mínima em quase um ano, avanç
placeholder
Kospi tomba 2% abaixo de 5.000, Nikkei cai pelo quarto dia; Kioxia despenca mais de 5%, Samsung e SoftBank caem mais de 3%TradingKey - As ações do Japão e da Coreia do Sul despencaram de forma generalizada no fechamento, com os papéis sul-coreanos caindo abaixo do patamar de 5.000 pontos e a Kioxia desabando mais de 5%,
Autor  TradingKey
12 horas atrás
TradingKey - As ações do Japão e da Coreia do Sul despencaram de forma generalizada no fechamento, com os papéis sul-coreanos caindo abaixo do patamar de 5.000 pontos e a Kioxia desabando mais de 5%,
placeholder
Gold recovers from YTD low; Fed hike bets and bullish USD to cap further gainsGold (XAU/USD) edges higher during the Asian session on Tuesday and moves away from its lowest level since October 2025, near the $3,832 area, which it touched the previous day.
Autor  FXStreet
15 horas atrás
Gold (XAU/USD) edges higher during the Asian session on Tuesday and moves away from its lowest level since October 2025, near the $3,832 area, which it touched the previous day.
placeholder
Kospi despenca mais de 3%, Nikkei 225 cai abaixo de 60.000 enquanto SK Hynix e Kioxia desabam mais de 7%TradingKey - As bolsas do Japão e da Coreia do Sul despencaram, com o KOSPI caindo 3,59%, para perto dos 5.000 pontos, e o Nikkei perdendo o nível-chave dos 60.000 pontos.Na sessão asiática de 16 de n
Autor  TradingKey
Ontem 09: 27
TradingKey - As bolsas do Japão e da Coreia do Sul despencaram, com o KOSPI caindo 3,59%, para perto dos 5.000 pontos, e o Nikkei perdendo o nível-chave dos 60.000 pontos.Na sessão asiática de 16 de n
placeholder
Preço da prata cai abaixo de US$ 50 e atinge mínima em quase um ano: por que a prata está caindo?TradingKey - Na sessão asiática de segunda-feira (16 de novembro), os preços da prata (XAGUSD) ampliaram sua recente trajetória de queda, recuando pelo terceiro pregão consecutivo e caindo quase 3% no
Autor  TradingKey
Ontem 09: 26
TradingKey - Na sessão asiática de segunda-feira (16 de novembro), os preços da prata (XAGUSD) ampliaram sua recente trajetória de queda, recuando pelo terceiro pregão consecutivo e caindo quase 3% no
Produtos relacionados
goTop
quote