


Gold steadies after sharp drop as traders assess Fed outlook, Middle East risks
- Gold attracts some buying after touching a seven-week low on Monday.
- Elevated US Treasury yields and hawkish Fed expectations keep upside limited.
- The daily technical picture remains bearish, with the RSI approaching oversold territory.
Gold (XAU/USD) steadies on Tuesday after suffering a sharp sell-off at the start of the week. The move appears to be a corrective bounce, as the broader narrative remains tied to expectations of further Federal Reserve (Fed) interest rate hikes. At the time of writing, XAU/USD trades around $4,152, up 0.90% on the day.
The precious metal slumped nearly 4% on Monday, touching a low of $4,110, its lowest since August 5. The decline came as US Treasury yields climbed to fresh multi-year highs, increasing the opportunity cost of holding the non-yielding metal.
The benchmark 10-year US Treasury yield holds near 5.24%, slightly below Monday’s peak of 5.27%, its highest level since 2007. The recent bond sell-off has been largely driven by heightened inflation concerns as the US-Iran standoff over the Strait of Hormuz keeps Oil prices elevated.
In the latest developments, Iranian Foreign Minister Abbas Araghchi said Tehran held indirect talks with the United States through Qatari mediators in New York. Iran is awaiting Washington’s formal response to its proposal to reopen the Strait of Hormuz.
Meanwhile, US President Donald Trump denied reports from Axios and CNN that his administration had offered Iran sanctions relief and access to frozen funds. Trump said Washington had offered Tehran “nothing” to end the war.
Both sides remain far apart on key issues, while Tehran has stressed that it will not soften its conditions. With the conflict already in its eighth month, the lack of progress suggests that disruptions around the Strait of Hormuz could persist for longer.
Against this backdrop, traders expect the Fed to continue raising interest rates after delivering a 25-basis-point (bps) increase earlier this month. According to the CME FedWatch Tool, markets are pricing in around a 72% probability of another rate hike in October.
The US Dollar remains firmly supported by the hawkish Fed outlook. The US Dollar Index (DXY), which tracks the Greenback’s value against a basket of six major currencies, trades around around 101.40, near two-month highs. A stronger US Dollar makes Gold more expensive for buyers using other currencies.
Traders now brace for a data-heavy week, starting on Tuesday with the US Conference Board Consumer Confidence Index for September and JOLTS Job Openings data for August. Several Fed policymakers are also scheduled to speak. Later this week, attention will turn to the Personal Consumption Expenditures (PCE) Price Index, ISM Manufacturing Purchasing Managers’ Index (PMI) and Nonfarm Payrolls (NFP) report.
Technical Analysis: Bears retain control as RSI nears oversold territory
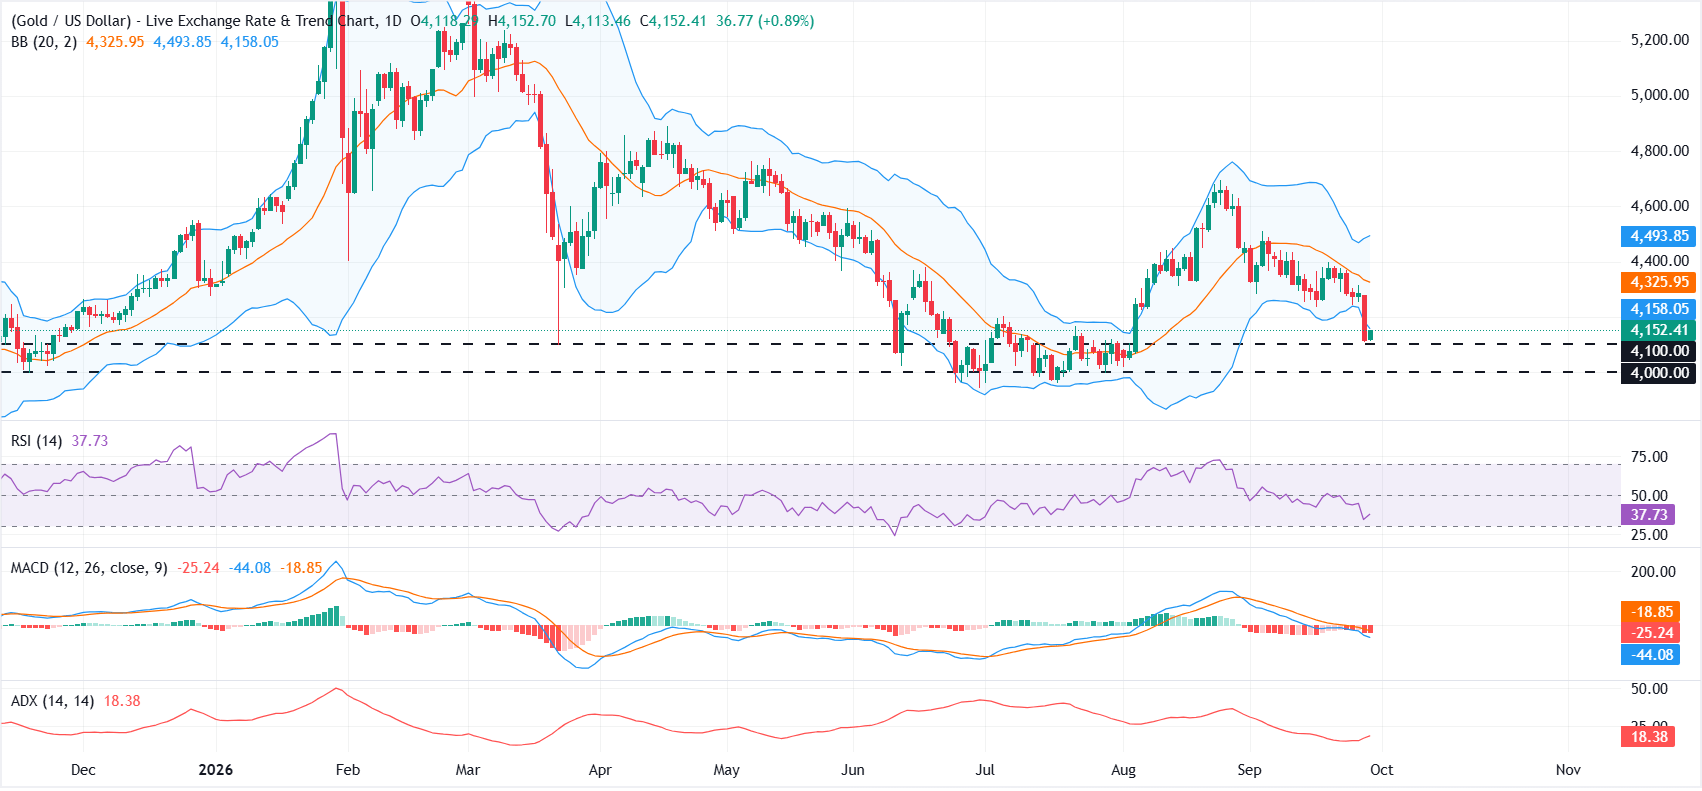
On the daily chart, XAU/USD remains bearish in the near term as spot stays capped beneath the Bollinger Bands’ lower, middle, and upper lines.
Momentum indicators reinforce downside risk: The 14-period Relative Strength Index (RSI) at 37 hovers just above oversold territory, and the Moving Average Convergence Divergence (MACD) stays firmly in negative ground, hinting at persistent selling pressure despite a relatively modest Average Directional Index (ADX) reading of 18, which points to a weak trend.
On the topside, initial resistance emerges at the Bollinger lower band near $4,157, followed by the Bollinger simple moving average (SMA) middle band at $4,325 and then the upper band at $4,494, a cluster that would need to be reclaimed to ease the current bearish bias.
On the downside, underlying demand is seen at the horizontal support levels of $4,100 and $4,000, where a sustained break lower would open the door to a deeper corrective leg, while holding above these floors could allow for short-covering attempts toward the nearby Bollinger barriers.
(The technical analysis of this story was written with the help of an AI tool. Know more.)
Inflation FAQs
Inflation measures the rise in the price of a representative basket of goods and services. Headline inflation is usually expressed as a percentage change on a month-on-month (MoM) and year-on-year (YoY) basis. Core inflation excludes more volatile elements such as food and fuel which can fluctuate because of geopolitical and seasonal factors. Core inflation is the figure economists focus on and is the level targeted by central banks, which are mandated to keep inflation at a manageable level, usually around 2%.
The Consumer Price Index (CPI) measures the change in prices of a basket of goods and services over a period of time. It is usually expressed as a percentage change on a month-on-month (MoM) and year-on-year (YoY) basis. Core CPI is the figure targeted by central banks as it excludes volatile food and fuel inputs. When Core CPI rises above 2% it usually results in higher interest rates and vice versa when it falls below 2%. Since higher interest rates are positive for a currency, higher inflation usually results in a stronger currency. The opposite is true when inflation falls.
Although it may seem counter-intuitive, high inflation in a country pushes up the value of its currency and vice versa for lower inflation. This is because the central bank will normally raise interest rates to combat the higher inflation, which attract more global capital inflows from investors looking for a lucrative place to park their money.
Formerly, Gold was the asset investors turned to in times of high inflation because it preserved its value, and whilst investors will often still buy Gold for its safe-haven properties in times of extreme market turmoil, this is not the case most of the time. This is because when inflation is high, central banks will put up interest rates to combat it. Higher interest rates are negative for Gold because they increase the opportunity-cost of holding Gold vis-a-vis an interest-bearing asset or placing the money in a cash deposit account. On the flipside, lower inflation tends to be positive for Gold as it brings interest rates down, making the bright metal a more viable investment alternative.
Artigos Recomendados


