
AUD/JPY Price Forecast: Consolidates above 94.30 as Trump announces ceasefire in Middle East
- AUD/JPY consolidates for third day but lifts 0.21% as high-beta FX gain on peace news.
- Trump confirms full ceasefire between Israel and Iran via social post.
- Pair eyes June high at 94.83; break above 95.00 could expose 97.32 and 99.15 YTD peak.
The AUD/JPY consolidates within the 93.80-94.70 range for the third straight trading day, yet it is slightly up 0.21%, trading at 94.35 as Tuesday’s Asian session begins.
Breaking news revealed that US President Donald Trump posted on his social network that Israel and Iran had fully agreed to a total ceasefire, which would end the 12-day WAR, as he called it. Consequently, high-beta currencies like the Australian Dollar, the New Zealand Dollar, and the Canadian Dollar are set to appreciate against safe-haven peers.
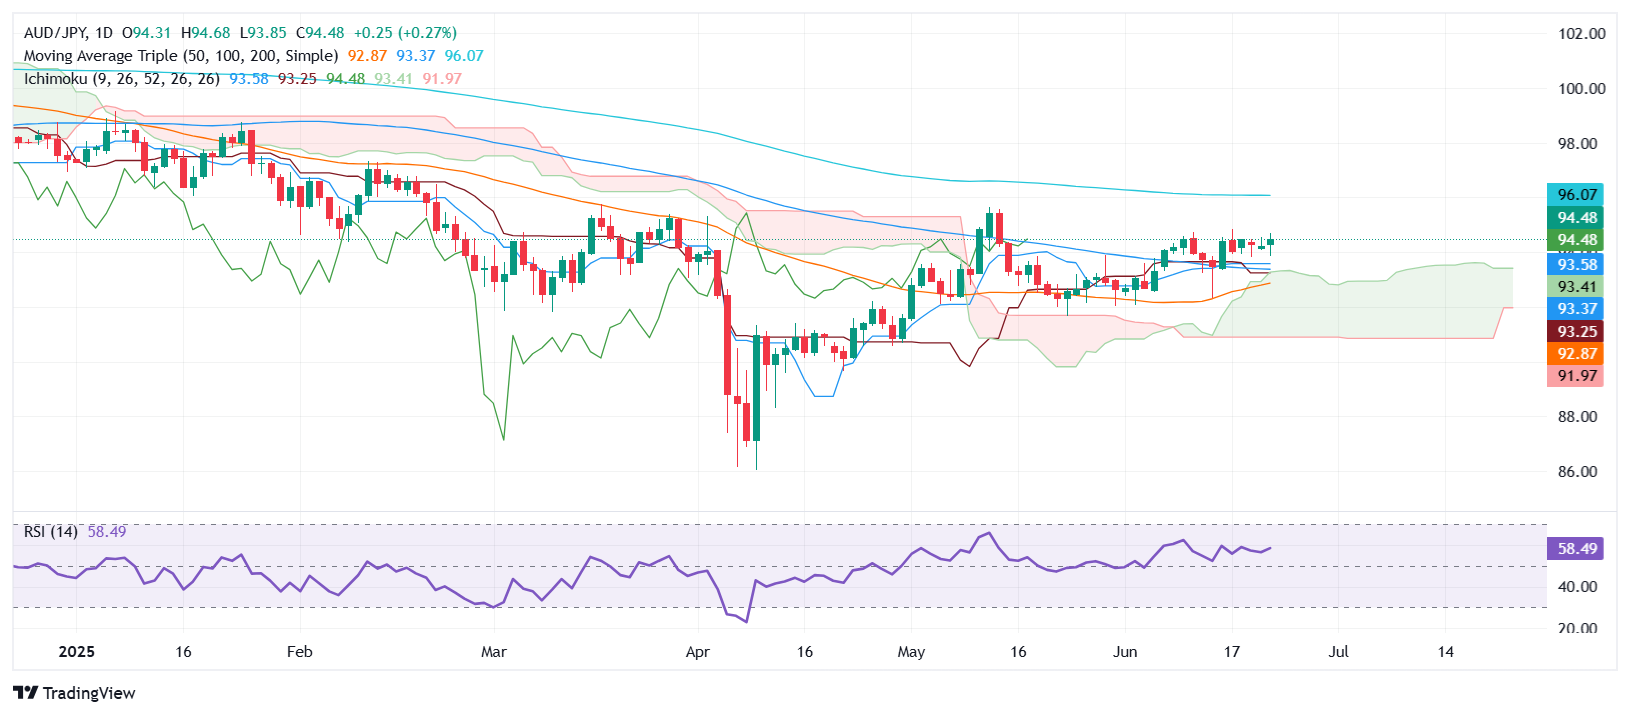
AUD/JPY Price Forecast: Technical outlook
The AUD/JPY is poised to continue trading sideways, although buyers appear to be gaining momentum. The Relative Strength Index (RSI) is bullish, but shy of cracking the latest peak, which would further increase bulls’ chances of seeing higher prices.
If AUD/JPY climbs past June monthly high of 94.83, expect a test of 95.00. A break above will expose the May 13 high ot 95.64, which, if decisively cleared, opens the door for further upside. The next immediate zone of interest will be the February 12 high of 97.32, before challenging the YTD high at 99.15.
On the flip side, AUD/JPY failure to clear 95.00, expect a pullback that could drag the exchange rate to the Kijun-sen at 93.77, followed by the Tenkan-sen at 93.56, ahead of the Senkou Span A at 93.40.
AUD/JPY Price Chart - Daily
Australian Dollar PRICE This week
The table below shows the percentage change of Australian Dollar (AUD) against listed major currencies this week. Australian Dollar was the strongest against the US Dollar.
| USD | EUR | GBP | JPY | CAD | AUD | NZD | CHF | |
|---|---|---|---|---|---|---|---|---|
| USD | -0.13% | -0.10% | -0.12% | -0.01% | -0.23% | -0.19% | 0.13% | |
| EUR | 0.13% | -0.01% | -0.03% | 0.11% | -0.10% | -0.50% | 0.27% | |
| GBP | 0.10% | 0.01% | -0.04% | 0.13% | -0.09% | -0.48% | 0.13% | |
| JPY | 0.12% | 0.03% | 0.04% | 0.13% | -0.14% | -0.09% | 0.15% | |
| CAD | 0.00% | -0.11% | -0.13% | -0.13% | -0.23% | -0.61% | 0.00% | |
| AUD | 0.23% | 0.10% | 0.09% | 0.14% | 0.23% | -0.39% | 0.22% | |
| NZD | 0.19% | 0.50% | 0.48% | 0.09% | 0.61% | 0.39% | 0.62% | |
| CHF | -0.13% | -0.27% | -0.13% | -0.15% | -0.00% | -0.22% | -0.62% |
The heat map shows percentage changes of major currencies against each other. The base currency is picked from the left column, while the quote currency is picked from the top row. For example, if you pick the Australian Dollar from the left column and move along the horizontal line to the US Dollar, the percentage change displayed in the box will represent AUD (base)/USD (quote).
Artigos Recomendados


