EUR/USD Price Forecast: Hovers near 1.0500 post-ECB’s rate cut

Fonte Fxstreet
  • EUR/USD remains tethered to the 1.0500 mark, rebounding slightly to 1.0498 after testing weekly lows.
  • Technical analysis shows the pair is in a delicate balance, with potential to challenge resistance if it sustains above 1.0500.
  • Key resistances are set at 1.0530 and 1.0600, while supports loom near 1.0452 and the YTD low of 1.0331.

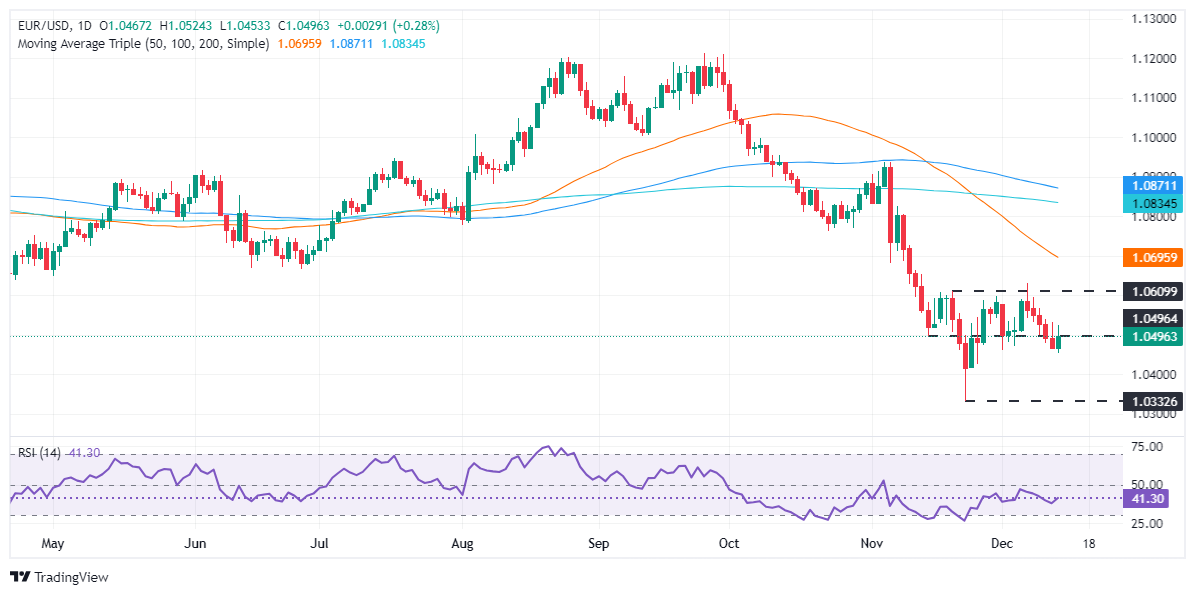
The EUR/USD remains reluctant to remain far from the 1.0500 figure for the fifth consecutive day, even though the ECB decided to cut rates on Thursday, which pushed the pair toward its weekly low of 1.0452. Nevertheless, buyers stepped in and lifted the exchange rate toward the current level of 1.0498.

EUR/USD Price Forecast: Technical outlook

The EUR/USD daily chart suggests the pair hovers near 1.0500, unable to edge lower decisively and retest year-to-date (YTD) low figures at 1.0331. Even though the pair is carving successive series of lower and lower highs, it might be difficult to extend its downtrend.

Momentum, as measured by the Relative Strength Index (RSI), suggests that buyers gain steam. If they achieve a daily close above 1.0500, this can give them a leg-up.

In that outcome, EUR/USD’s key resistance levels lie at the December 12 high of 1.0530, followed by 1.0600 and last week's peak of 1.0629.

On the other hand, if EUR/USD remains below 1.0500, the major could extend its losses, past 1.0452. A breach of the latter will expose the November 26 low of 1.0424, followed by the November 22 swing low of 1.0331.

EUR/USD Price Chart – Daily
Euro PRICE Today

The table below shows the percentage change of Euro (EUR) against listed major currencies today. Euro was the strongest against the Japanese Yen.

  USD EUR GBP JPY CAD AUD NZD CHF
USD   -0.28% 0.41% 0.68% 0.02% 0.11% 0.13% 0.05%
EUR 0.28%   0.69% 0.97% 0.30% 0.40% 0.41% 0.33%
GBP -0.41% -0.69%   0.27% -0.38% -0.30% -0.28% -0.36%
JPY -0.68% -0.97% -0.27%   -0.64% -0.57% -0.55% -0.62%
CAD -0.02% -0.30% 0.38% 0.64%   0.08% 0.11% 0.03%
AUD -0.11% -0.40% 0.30% 0.57% -0.08%   0.02% -0.06%
NZD -0.13% -0.41% 0.28% 0.55% -0.11% -0.02%   -0.08%
CHF -0.05% -0.33% 0.36% 0.62% -0.03% 0.06% 0.08%  

The heat map shows percentage changes of major currencies against each other. The base currency is picked from the left column, while the quote currency is picked from the top row. For example, if you pick the Euro from the left column and move along the horizontal line to the US Dollar, the percentage change displayed in the box will represent EUR (base)/USD (quote).


Isenção de responsabilidade: Apenas para fins informativos. O desempenho passado não é indicativo de resultados futuros.
placeholder
Ibovespa sobe 0,77% e fecha em 155 mil pontos, um novo recordeO Ibovespa emplacou sua 14ª sessão consecutiva de alta nesta segunda-feira (10), impulsionado pelo viés positivo no exterior, e renovou suas máximas históricas.
Autor  Pedro Augusto Prazeres
11 Mês 11 Dia Ter
O Ibovespa emplacou sua 14ª sessão consecutiva de alta nesta segunda-feira (10), impulsionado pelo viés positivo no exterior, e renovou suas máximas históricas.
placeholder
Petróleo sobe com geopolítica; Ouro recua levemente mas segura US$ 4.000 com dados de empregoOs contratos futuros de petróleo fecharam em alta nesta terça-feira (18), em uma sessão marcada pela volatilidade. Os preços do WTI para janeiro subiram 1,35%, encerrando a US$ 60,67 o barril na Nymex, enquanto o Brent para o mesmo mês avançou 1,07%, cotado a US$ 64,89 o barril na ICE.
Autor  Pedro Augusto Prazeres
11 Mês 19 Dia Qua
Os contratos futuros de petróleo fecharam em alta nesta terça-feira (18), em uma sessão marcada pela volatilidade. Os preços do WTI para janeiro subiram 1,35%, encerrando a US$ 60,67 o barril na Nymex, enquanto o Brent para o mesmo mês avançou 1,07%, cotado a US$ 64,89 o barril na ICE.
placeholder
Bitcoin (BTC) cai a US$ 80 mil e confirma "Cruz da Morte"; perdas realizadas superam nível do colapso da FTXO Bitcoin (BTC) pode ter confirmado sua entrada oficial em um mercado de baixa ("bear market") após o preço despencar para a região de US$ 80.000 nesta sexta-feira (21). Essa visão pessimista é reforçada por uma convergência rara de indicadores técnicos negativos.
Autor  Pedro Augusto Prazeres
Ontem 01: 48
O Bitcoin (BTC) pode ter confirmado sua entrada oficial em um mercado de baixa ("bear market") após o preço despencar para a região de US$ 80.000 nesta sexta-feira (21). Essa visão pessimista é reforçada por uma convergência rara de indicadores técnicos negativos.
placeholder
Grupo Mateus (GMAT3) estende quedas; CVC (CVCB3) desaba 7,6% com dólar a R$ 5,40 e tensão políticaAs ações do Grupo Mateus (GMAT3) registraram queda pela sétima sessão consecutiva nesta sexta-feira (21). O movimento estende uma sequência negativa que já acumula perdas de cerca de 25% no período.
Autor  Pedro Augusto Prazeres
Ontem 01: 52
As ações do Grupo Mateus (GMAT3) registraram queda pela sétima sessão consecutiva nesta sexta-feira (21). O movimento estende uma sequência negativa que já acumula perdas de cerca de 25% no período.
placeholder
O ouro recua em meio à valorização do dólar americano e ao apetite por risco; potencial de queda parece limitadoO ouro (XAU/USD) atrai novos vendedores durante a sessão asiática desta segunda-feira e recua para abaixo do nível de US$ 4.050 na última hora, embora sem continuidade no movimento.
Autor  FXStreet
Ontem 05: 53
O ouro (XAU/USD) atrai novos vendedores durante a sessão asiática desta segunda-feira e recua para abaixo do nível de US$ 4.050 na última hora, embora sem continuidade no movimento.
Produtos relacionados
goTop
quote