

EUR/USD Price Forecast: Bears crack 100-day SMA, eye 1.1500

Fonte Fxstreet
  • EUR/USD breaks 100-day SMA as sellers regain momentum.
  • Bearish RSI points lower while 50-day SMA guards downside.
  • Break below 1.1500 exposes 1.1450 and 1.1353 next.

The Euro extends its losses against the US Dollar, sliding below the 100-day Simple Moving Average (SMA) at 1.1555, opening the door to further downside, with sellers setting their sights on Monday’s low of 1.1523. The EUR/USD trades at 1.1548, slightly above the 50-day SMA of 1.1530.

EUR/USD Price Forecast: Technical Outlook

The pair seems poised to consolidate in the short-term, finding support at the 50-day SMA, but the rally was capped by the 100-day SMA. Momentum, as measured by the Relative Strength Index (RSI), is bearish and trending lower, indicating that sellers are strengthening.

If the EUR/USD dives below the 50-day SMA, it opens the door to challenge 1.1500. A breach of the latter will expose the 1.1450 psychological milestone and the July 28 swing low at 1.1353. On further weakness. The year-to-date (YTD) high is up next at 1.1324.

On the other hand, if EUR/USD is set for a recovery, buyers must reclaim the 100-day SMA at 1.1555. On further strength, the next area of interest is 1.1600, immediately followed by the 200-day SMA at 1.1632 and by 1.1650.

EUR/USD Price Chart – Daily
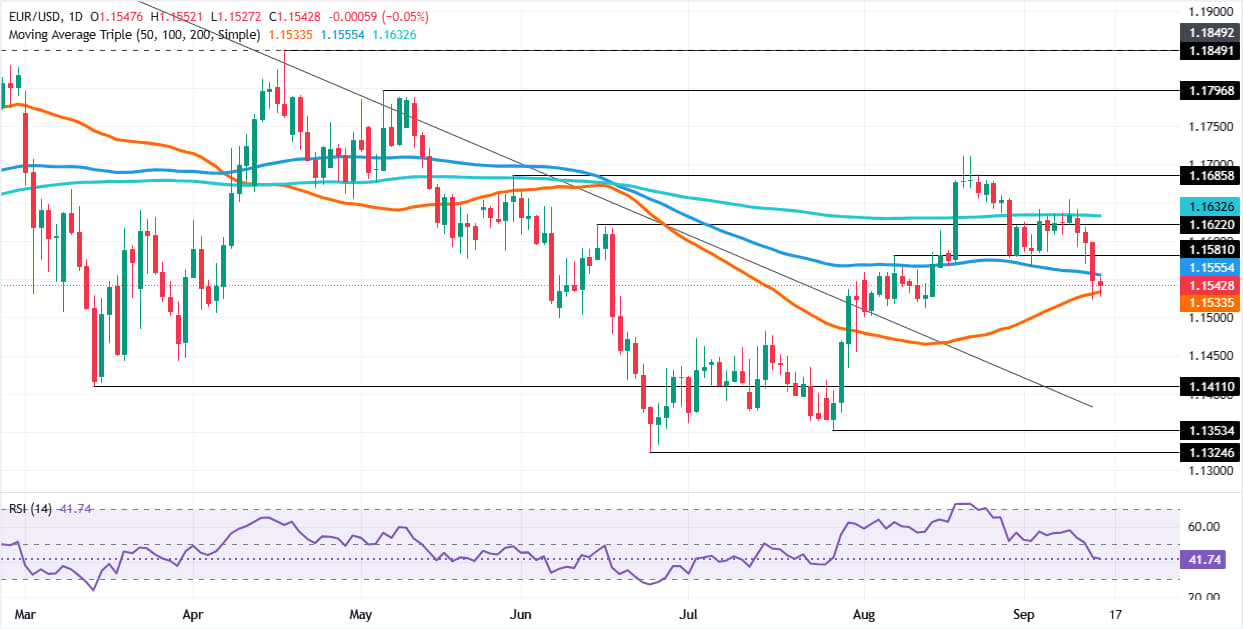
EUR/USD daily chart

Euro Price Today

The table below shows the percentage change of Euro (EUR) against listed major currencies today. Euro was the strongest against the Japanese Yen.

USD EUR GBP JPY CAD AUD NZD CHF
USD 0.05% 0.14% 0.50% 0.10% 0.12% 0.37% 0.15%
EUR -0.05% 0.09% 0.41% 0.05% 0.06% 0.31% 0.10%
GBP -0.14% -0.09% 0.33% -0.06% -0.03% 0.19% 0.00%
JPY -0.50% -0.41% -0.33% -0.38% -0.37% -0.13% -0.33%
CAD -0.10% -0.05% 0.06% 0.38% 0.01% 0.26% 0.05%
AUD -0.12% -0.06% 0.03% 0.37% -0.01% 0.24% 0.02%
NZD -0.37% -0.31% -0.19% 0.13% -0.26% -0.24% -0.20%
CHF -0.15% -0.10% -0.00% 0.33% -0.05% -0.02% 0.20%

The heat map shows percentage changes of major currencies against each other. The base currency is picked from the left column, while the quote currency is picked from the top row. For example, if you pick the Euro from the left column and move along the horizontal line to the US Dollar, the percentage change displayed in the box will represent EUR (base)/USD (quote).

Isenção de responsabilidade: Apenas para fins informativos. O desempenho passado não é indicativo de resultados futuros.
placeholder
Previsão do Preço das Ações da Tesla: As Ações da TSLA Podem Ter um Novo Rally com a Aproximação do Lançamento do Roadster de Nova Geração?A Tesla (TSLA) está prestes a realizar o altamente antecipado lançamento de um novo veículo.A Tesla declarou que a nova geração do Roadster, originalmente prevista para estrear oficialmen
Autor  TradingKey
10 Mês 01 Dia Qui
A Tesla (TSLA) está prestes a realizar o altamente antecipado lançamento de um novo veículo.A Tesla declarou que a nova geração do Roadster, originalmente prevista para estrear oficialmen
placeholder
Receita de Aplicativos Onchain Registra o Melhor Mês de 2026 com Solana na LiderançaSetembro viu aplicativos onchain gerar mais receita do que em qualquer outro mês deste ano. Entre as 356 cadeias rastreadas pela DefiLlama, a receita dos aplicativos atingiu US$ 467,66 milhões durante o mês, um aumento de cerca de 27% em relação ao mês anterior e o maior desde outubro do ano passado. A Solana foi a líder, respondendo por US$ 144,25 milhões,...
Autor  Cryptopolitan
10 Mês 02 Dia Sex
Setembro viu aplicativos onchain gerar mais receita do que em qualquer outro mês deste ano. Entre as 356 cadeias rastreadas pela DefiLlama, a receita dos aplicativos atingiu US$ 467,66 milhões durante o mês, um aumento de cerca de 27% em relação ao mês anterior e o maior desde outubro do ano passado. A Solana foi a líder, respondendo por US$ 144,25 milhões,...
placeholder
Preços do ouro retomam impulso de alta, prestes a voltar ao mercado de alta: quais ações de ouro valem a pena acompanhar?TradingKey - Em agosto, os preços do ouro (XAUUSD) continuaram a se recuperar de perto de US$ 4.000 e chegaram a se aproximar de US$ 4.700. Com o rompimento do nível chave de resistência de US$ 4.500,
Autor  TradingKey
10 Mês 05 Dia Seg
TradingKey - Em agosto, os preços do ouro (XAUUSD) continuaram a se recuperar de perto de US$ 4.000 e chegaram a se aproximar de US$ 4.700. Com o rompimento do nível chave de resistência de US$ 4.500,
placeholder
Gold holds steady below $4,150 amid elevated US yields Gold price (XAU/USD) trades on a flat note near $4,140 during the early Asian session on Tuesday. Pressure from a stronger US Dollar (USD) and elevated US Treasury yields was offset by reduced expectations of a Federal Reserve (Fed) rate hike this month.
Autor  FXStreet
Ontem 02: 24
Gold price (XAU/USD) trades on a flat note near $4,140 during the early Asian session on Tuesday. Pressure from a stronger US Dollar (USD) and elevated US Treasury yields was offset by reduced expectations of a Federal Reserve (Fed) rate hike this month.
placeholder
Japanese Yen drifts lower as sustained USD buying offsets intervention fearsThe USD/JPY pair attracts some buyers following the previous day's two-day price moves, trading above the 158.00 mark during the early part of the European session on Tuesday.
Autor  FXStreet
Ontem 08: 03
The USD/JPY pair attracts some buyers following the previous day's two-day price moves, trading above the 158.00 mark during the early part of the European session on Tuesday.
Produtos relacionados
goTop
quote