


GBP/JPY Price Forecast: Bulls recover lost ground as intervention effect wears off
- GBP/JPY builds on its recovery following the sharp intervention-led pullback.
- Japan’s fiscal outlook and wide interest-rate gap keep the Japanese Yen under pressure.
- Momentum indicators improve, although the daily ADX shows the broader trend lacks strength.
GBP/JPY extends its steady recovery on Tuesday and has now recouped almost all the losses triggered by the joint US-Japan intervention in late July. The intervention was aimed at curbing excessive weakness in the Japanese Yen (JPY) after USD/JPY climbed above 160 to a forty-year high. At the time of writing, the cross trades around 217.10, up 0.12% on the day.
The impact of the intervention proved short-lived. Japan’s expansionary fiscal policy, high government debt and wide interest-rate gap with other major economies remain persistent headwinds for the Japanese Yen. As a result, the technical outlook for GBP/JPY stays tilted to the upside.
Looking ahead, the economic calendars in the United Kingdom and Japan are relatively quiet this week. The main release will be Tokyo Consumer Price Index (CPI) data on Friday, which could drive fresh moves in the cross heading into the weekend.
Technical Analysis: 4-hour chart
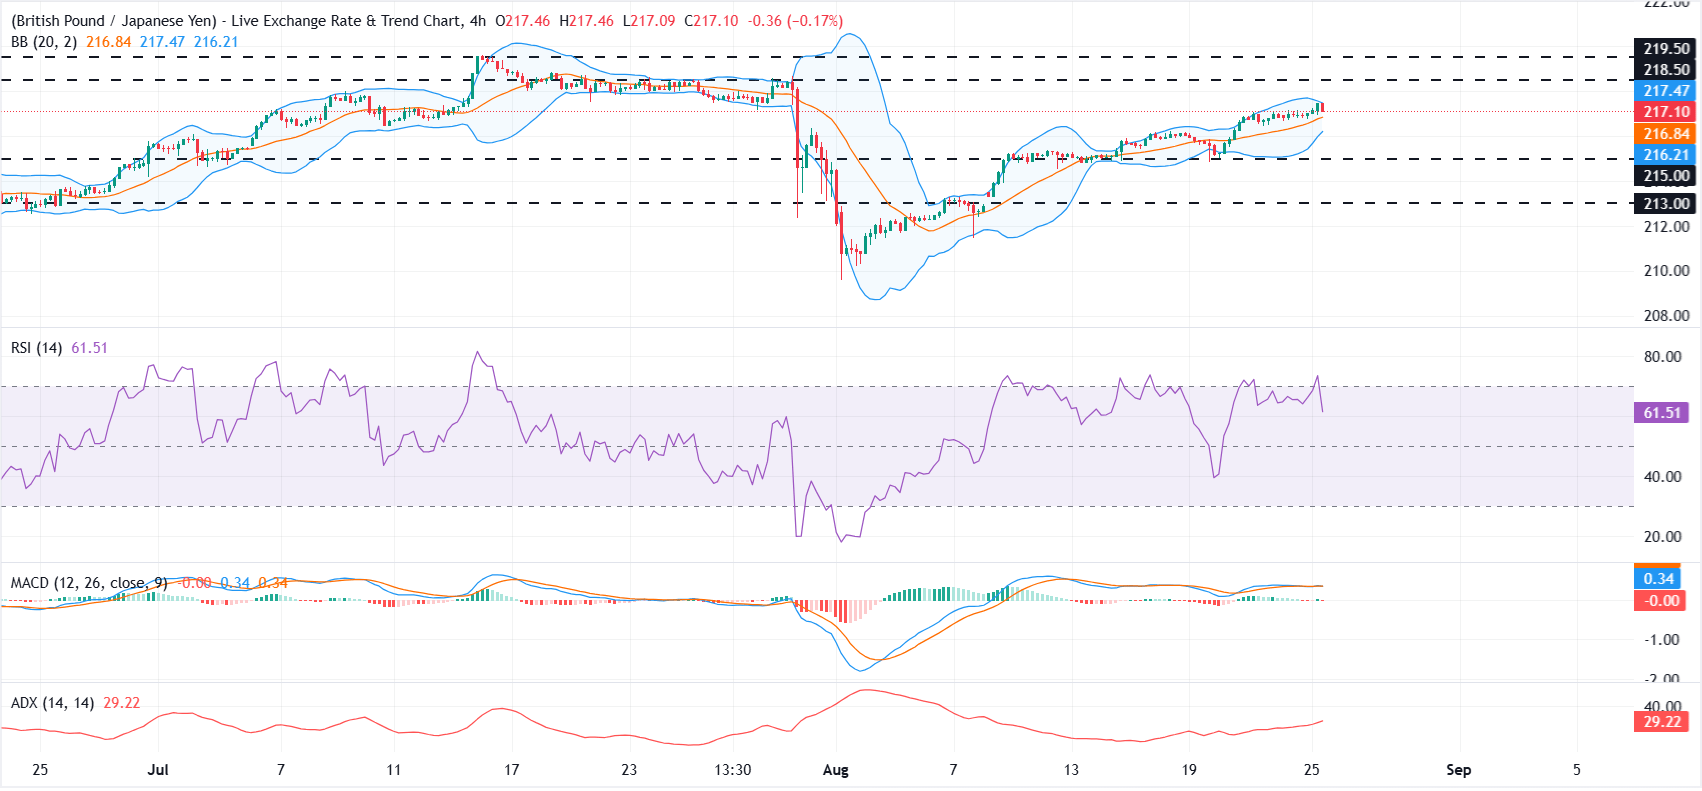
GBP/JPY maintains a mild bullish bias as it holds above the Bollinger Bands’ 20-period simple moving average (SMA) around 216.84 while approaching the upper band near 217.47. The Relative Strength Index (RSI) at 61 suggests firm but not extreme upside momentum, and the Average Directional Index (ADX) near 29 hints at a strengthening trend, even as the Moving Average Convergence Divergence (MACD) hovers flat around the zero line, indicating momentum is positive but not accelerating sharply.
On the topside, immediate resistance emerges at the Bollinger upper band near 217.47, with further barriers at the horizontal levels around 218.50 and 219.50. On the downside, initial support is seen at the mid-Bollinger 20-period SMA around 216.84, ahead of the lower band near 216.21, while deeper cushions align at the horizontal supports near 215.00 and 213.00, levels that would need to give way to seriously undermine the current bullish structure.
Technical Analysis: Daily chart
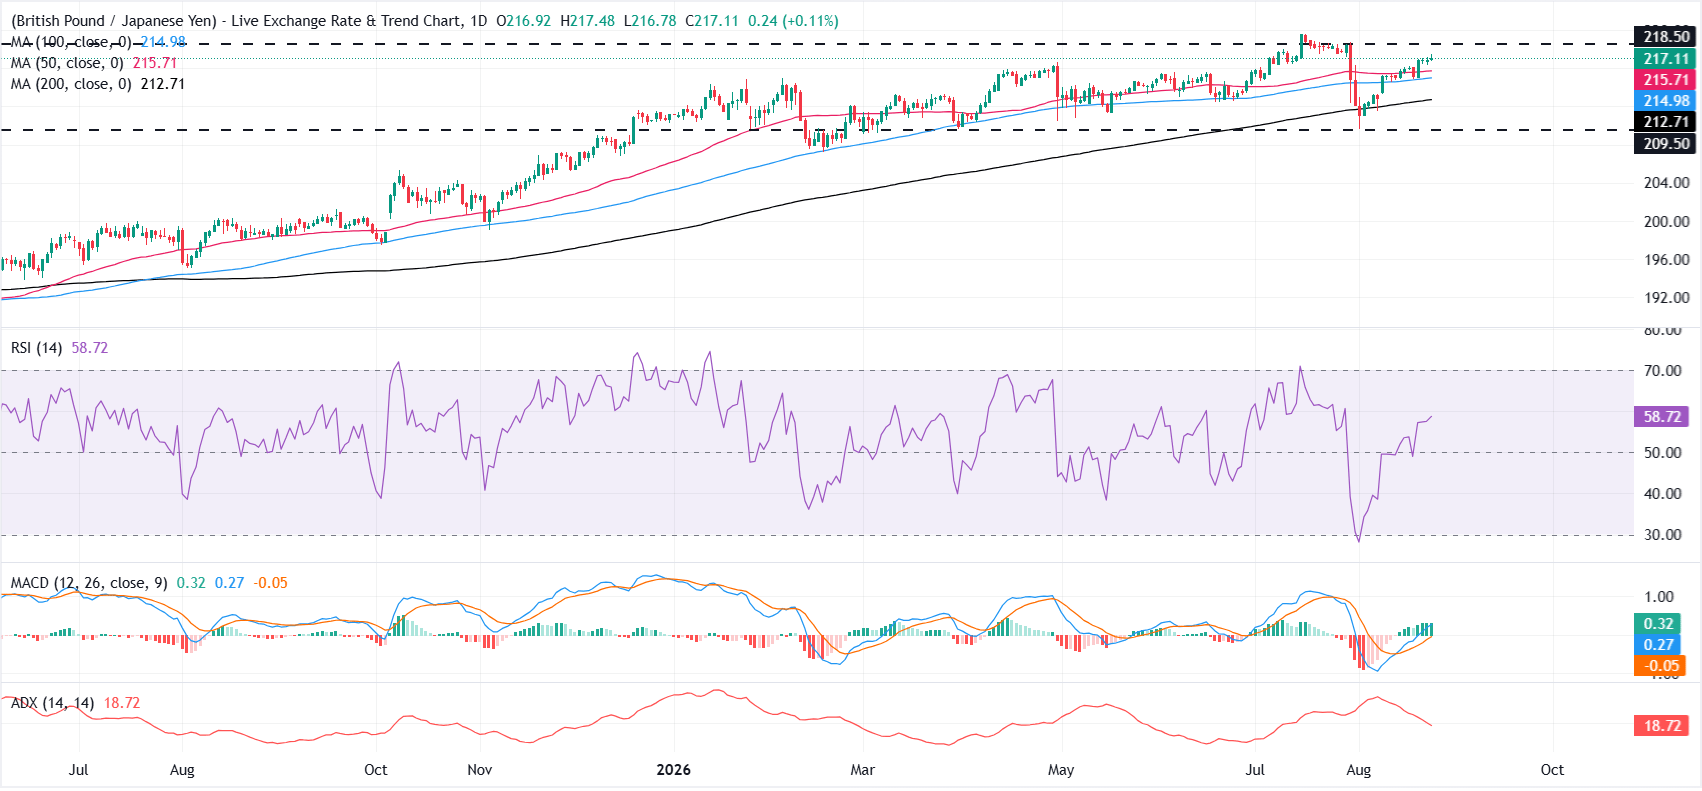
GBP/JPY keeps a constructive bullish bias as it holds above the 50-day, 100-day and 200-day Simple Moving Averages (SMAs). The daily Relative Strength Index (RSI) has recovered from oversold territory to 58, while the Moving Average Convergence Divergence (MACD) line stays above zero and its signal line. This points to improving upside momentum, although the Average Directional Index (ADX) at 18 suggests the broader trend lacks strength.
On the topside, immediate resistance emerges at the horizontal barrier around 218.50, and a daily close above this level would likely open the way for further gains. On the downside, initial support is seen at the 50-day SMA near 216, followed by the 100-day SMA at 215 and the 200-day SMA at 212, with a more distant floor at the prior horizontal support zone near 209.50.
(The technical analysis of this story was written with the help of an AI tool. Know more.)
Japanese Yen FAQs
The Japanese Yen (JPY) is one of the world’s most traded currencies. Its value is broadly determined by the performance of the Japanese economy, but more specifically by the Bank of Japan’s policy, the differential between Japanese and US bond yields, or risk sentiment among traders, among other factors.
One of the Bank of Japan’s mandates is currency control, so its moves are key for the Yen. The BoJ has directly intervened in currency markets sometimes, generally to lower the value of the Yen, although it refrains from doing it often due to political concerns of its main trading partners. The BoJ ultra-loose monetary policy between 2013 and 2024 caused the Yen to depreciate against its main currency peers due to an increasing policy divergence between the Bank of Japan and other main central banks. More recently, the gradually unwinding of this ultra-loose policy has given some support to the Yen.
Over the last decade, the BoJ’s stance of sticking to ultra-loose monetary policy has led to a widening policy divergence with other central banks, particularly with the US Federal Reserve. This supported a widening of the differential between the 10-year US and Japanese bonds, which favored the US Dollar against the Japanese Yen. The BoJ decision in 2024 to gradually abandon the ultra-loose policy, coupled with interest-rate cuts in other major central banks, is narrowing this differential.
The Japanese Yen is often seen as a safe-haven investment. This means that in times of market stress, investors are more likely to put their money in the Japanese currency due to its supposed reliability and stability. Turbulent times are likely to strengthen the Yen’s value against other currencies seen as more risky to invest in.
Artigos Recomendados


