

The British Pound Sterling has the best rate in the G7 and the chart of a laggard
- Sterling sliced through its 200-day average on Friday despite the UK holding the highest policy rate among major economies.
- A central bank that cannot cut because of energy-driven inflation is offering the Pound no protection.
- Friday's growth figures risk exposing a stagflation-lite bind just as the Dollar reprices toward hikes.
Pound Sterling is supposed to be the high-carry name in the G7, and for most of this year that logic held. So it is telling that GBP/USD spent Friday and Monday on the wrong side of its 200-day moving average, a level it had not closed below in weeks, with the Bank of England (BoE) base rate at 3.75% and still the steepest in the developed world. The Pound's problem is not its own central bank. It is that the US is repricing faster in the other direction, and the British economy is starting to look like it cannot afford the rates it is being forced to keep.
When a rate advantage stops mattering
Friday's US Nonfarm Payrolls (NFP) report did the damage: 172K jobs against a consensus near 85K, hefty upward revisions, and a market now pricing roughly 72% odds of higher US rates by December on CME FedWatch, a clear lean toward at least one Federal Reserve (Fed) hike rather than a cut. That repricing lifted the Dollar across the board and pushed Cable down through its 200-period Exponential Moving Average (EMA) near 1.3400, a clean technical break that flips the medium-term tone. A rate gap only supports a currency when the other side is standing still. With the Fed turning hawkish, Sterling's carry edge is shrinking from both ends.
The BoE itself is stuck in an uncomfortable spot. It held at 3.75% in late April on an 8-1 vote, with one member actually pushing for a hike, because the same Middle East energy shock driving global Crude Oil higher is forecast to drag UK inflation back toward 4% before it eases. The central bank has been explicit that it cannot influence energy prices, only the economy's adjustment to them. That leaves it unable to cut into weakness without risking its credibility, the worst of both worlds for a currency.
Friday is the test
Which brings us to the week's main domestic event. The UK releases April Gross Domestic Product (GDP) on Friday alongside industrial and manufacturing production, and the consensus looks for a monthly contraction of around 0.1% after March's gain. A negative print would harden the stagflation-lite narrative: inflation heading up, growth heading down, and a central bank with no clean way out. That is a more dangerous setup for the Pound than a simple growth miss, because it questions whether the rate premium is sustainable at all.
The cross-asset backdrop does Sterling no favours either. US Consumer Price Index (CPI) on Wednesday is forecast at 4.2% YoY, a hot headline juiced by energy, which would reinforce the hawkish-Fed, strong-Dollar theme right before the UK data. The Pound is essentially squeezed between an American inflation problem the Fed wants to fight and a British one the BoE cannot.
Levels and bias
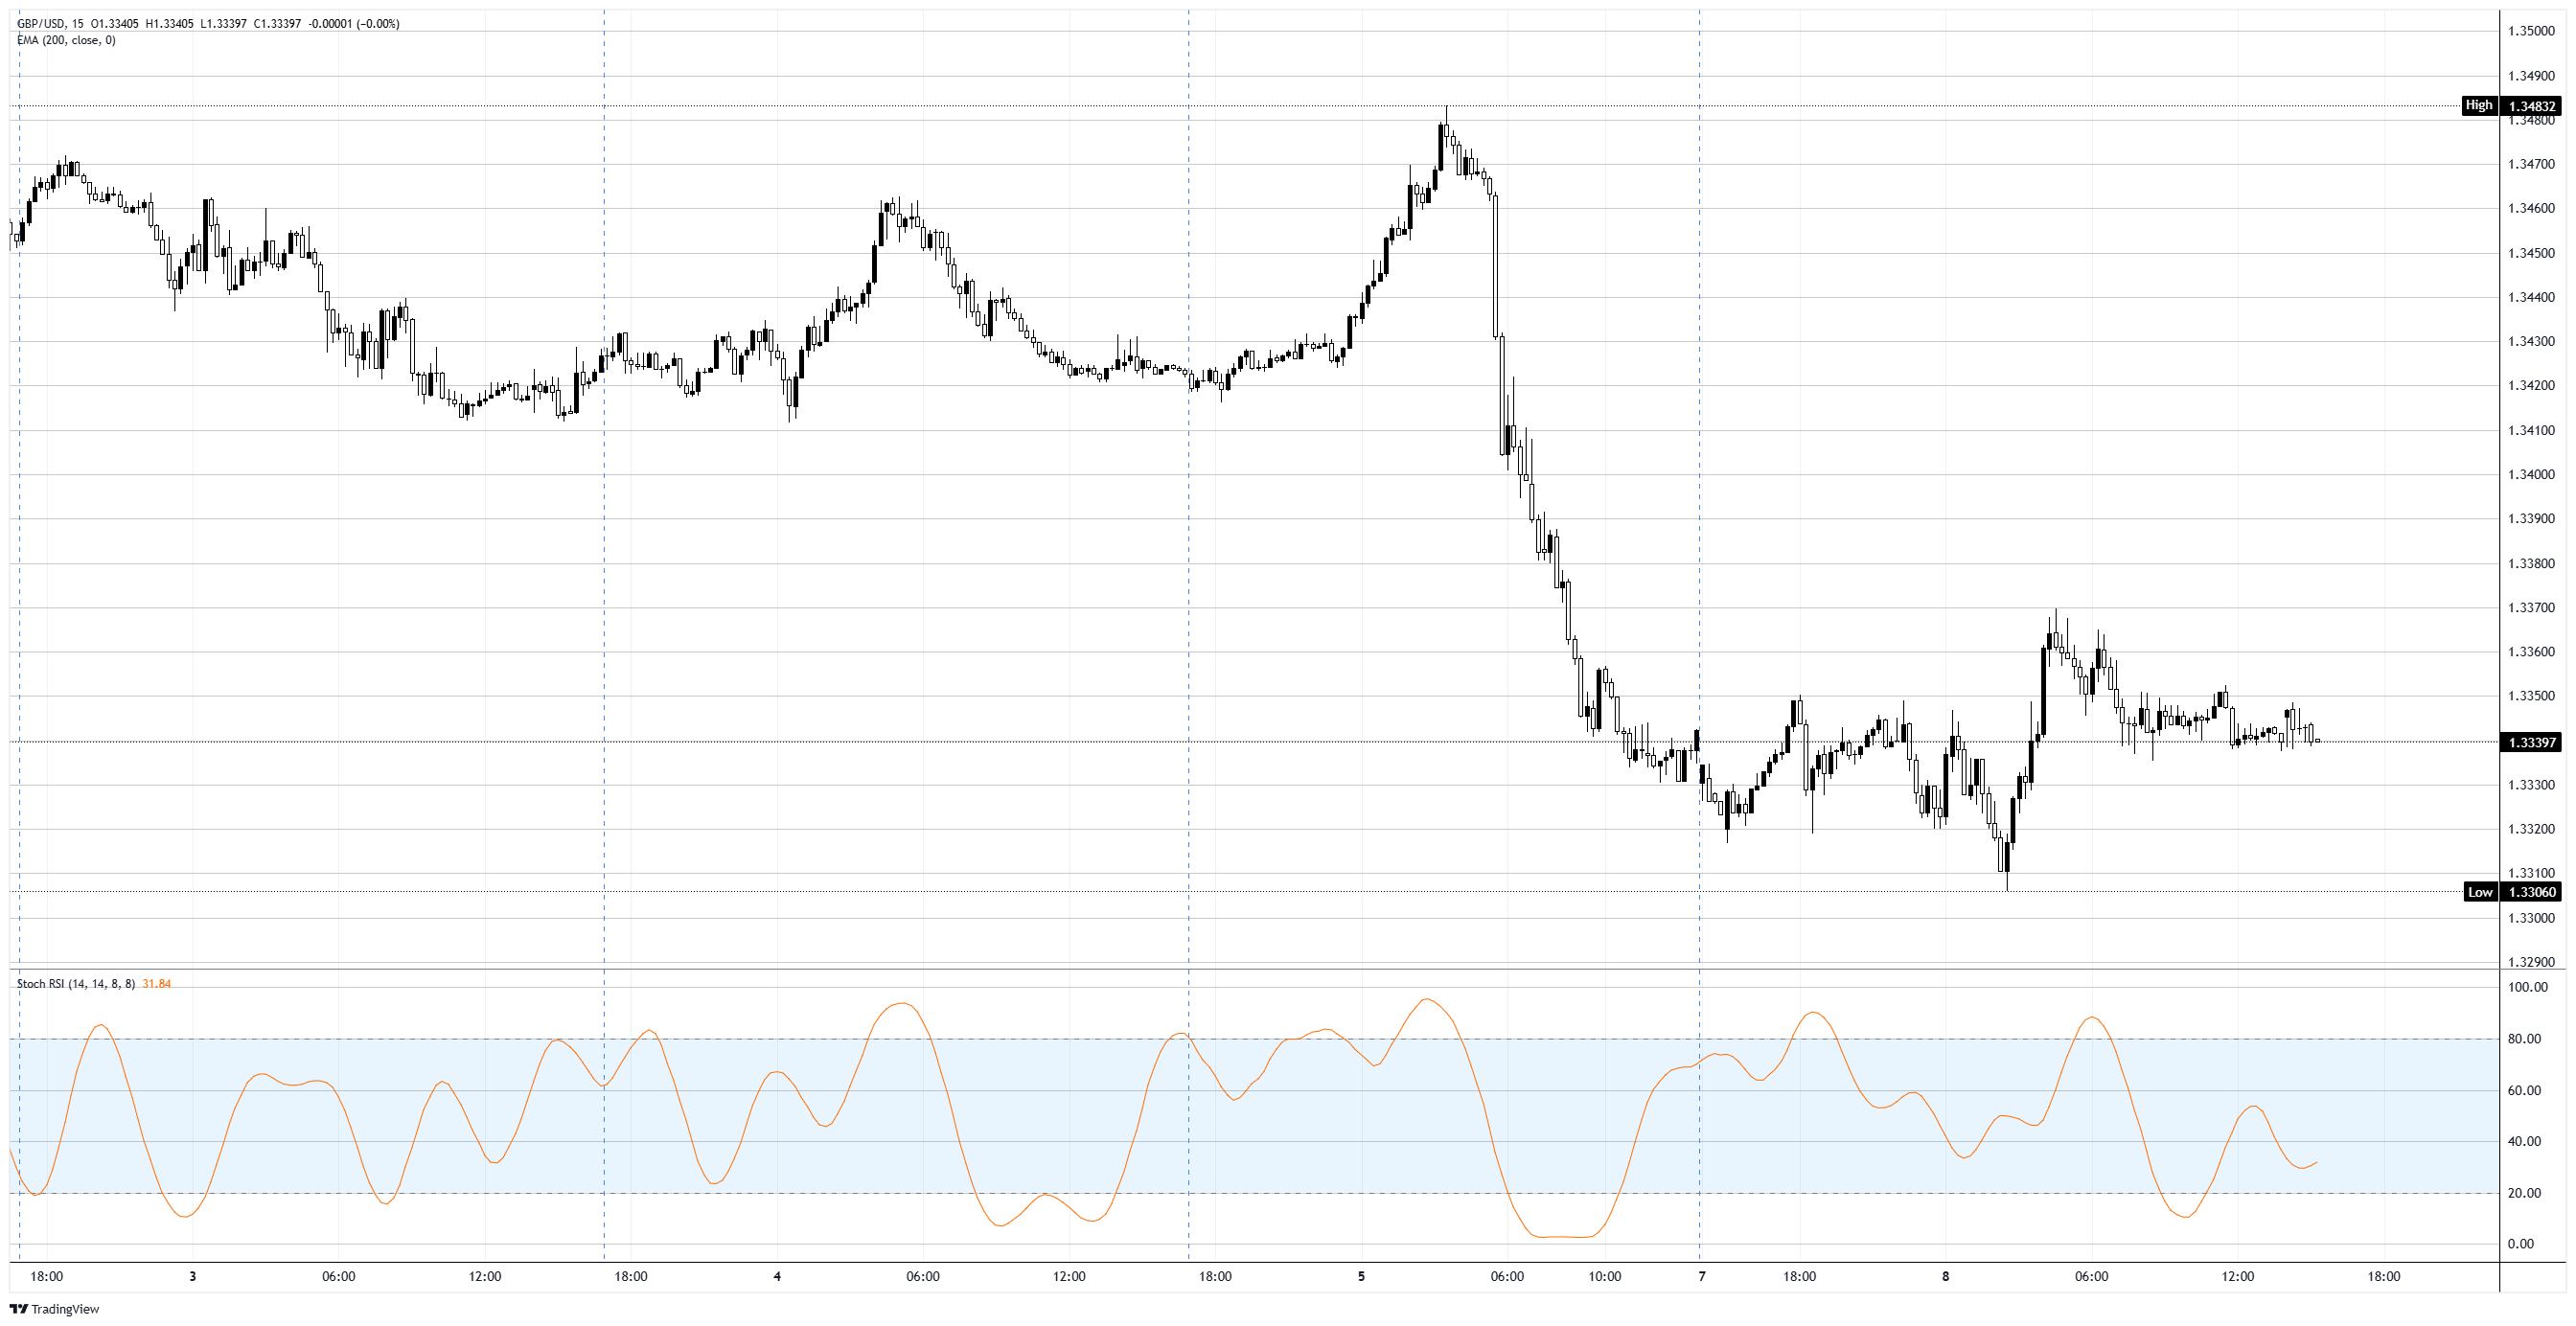
The reclaimed resistance is now the broken 200-day EMA near 1.3400, with 1.3450 and the round 1.3500 handle above. Monday's intraday pop stalled around 1.3350 before fading. On the downside, support sits near 1.3300, then 1.3250. The daily Stochastic Relative Strength Index (Stoch RSI) is mid-range near 52, offering no strong directional steer, which fits a pair waiting on data.
Bias leans modestly bearish while price holds below 1.3400. Rallies into that broken average are the more attractive sells unless Wednesday's US CPI comes in soft, and Friday's UK GDP is the domestic catalyst that could accelerate the move. For now, the highest yield in the G7 is buying the Pound remarkably little.
GBP/USD 15-minute chart
Pound Sterling FAQs
The Pound Sterling (GBP) is the oldest currency in the world (886 AD) and the official currency of the United Kingdom. It is the fourth most traded unit for foreign exchange (FX) in the world, accounting for 12% of all transactions, averaging $630 billion a day, according to 2022 data. Its key trading pairs are GBP/USD, also known as ‘Cable’, which accounts for 11% of FX, GBP/JPY, or the ‘Dragon’ as it is known by traders (3%), and EUR/GBP (2%). The Pound Sterling is issued by the Bank of England (BoE).
The single most important factor influencing the value of the Pound Sterling is monetary policy decided by the Bank of England. The BoE bases its decisions on whether it has achieved its primary goal of “price stability” – a steady inflation rate of around 2%. Its primary tool for achieving this is the adjustment of interest rates. When inflation is too high, the BoE will try to rein it in by raising interest rates, making it more expensive for people and businesses to access credit. This is generally positive for GBP, as higher interest rates make the UK a more attractive place for global investors to park their money. When inflation falls too low it is a sign economic growth is slowing. In this scenario, the BoE will consider lowering interest rates to cheapen credit so businesses will borrow more to invest in growth-generating projects.
Data releases gauge the health of the economy and can impact the value of the Pound Sterling. Indicators such as GDP, Manufacturing and Services PMIs, and employment can all influence the direction of the GBP. A strong economy is good for Sterling. Not only does it attract more foreign investment but it may encourage the BoE to put up interest rates, which will directly strengthen GBP. Otherwise, if economic data is weak, the Pound Sterling is likely to fall.
Another significant data release for the Pound Sterling is the Trade Balance. This indicator measures the difference between what a country earns from its exports and what it spends on imports over a given period. If a country produces highly sought-after exports, its currency will benefit purely from the extra demand created from foreign buyers seeking to purchase these goods. Therefore, a positive net Trade Balance strengthens a currency and vice versa for a negative balance.
Artigos Recomendados


