

Silver Price Forecast: XAG/USD hovers around 50-day EMA above $79.00
- Silver price may fall toward the initial support at the nine-day EMA at $78.96.
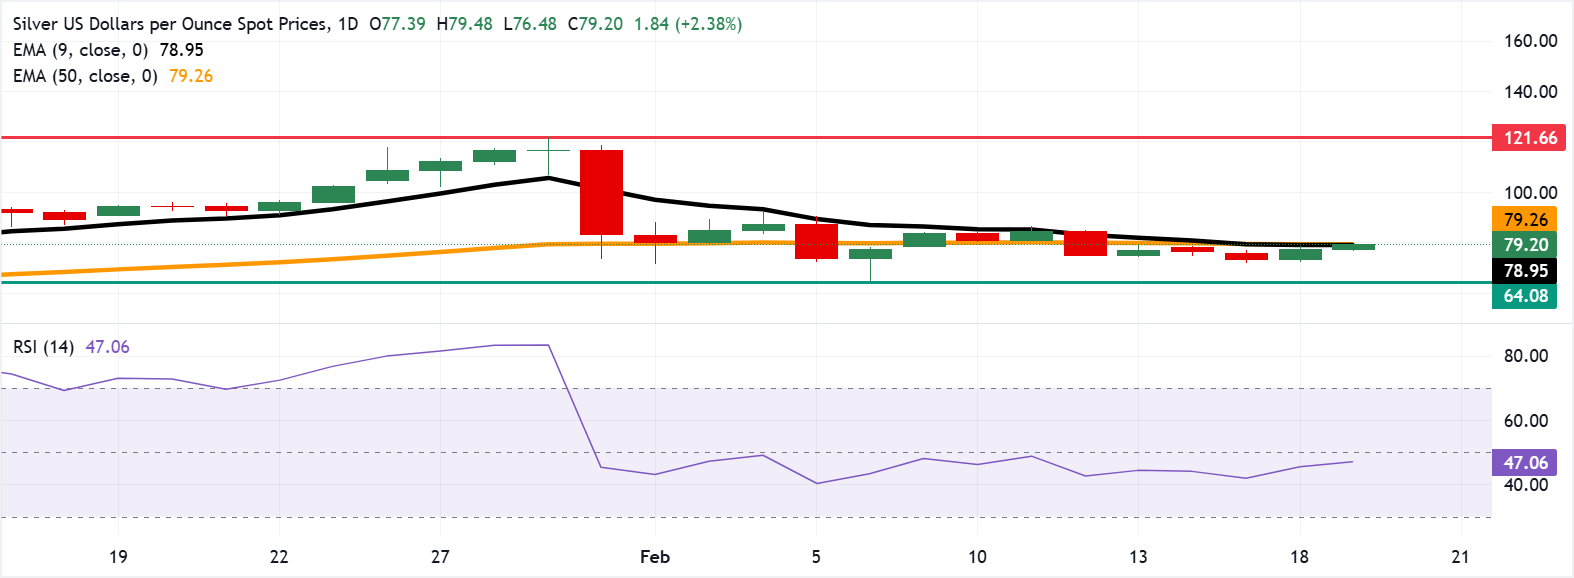
- XAG/USD trades between the 50-day and nine-day EMAs, remaining rangebound near key levels.
- A daily close above the 50-day EMA at $79.26 may push Silver toward its $121.66 record high.
Silver price (XAG/USD) extends its gains for the second successive session, trading around $79.20 per troy ounce during the European hours on Thursday. The technical analysis of the daily chart timeframe shows that the 14-day Relative Strength Index (RSI) at 47 (neutral) is edging higher, indicating momentum is stabilizing.
Silver price hovers just below the 50-day Exponential Moving Average (EMA) while holding above the nine-day EMA, keeping it contained between near-term guides. The short-term average is starting to turn up as the 50-day line flattens, pointing to a base formation. Until either side yields, price action would remain range-bound around the moving averages.
A break back below the nine-day EMA at $78.95 would risk renewed weakness toward support at the nine-week low of $64.08, recorded on February 6, followed by the lower descending wedge boundary around $59.10.
On the upside, the Silver price is testing the immediate barrier at the 50-day EMA at $79.26. A daily close above the medium-term average could reinforce momentum and support the XAG/USD pair to explore the region around the record high of $121.66, reached on January 29.
(The technical analysis of this story was written with the help of an AI tool.)
Silver FAQs
Silver is a precious metal highly traded among investors. It has been historically used as a store of value and a medium of exchange. Although less popular than Gold, traders may turn to Silver to diversify their investment portfolio, for its intrinsic value or as a potential hedge during high-inflation periods. Investors can buy physical Silver, in coins or in bars, or trade it through vehicles such as Exchange Traded Funds, which track its price on international markets.
Silver prices can move due to a wide range of factors. Geopolitical instability or fears of a deep recession can make Silver price escalate due to its safe-haven status, although to a lesser extent than Gold's. As a yieldless asset, Silver tends to rise with lower interest rates. Its moves also depend on how the US Dollar (USD) behaves as the asset is priced in dollars (XAG/USD). A strong Dollar tends to keep the price of Silver at bay, whereas a weaker Dollar is likely to propel prices up. Other factors such as investment demand, mining supply – Silver is much more abundant than Gold – and recycling rates can also affect prices.
Silver is widely used in industry, particularly in sectors such as electronics or solar energy, as it has one of the highest electric conductivity of all metals – more than Copper and Gold. A surge in demand can increase prices, while a decline tends to lower them. Dynamics in the US, Chinese and Indian economies can also contribute to price swings: for the US and particularly China, their big industrial sectors use Silver in various processes; in India, consumers’ demand for the precious metal for jewellery also plays a key role in setting prices.
Silver prices tend to follow Gold's moves. When Gold prices rise, Silver typically follows suit, as their status as safe-haven assets is similar. The Gold/Silver ratio, which shows the number of ounces of Silver needed to equal the value of one ounce of Gold, may help to determine the relative valuation between both metals. Some investors may consider a high ratio as an indicator that Silver is undervalued, or Gold is overvalued. On the contrary, a low ratio might suggest that Gold is undervalued relative to Silver.
Artigos Recomendados


