


Dow Jones Industrial Average slides as Iran war, hawkish Fed drive fourth losing week
- The Dow drops roughly 1.5% for the week, its fourth straight losing week, as the Iran conflict and quadruple witching amplify selling pressure.
- The Federal Reserve's hawkish hold and revised dot plot showing only one rate cut for 2026 rattled markets midweek.
- Gold and Silver suffered their sharpest weekly declines in years as rising Treasury yields and a firmer US Dollar crushed leveraged positions.
- FedEx surged in premarket trade after smashing third-quarter earnings estimates and raising full-year guidance.
The Dow Jones Industrial Average tumbled around 257 points, or 0.6%, on Friday as all three major US indices tracked toward a fourth consecutive losing week. The S&P 500 fell 0.8%, while the Nasdaq Composite underperformed with a decline of 1.2%. Overnight strikes between Iran and Israel, fresh attacks on energy sites in the Persian Gulf, and a Wall Street Journal report that the Pentagon is deploying thousands of additional Marines to the Middle East all weighed on sentiment. Volatility was amplified by the quarterly quadruple witching event, which saw trillions of dollars in options and futures expire, driving heavier volumes and sharper intraday swings. Rising Treasury yields added further pressure as fears that inflation is reigniting and that Fed rate cuts are off the table continued to build.
Dow posts its worst week since 2022
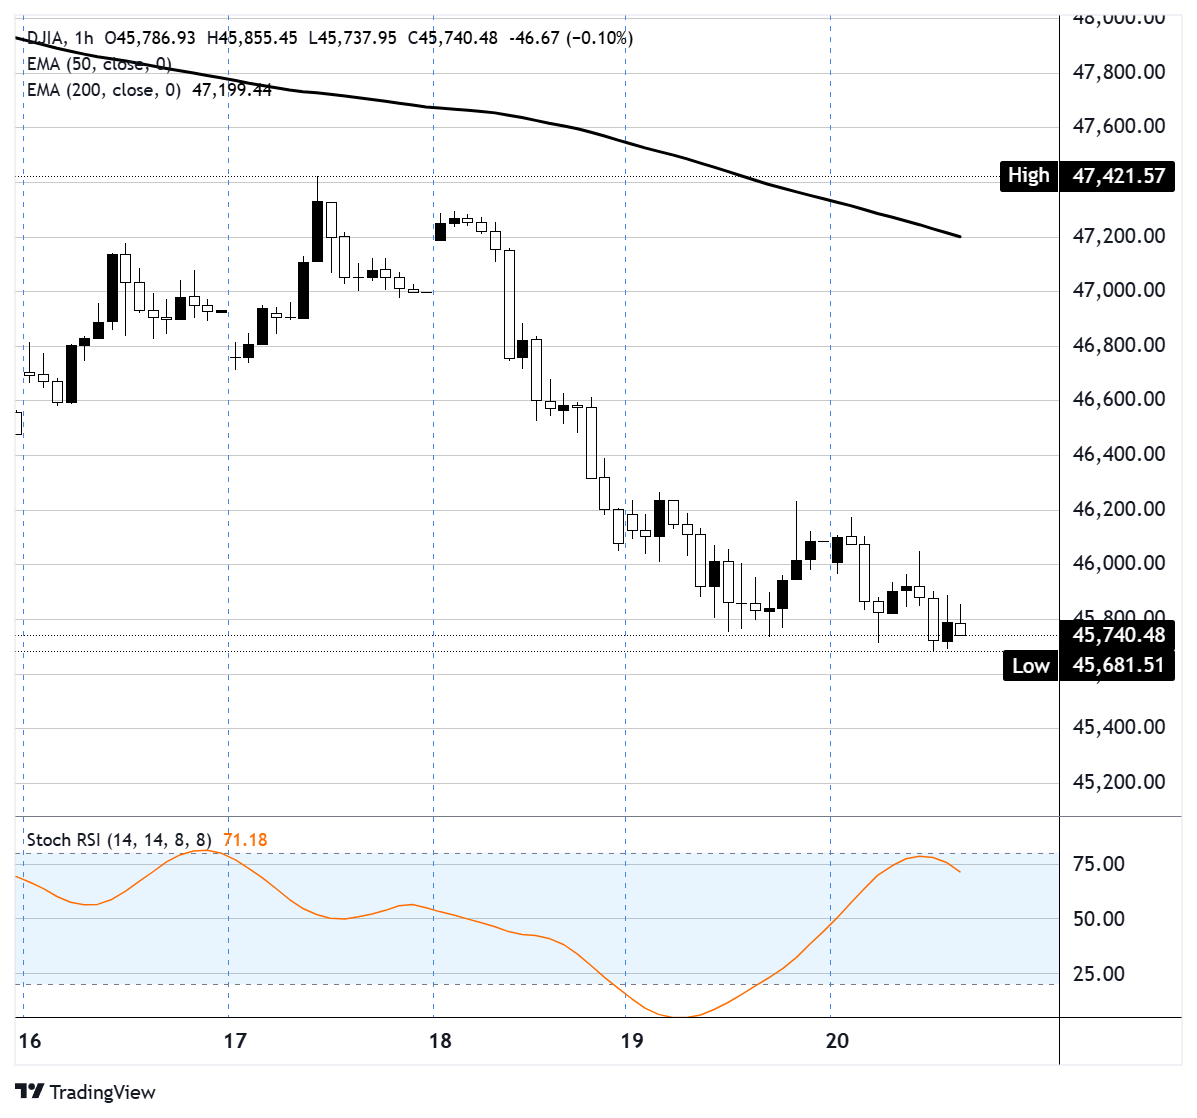
The hourly chart tells the story clearly. The Dow peaked near 47,400 early in the week before the FOMC decision triggered a roughly 1,700-point collapse to a weekly low near 45,700 on Thursday — the index's lowest level of the year. The Dow edged higher on Tuesday but was hit with a 768-point loss on Wednesday following the FOMC decision and hotter-than-expected inflation data. Thursday saw a partial recovery as Oil prices pulled back from session highs after Israeli Prime Minister Benjamin Netanyahu said Israel was helping the US reopen the Strait of Hormuz, but that bounce faded and selling resumed Friday. Price is now trading well below both the rapidly declining 50-period exponential moving average and the 200-period exponential moving average near 47,200, confirming the bearish trend. The Stochastic RSI has recovered toward 72 from deeply oversold conditions, but with this kind of overhead resistance, the bounce looks limited. For the week, the Dow was down around 1.5%, the S&P 500 shed roughly 0.9%, and the Nasdaq lost about 0.8%. Both the Dow and Nasdaq are now approaching correction territory, sitting 8.6% and more than 8% below their respective record closing highs. Deutsche Bank's Jim Reid noted that Friday marked the 15th trading day of the conflict, which is historically the average point at which US equities bottom out following a geopolitical shock. However, he cautioned that headlines would matter more than history given the level of uncertainty. On the other side, Unlimited CEO Bob Elliott argued the market remains too optimistic about the war's impact on earnings and the economy, noting that households are effectively seeing 1% to 2% of real purchasing power eroded even if the conflict were to resolve immediately.
Iran war keeps Oil elevated, energy stocks outperform
The Iran conflict remained the dominant macro theme throughout the week. Brent crude briefly surged toward $120 on Thursday after strikes on energy infrastructure in Iran and Qatar rattled an already tight market. The rally faded after Netanyahu's comments on reopening the Strait, and Oil pulled back further on Friday after The Wall Street Journal reported that US warplanes and helicopters had begun operations to clear the critical shipping lane. Both West Texas Intermediate and Brent hovered around flat on Friday, but remain up more than 40% since the war began in late February. Baird investment strategist Ross Mayfield warned that if the escalation involves troops on the ground, markets could face weeks more of elevated Oil prices and headline-driven volatility, adding that equities have not yet sold off in a way that fully reflects the severity of the situation. Chevron (CVX) was among the few bright spots in the Dow this week, gaining more than 1% on Thursday after HSBC upgraded shares to a buy rating, citing the company's relatively low Middle East exposure. Liquefied natural gas plays like Venture Global (VG) and Cheniere Energy (LNG) posted double-digit weekly gains as European gas prices remained elevated near four-year highs.
Fed's hawkish hold reshapes rate expectations
Wednesday's FOMC meeting proved to be the week's biggest catalyst for equities. The Fed held rates steady at 3.5%-3.75% as expected, but Chair Jerome Powell's comments spooked investors. Powell noted that inflation had not retreated as much as the central bank had hoped and acknowledged that near-term inflation expectations had risen alongside Oil prices. The updated dot plot showed the median FOMC member now expects only a single 25 basis point rate cut in 2026, down from earlier projections of multiple reductions. The CME FedWatch Tool reflected the hawkish shift. Following the decision, the probability of rates remaining unchanged through the June meeting jumped to around 89%, up from 63% a week earlier. More notably, the tool now shows a more-than-likely chance that rates will stay at their current level through year-end, with roughly 12% odds of a rate hike now priced in. The Producer Price Index (PPI) data released on the same day compounded the pressure, coming in hotter than expected for a second straight month.
US Dollar firms as Gold and Silver suffer brutal sell-off
The hawkish Fed repricing boosted the US Dollar, which rallied sharply midweek. The Dollar Index (DXY) spiked to a weekly high above 100.50 on Wednesday before pulling back toward the 99.00 handle on Thursday as risk sentiment briefly improved. By Friday, the DXY had recovered to trade around 99.60, sitting right on its 200-period exponential moving average with the Stochastic RSI pushing toward overbought territory near 74. The stronger Dollar and surging Treasury yields combined to crush precious metals. Gold broke below the psychologically critical $5,000 level on Wednesday and extended the decline toward $4,650 by Thursday, its lowest price since early February. Silver was hit even harder, with futures losing more than 8% in a single session. The sell-off was driven by leveraged positions being flushed as the higher-for-longer rate narrative took hold. Mining stocks bore the brunt, with Newmont (NEM) falling roughly 7.5% and Alcoa (AA) dropping more than 8% on Thursday. Gold edged slightly higher on Friday, but remains on track for its worst week since 2020.
FedEx soars on earnings beat, Micron dips despite blowout quarter
FedEx (FDX) was the standout corporate mover, surging roughly 9% in premarket trade on Friday after crushing fiscal third-quarter estimates. The logistics giant reported adjusted earnings per share of $5.25 on revenue of $24 billion, comfortably beating expectations of $4.09 and $23.4 billion respectively. The company also raised its full-year fiscal 2026 adjusted earnings per share guidance to a range of $19.30 to $20.10, with the low end topping the consensus estimate. CEO Raj Subramaniam credited the company's Network 2.0 restructuring initiative for driving efficiency gains. Elsewhere, Micron (MU) fell roughly 4% on Thursday despite posting blockbuster fiscal second-quarter results that nearly tripled revenue. Investors focused on the company's high capital spending plans rather than its strong demand outlook. Super Micro Computer (SMCI) plunged 25% after employees were charged with smuggling Nvidia chips to China. Planet Labs (PL) bucked the trend, surging 20% in early Friday trade on strong earnings and upbeat guidance.
Dow Jones 1-hour chart
Dow Jones FAQs
The Dow Jones Industrial Average, one of the oldest stock market indices in the world, is compiled of the 30 most traded stocks in the US. The index is price-weighted rather than weighted by capitalization. It is calculated by summing the prices of the constituent stocks and dividing them by a factor, currently 0.152. The index was founded by Charles Dow, who also founded the Wall Street Journal. In later years it has been criticized for not being broadly representative enough because it only tracks 30 conglomerates, unlike broader indices such as the S&P 500.
Many different factors drive the Dow Jones Industrial Average (DJIA). The aggregate performance of the component companies revealed in quarterly company earnings reports is the main one. US and global macroeconomic data also contributes as it impacts on investor sentiment. The level of interest rates, set by the Federal Reserve (Fed), also influences the DJIA as it affects the cost of credit, on which many corporations are heavily reliant. Therefore, inflation can be a major driver as well as other metrics which impact the Fed decisions.
Dow Theory is a method for identifying the primary trend of the stock market developed by Charles Dow. A key step is to compare the direction of the Dow Jones Industrial Average (DJIA) and the Dow Jones Transportation Average (DJTA) and only follow trends where both are moving in the same direction. Volume is a confirmatory criteria. The theory uses elements of peak and trough analysis. Dow’s theory posits three trend phases: accumulation, when smart money starts buying or selling; public participation, when the wider public joins in; and distribution, when the smart money exits.
There are a number of ways to trade the DJIA. One is to use ETFs which allow investors to trade the DJIA as a single security, rather than having to buy shares in all 30 constituent companies. A leading example is the SPDR Dow Jones Industrial Average ETF (DIA). DJIA futures contracts enable traders to speculate on the future value of the index and Options provide the right, but not the obligation, to buy or sell the index at a predetermined price in the future. Mutual funds enable investors to buy a share of a diversified portfolio of DJIA stocks thus providing exposure to the overall index.
Artigos Recomendados


