

GBP/JPY Price Forecast: Pound remains firm, with 208.20 holding bears
- GBP/JPY finds resistance at the 209.00 area but remains steady above 208.20.
- Japan's downbeat GDP and growing fiscal concerns are crushing the Yen this week.
- The technical picture remains positive, with 209.00 and 201.00 on the bull's focus.
The Pound keeps drawing support from the broad-based Yen weakness this week and remains steady near multi-year highs, at the 208.90 area, with downside attempts contained above 208.20 so far
The Japanese Yen has been dropping against its main peers this week, weighed by a combination of gloomy economic growth figures and concerns amid Prime Minister Talkaichi's cabinet’s plans to launch a USD 137 billion stimulus program that will add pressure to an already strained fiscal stability.
Technical analysis: GBP/JPY bulls eye 209.00 and the 210.00 area
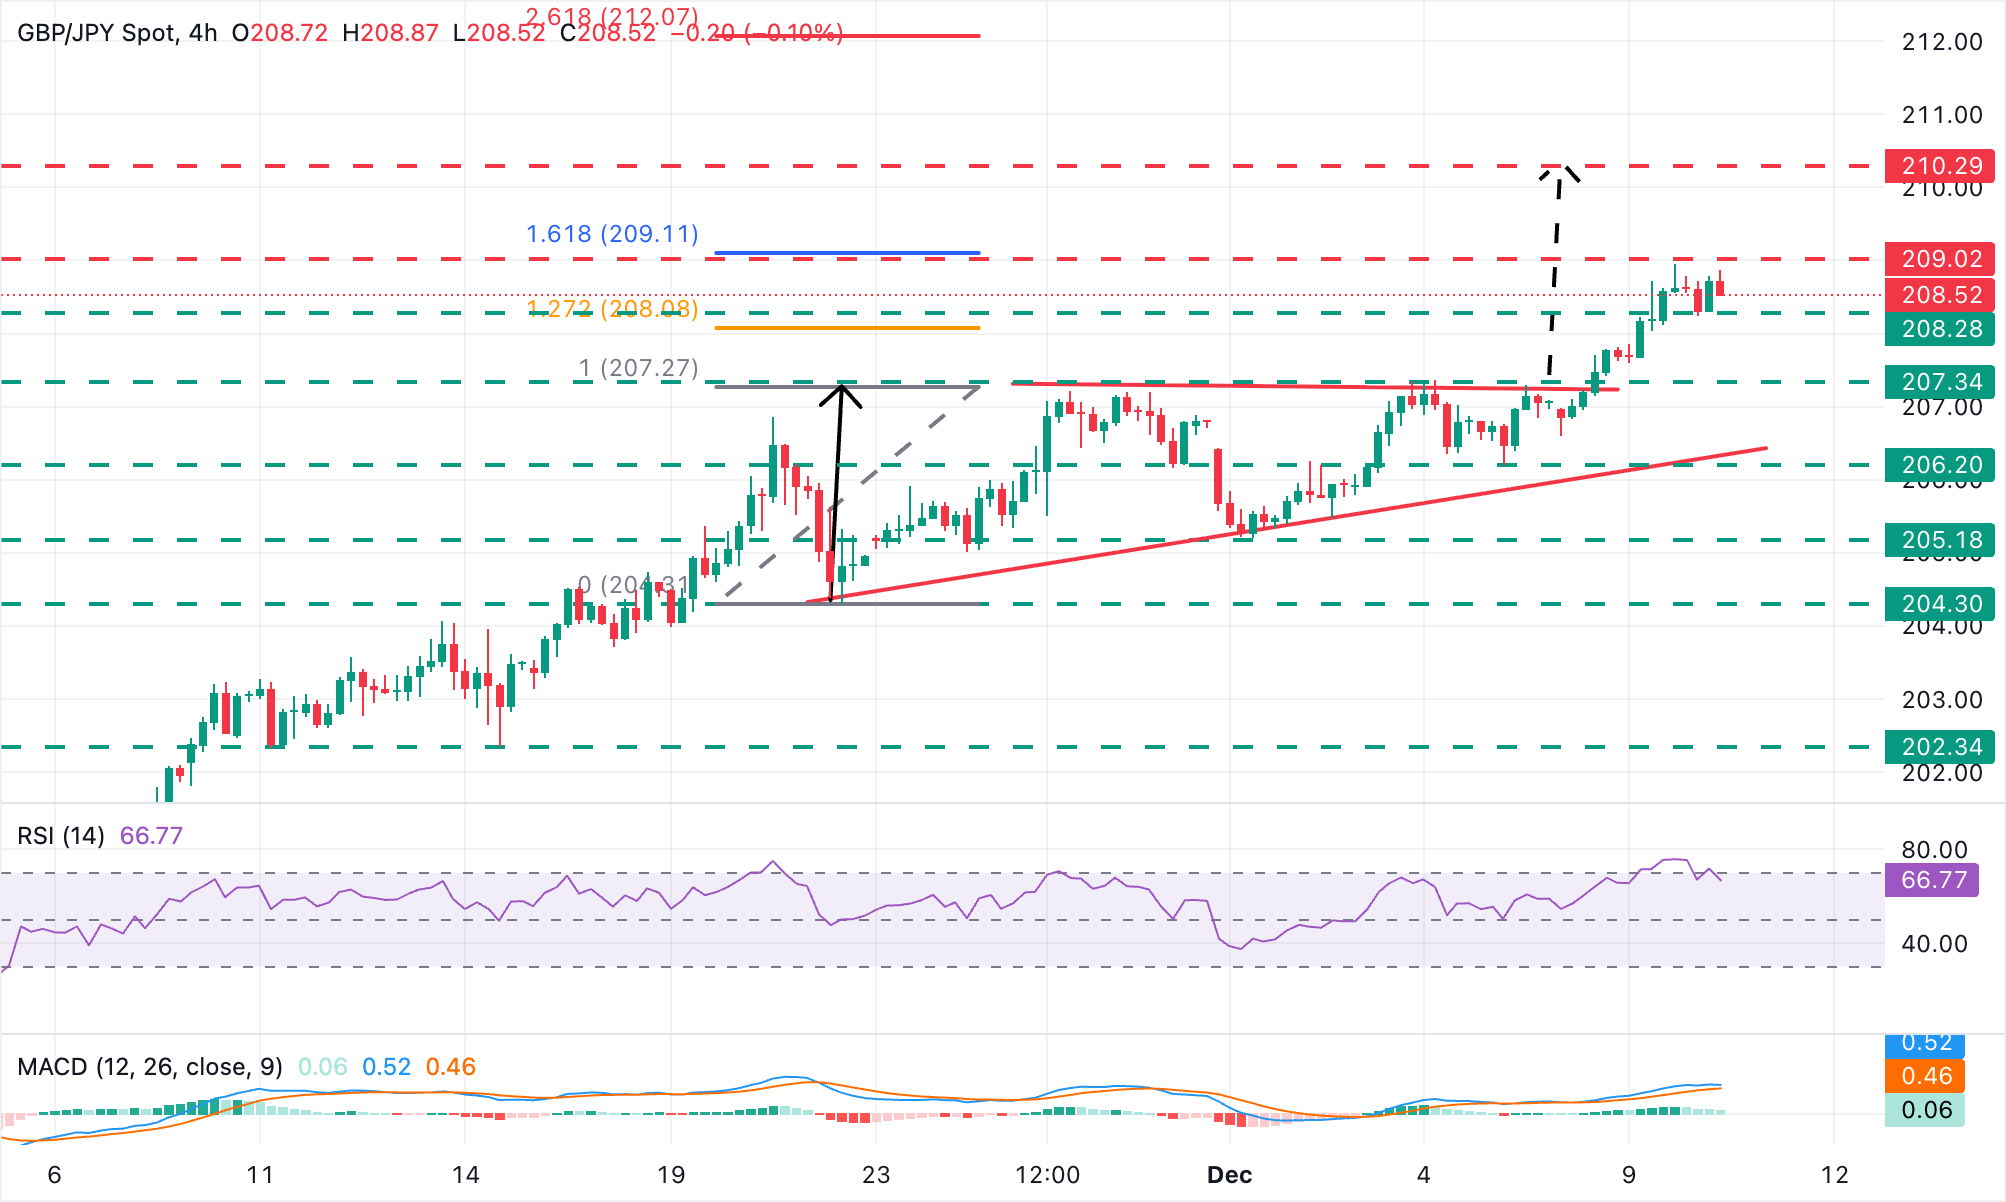
The technical picture shows the pair consolidating gains after rallying about 1.7% over the past two weeks. The 4-hour chart shows the Relative Strength Index (RSI) pulling back from overbought levels with the Moving Average Convergence Divergence (MACD) printing green bars, highlighting the positive momentum.
Immediate support is at the intraday low of 208.24, ahead of a previous resistance area, at 207.35 (the November 26, 27, and December 3, 5 highs), which is likely to act as support now. Further down, the trendline support, around 206.30, and the December 5 low, at 206.20, emerge as the following targets.
On the upside, Tuesday’s high at 208.95 is close to the 161.8% Fibonacci extension of the November 20-26 rally, at 209.15. A confirmation above these levels would expose the 210.00 psychological level. The triangle’s measured target is at 210.30.
Japanese Yen Price This week
The table below shows the percentage change of Japanese Yen (JPY) against listed major currencies this week. Japanese Yen was the strongest against the Swiss Franc.
| USD | EUR | GBP | JPY | CAD | AUD | NZD | CHF | |
|---|---|---|---|---|---|---|---|---|
| USD | 0.10% | 0.18% | 0.96% | 0.14% | -0.09% | -0.18% | 0.15% | |
| EUR | -0.10% | 0.11% | 0.91% | 0.08% | -0.15% | -0.23% | 0.09% | |
| GBP | -0.18% | -0.11% | 0.81% | -0.03% | -0.25% | -0.34% | -0.02% | |
| JPY | -0.96% | -0.91% | -0.81% | -0.80% | -1.02% | -1.10% | -0.77% | |
| CAD | -0.14% | -0.08% | 0.03% | 0.80% | -0.22% | -0.31% | 0.00% | |
| AUD | 0.09% | 0.15% | 0.25% | 1.02% | 0.22% | -0.09% | 0.23% | |
| NZD | 0.18% | 0.23% | 0.34% | 1.10% | 0.31% | 0.09% | 0.32% | |
| CHF | -0.15% | -0.09% | 0.02% | 0.77% | -0.01% | -0.23% | -0.32% |
The heat map shows percentage changes of major currencies against each other. The base currency is picked from the left column, while the quote currency is picked from the top row. For example, if you pick the Japanese Yen from the left column and move along the horizontal line to the US Dollar, the percentage change displayed in the box will represent JPY (base)/USD (quote).
Artigos Recomendados


