

SUI hits new all-time high fueled by Trump election win
- Sui touches a fresh all-time high of $2.38 as crypto-friendly candidate Donald Trump wins the US presidential election.
- SUI’s trading volume also reached a new all-time high of $2 billion on Wednesday.
- TVL value is rising, indicating more users deposit or use assets within SUI-based protocols.
Sui (SUI) edges down on Thursday and trades at around $2.24 after hitting a new all-time high (ATH) of $2.38 earlier in the day, buoyed by the victory of a crypto-friendly candidate, Donald Trump, in the US presidential election.
This bullish momentum is further supported by rising Total Value Locked (TVL) and daily trading volume, which also reached a new all-time high, reflecting heightened trader activity and usage of the SUI ecosystem.
SUI eyes the $3.15 mark after hitting a fresh all-time high
Sui price found support around the 50-day EMA at $1.81 on Monday and rallied over 25% until Wednesday. At the time of writing on Thursday, Sui’s price trades down at around $2.24 after reaching a fresh ATH of $2.38.
If SUI continues its upward momentum and closes above $2.36, it may set the stage for a potential move toward the 141.40% Fibonacci extension, drawn from the August 5 low of $0.462 to the October 14 high of $2.36, at $3.15. However, traders might consider taking profits around the psychologically important level of $3.00.
The Moving Average Convergence Divergence (MACD) indicator further supports Sui’s rise, signaling a bullish crossover on Wednesday’s daily chart. The MACD line (blue line) moved above the signal line (yellow line), giving a buy signal. Additionally, the Relative Strength Index (RSI) indicator is at 61, above its neutral level of 50, suggesting that bullish momentum is gaining traction.
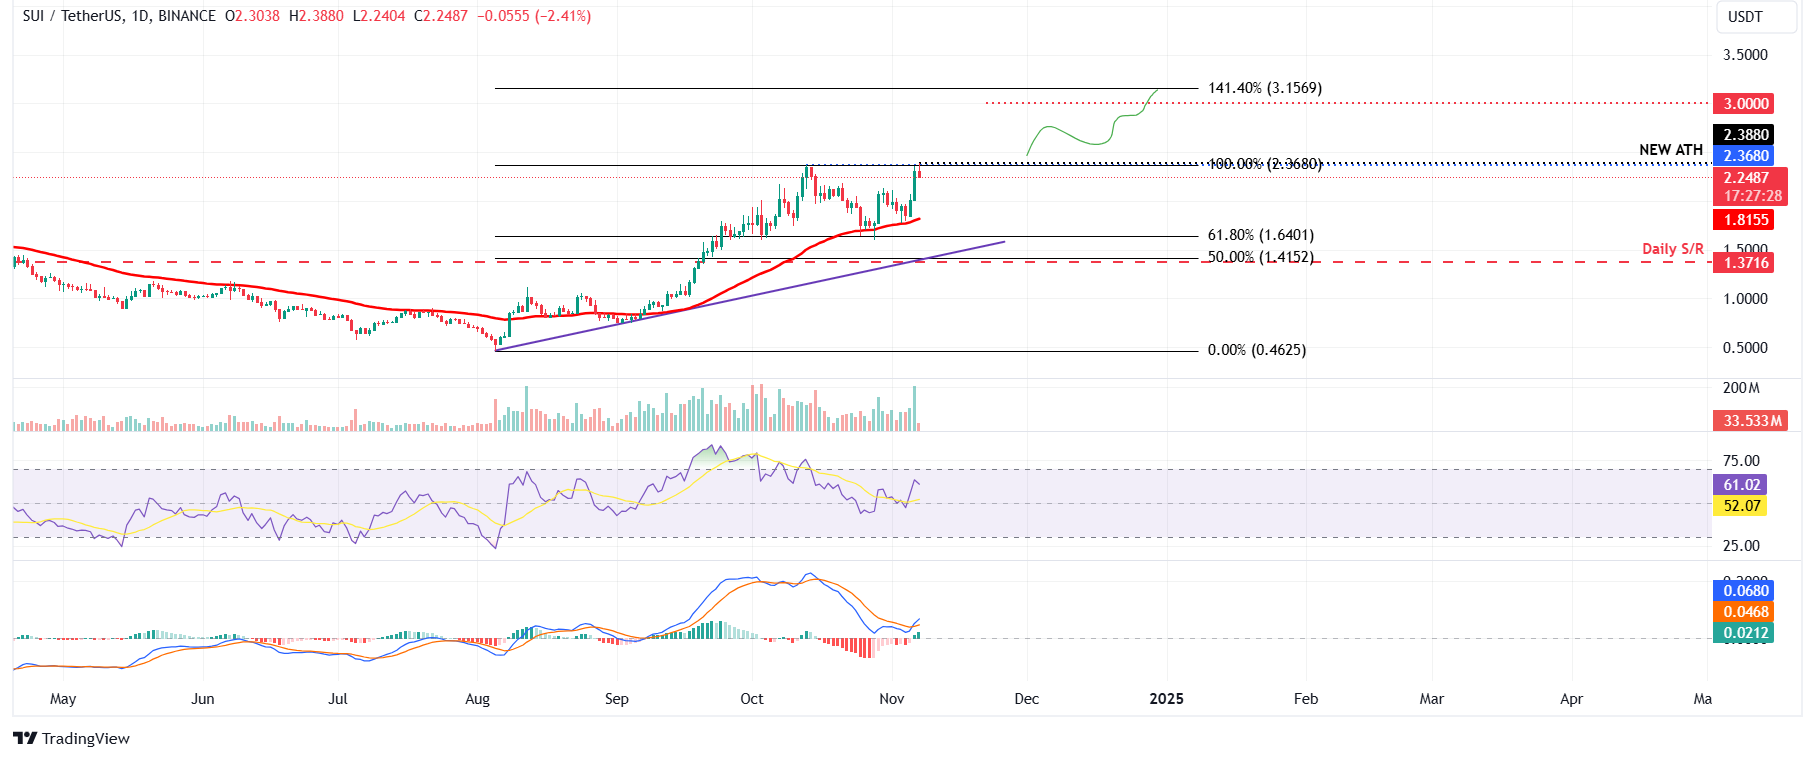
SUI/USDT daily chart
Another aspect bolstering the platform’s bullish outlook is a recent surge in traders’ interest and liquidity in the SUI ecosystem. Santiments’ data shows that SUI’s daily trading volume rose from $432.9 million on Saturday to $2 billion on Wednesday, the highest level since its launch.
 [12.00.19, 07 Nov, 2024]-638665650518695541.png)
SUI’s daily trading volume chart. Source: Santiment
Crypto aggregator platform DefiLlama data shows a bullish outlook for Sui. The data shows that Sui’s TVL increased from $892.98 million on October 28 to $1.09 billion on Thursday, the highest level since October 15 and close to an all-time high.
An increase in TVL suggests that the Sui blockchain ecosystem is becoming more active for users. It supports the bullish view by indicating that more users deposit or use assets within SUI-based protocols.
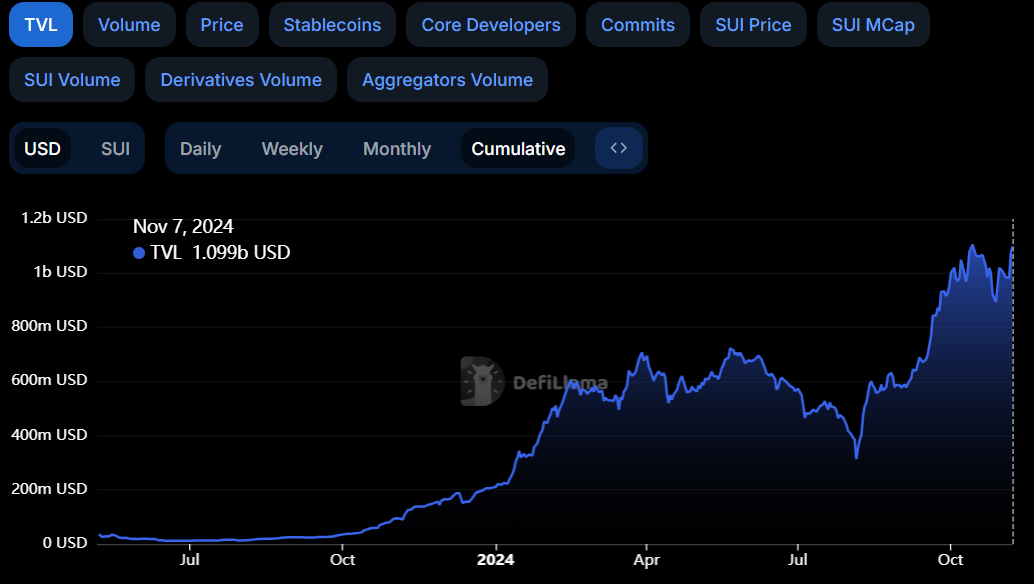
SUI TVL chart. Source: DefiLlama
추천 기사


