


Pi Network Price Forecast: PI retreats to key support level as selling pressure resurfaces
- Pi Network hovers around $0.0900 on Friday, following a 3% decline the previous day.
- Momentum indicators suggest a firm bearish bias despite the recent Open Standard partnership.
- The technical outlook for PI indicates a bearish bias, with a risk of a breakout below a rising wedge pattern.
Pi Network (PI) price remains volatile in the near term, hovering around $0.0900 at press time on Friday after losing over 3% the previous day. The pullback warns of a steeper correction, with a risk of breaking below a rising wedge pattern on the four-hour chart.
Pi Network fails to sustain upside momentum despite steady developments
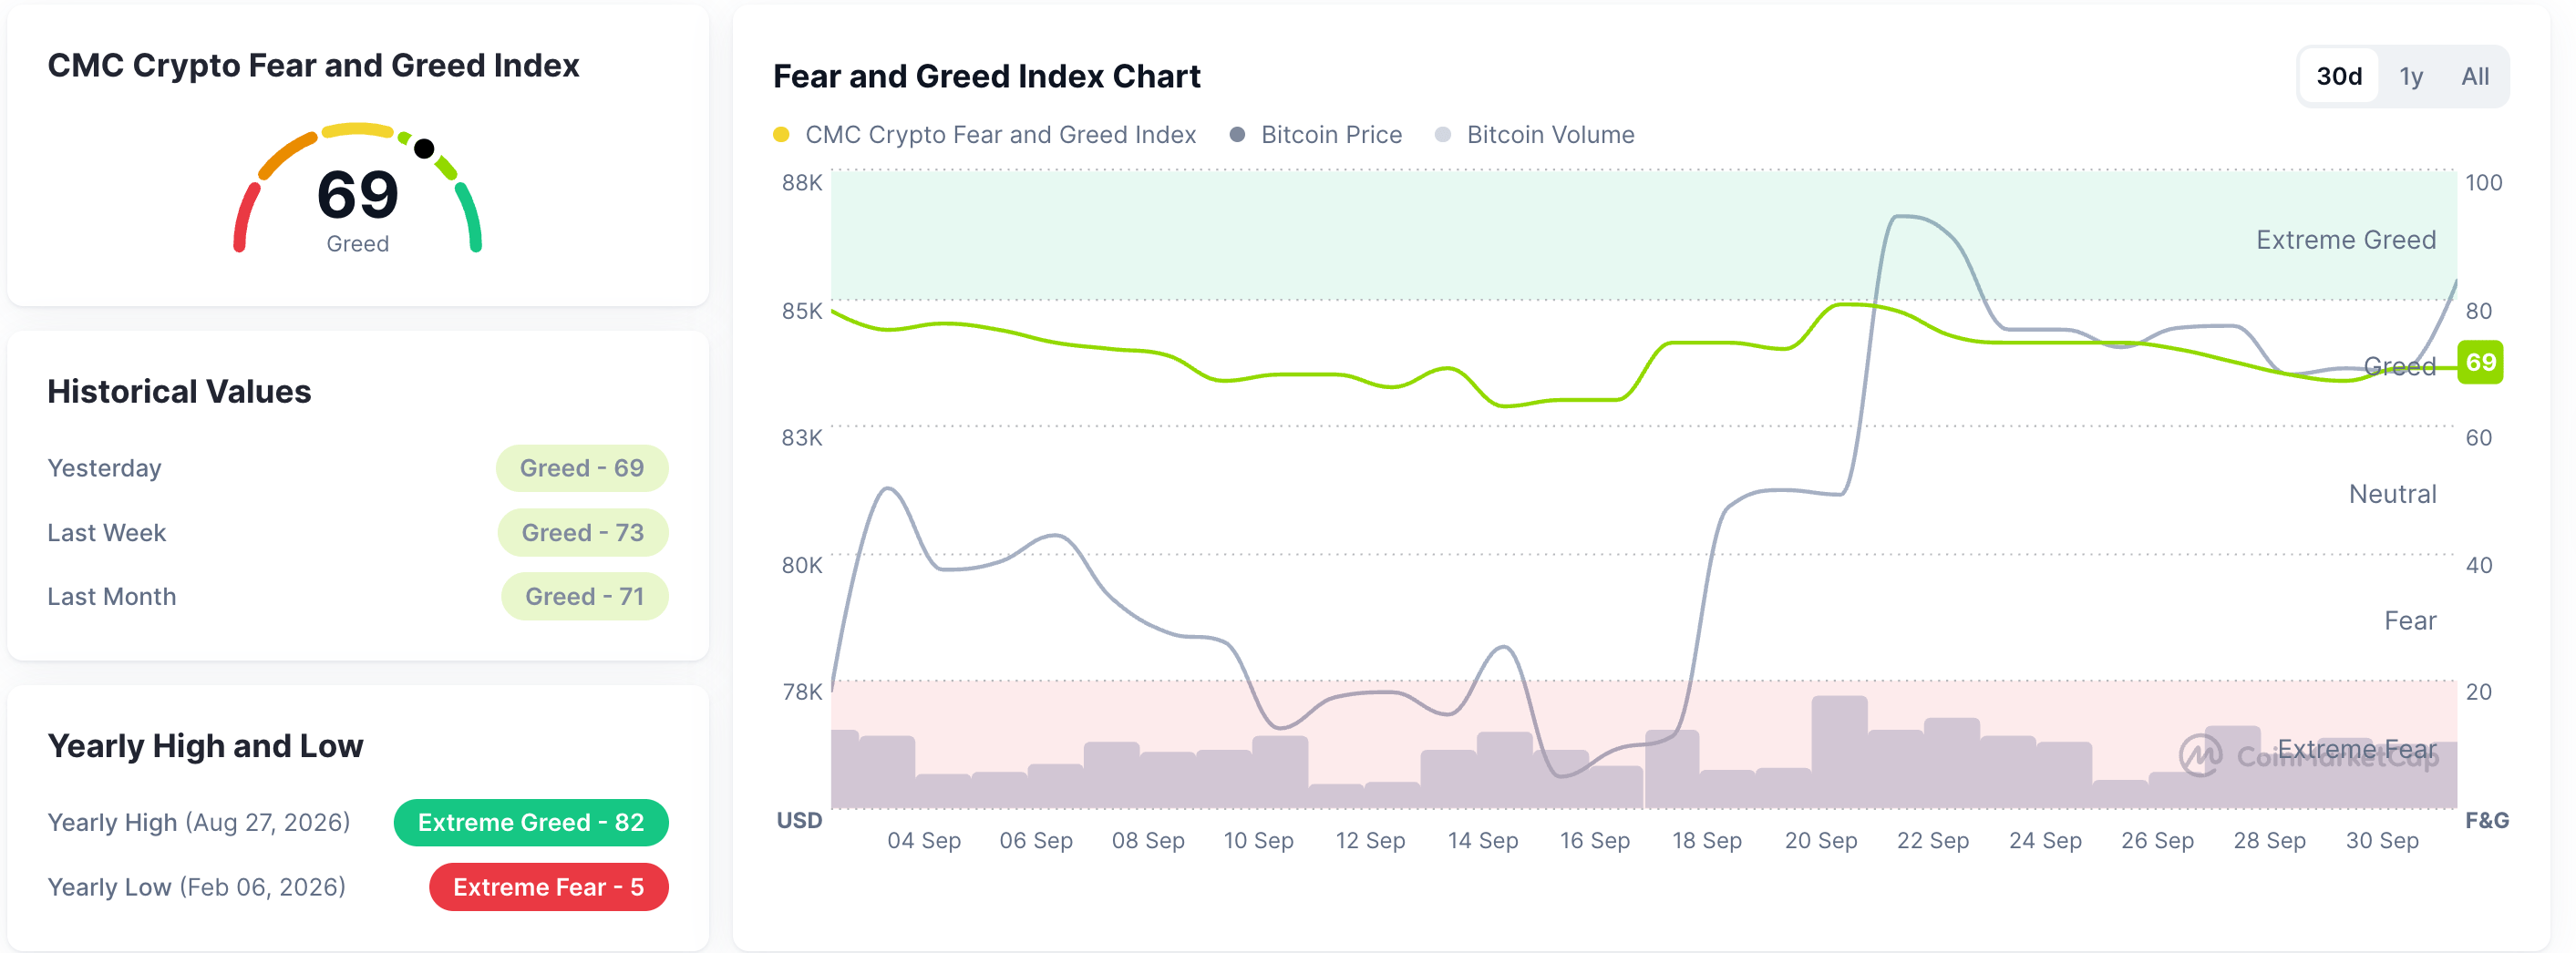
Pi Network struggles to maintain a steady recovery as the price remains capped below the $0.1000 psychological barrier. The mild recovery faces constant headwinds despite the Core Team’s recent partnership with Open Standard to integrate OUSD stablecoin rewards and the network upgrade to the v27 protocol. In addition, the broader crypto market sustains a broadly risk-on sentiment, with the Fear and Greed Index at 69 on Friday, holding well above the neutral region.
Technical outlook: Pi Network risks a lower leg
Pi Network trades around $0.0900 at press time on Friday, holding steady after a 3% decline the previous day. The price hovers around the clustered 50- and 100-period Exponential Moving Averages (EMAs) on the four-hour chart near $0.0900, but remains capped by the 200-period EMA at $0.0902, keeping the near‑term tone slightly bearish.
From a technical perspective, the recovery in PI from the mid-September low around $0.0704 forms a rising wedge pattern on the four-hour chart. The 50% retracement level at $0.0891, measured from the mid-September decline from $0.0989 to $0.0804, reinforces the rising support trendline and forms a strong demand zone.
Any deeper pullback below this zone could test the 23.6% Fibonacci retracement at $0.0844, followed by the previous month's low at $0.0804.
The Relative Strength Index (RSI) at 46 on the four-hour chart sits just below the midline, hinting at waning bullish momentum, while the Moving Average Convergence Divergence (MACD) has slipped marginally below zero with a growing histogram, supporting the odds of a bearish breakout.
On the topside, immediate resistance is located at the 200-period EMA at $0.0902, followed by the overhead trendline near $0.0940. To reinforce a steady recovery, PI must surpass the 78.6% Fibonacci retracement at $0.0946, which could open the path toward the $0.0989 swing high.
(The technical analysis of this story was written with the help of an AI tool. Know more.)
추천 기사


