


Top 3 Price Prediction: Bitcoin, Ethereum, Ripple – BTC, ETH, XRP under pressure as momentum indicators flag early bearish signals
- Bitcoin remains under pressure on Wednesday, with early bearish signals in momentum indicators.
- Ethereum extends its pullback, trading below $2,410 after rejection from the $2,500 mark.
- XRP consolidates under the 200-day EMA at $1.350, suggesting a mild bearish outlook.
Bitcoin (BTC), Ethereum (ETH) and Ripple (XRP) remain under pressure on Wednesday, with technical indicators suggesting early weakening momentum across the top three cryptocurrencies following massive gains in August. BTC shows early bearish signals, while ETH has extended its pullback after rejection near $2,500. Meanwhile, XRP is consolidating below key support, keeping the outlook cautious.
Bitcoin shows early bearish signs
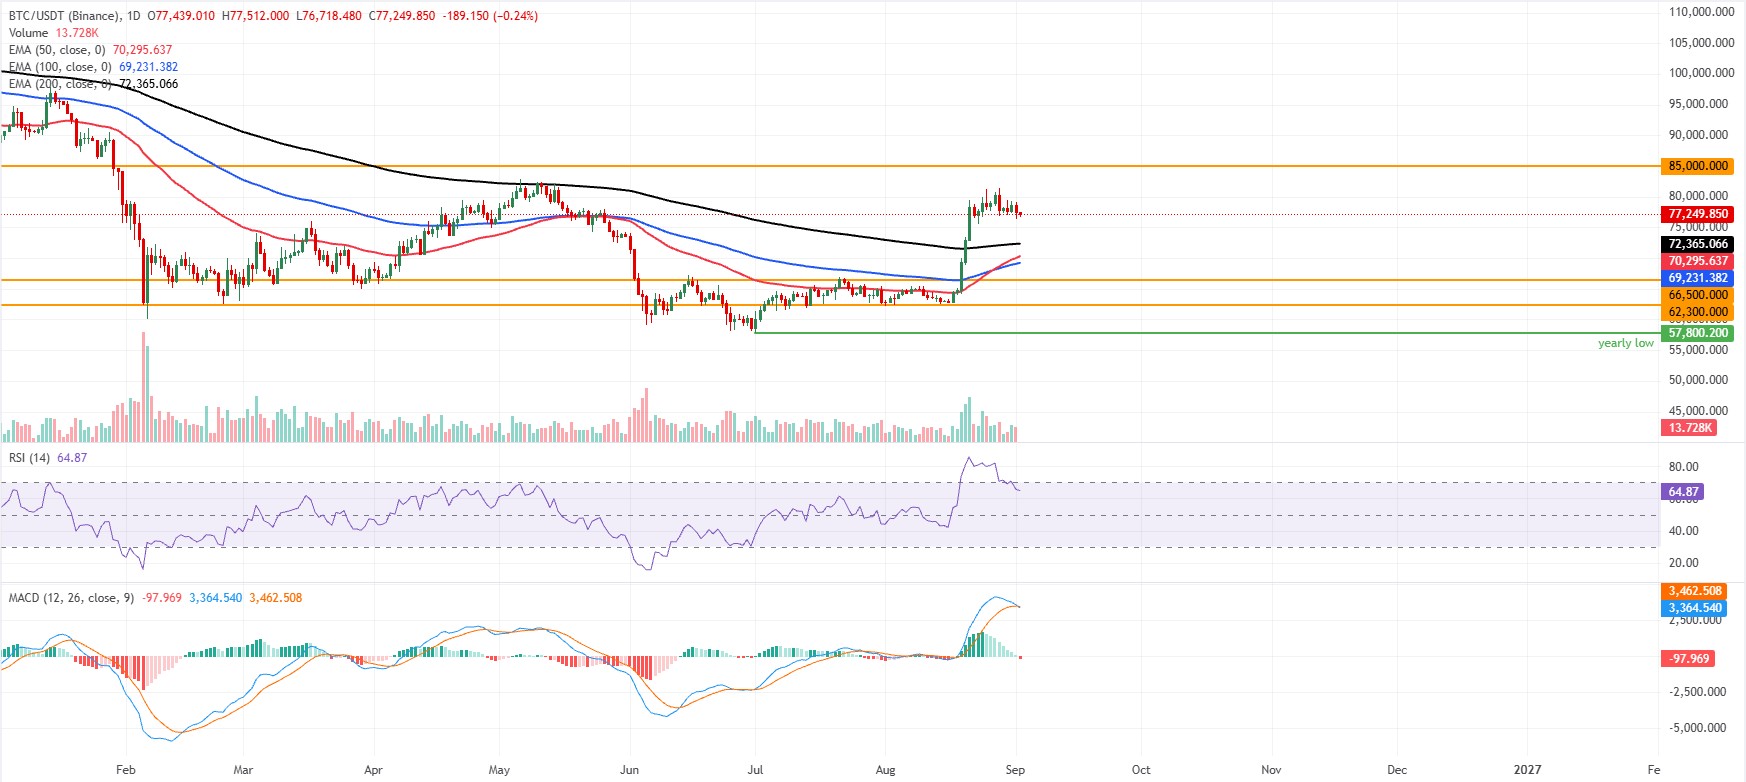
Bitcoin price trades at $77,249 on Wednesday after a mild correction the previous day. Despite the pullback, BTC maintains a bullish near-term bias as price holds well above the 50-day, 100-day, and 200-day Exponential Moving Averages (EMAs), clustered between roughly $69,300 and $72,400.
This stacked configuration of rising EMAs suggests the broader uptrend remains intact, even as Moving Average Convergence Divergence (MACD) has slipped back toward the signal line and turned slightly negative, hinting at some loss of upside momentum while the Relative Strength Index (RSI) eases from overbought territory but stays comfortably above the neutral 50 line.
On the downside, initial support is at the longer-term 200-day EMA around $72,365, the 50-day EMA around $70,295, the 100-day EMA near $69,232, with additional structural floors at $66,500 and $62,300 if a deeper correction unfolds.
On the topside, the next notable resistance aligns with the horizontal barrier at $85,000, and a daily close above this level would reopen the path for the uptrend. In contrast, failure to clear it could encourage further consolidation back toward the EMA support band.
Ethereum faces rejection from the $2,500 mark
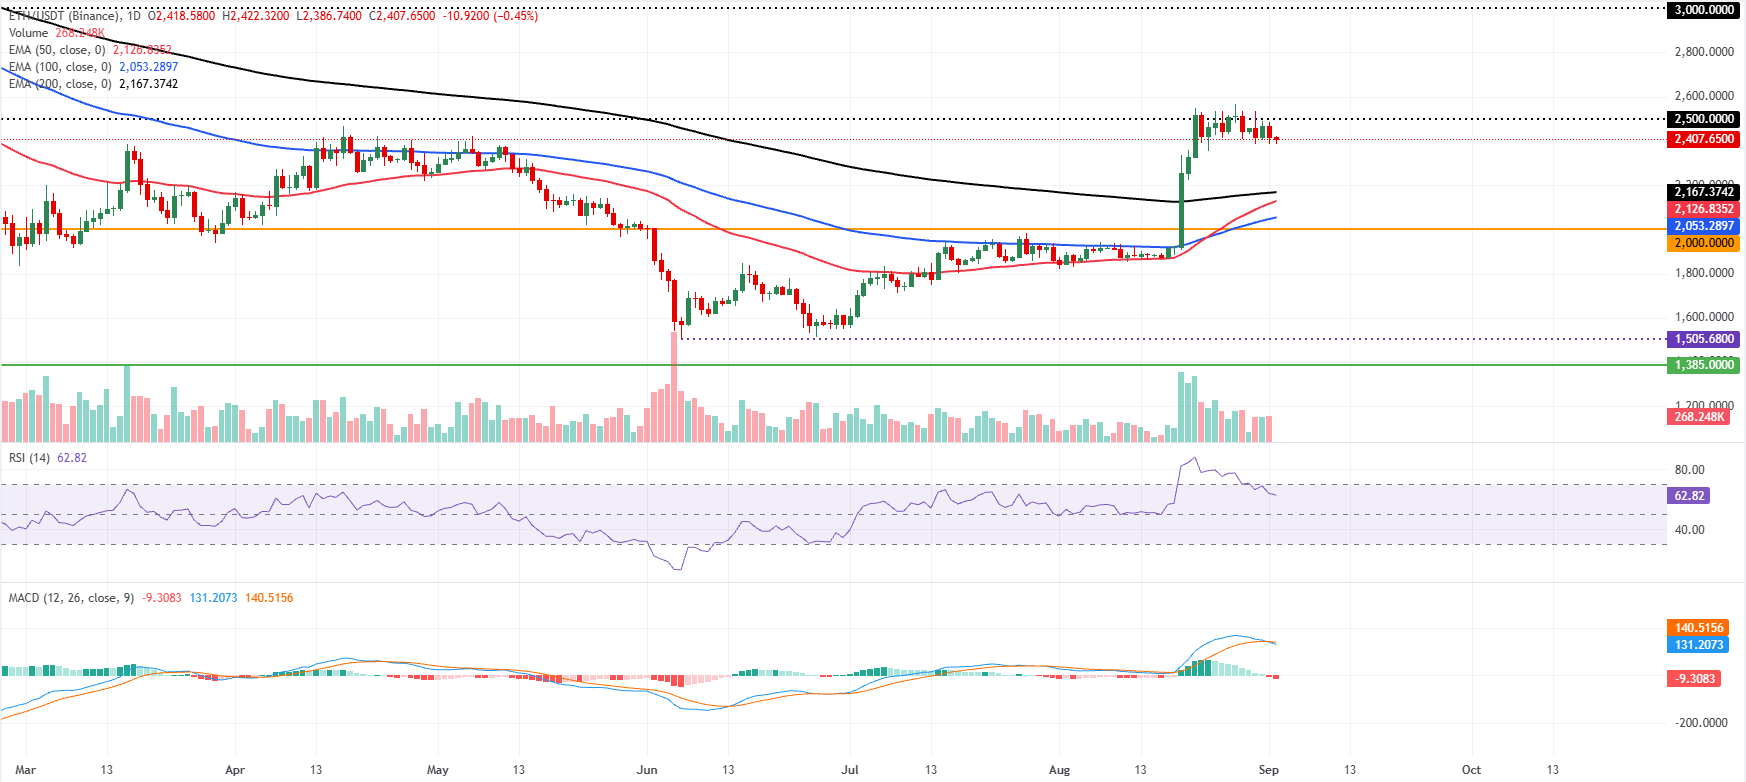
Ethereum trades at $2,407 on Wednesday after rejection near $2,500 the previous day. ETH holds a constructive near-term bias as price trades firmly above the 50-day, 100-day and 200-day EMAs clustered between roughly $2,060 and $2,170, suggesting a supportive medium-term trend despite the latest pullback from recent highs.
The RSI eases to about 63 from overbought territory, hinting at cooling but still positive momentum. At the same time, the Moving Average Convergence Divergence (MACD) has slipped into negative territory, reinforcing the view that upside may be consolidating rather than accelerating in the very near term.
On the topside, immediate resistance emerges at the horizontal barrier near $2,500, with a subsequent cap at $3,000 where sellers are likely to reassert control if the recovery extends.
On the downside, initial support appears at the 200-day EMA around $2,167, reinforced by the 50-day EMA near $2,126 and the 100-day EMA near $2,053. At the same time, a deeper retreat would bring the psychological $2,000 horizontal floor into focus.
XRP slips below key support
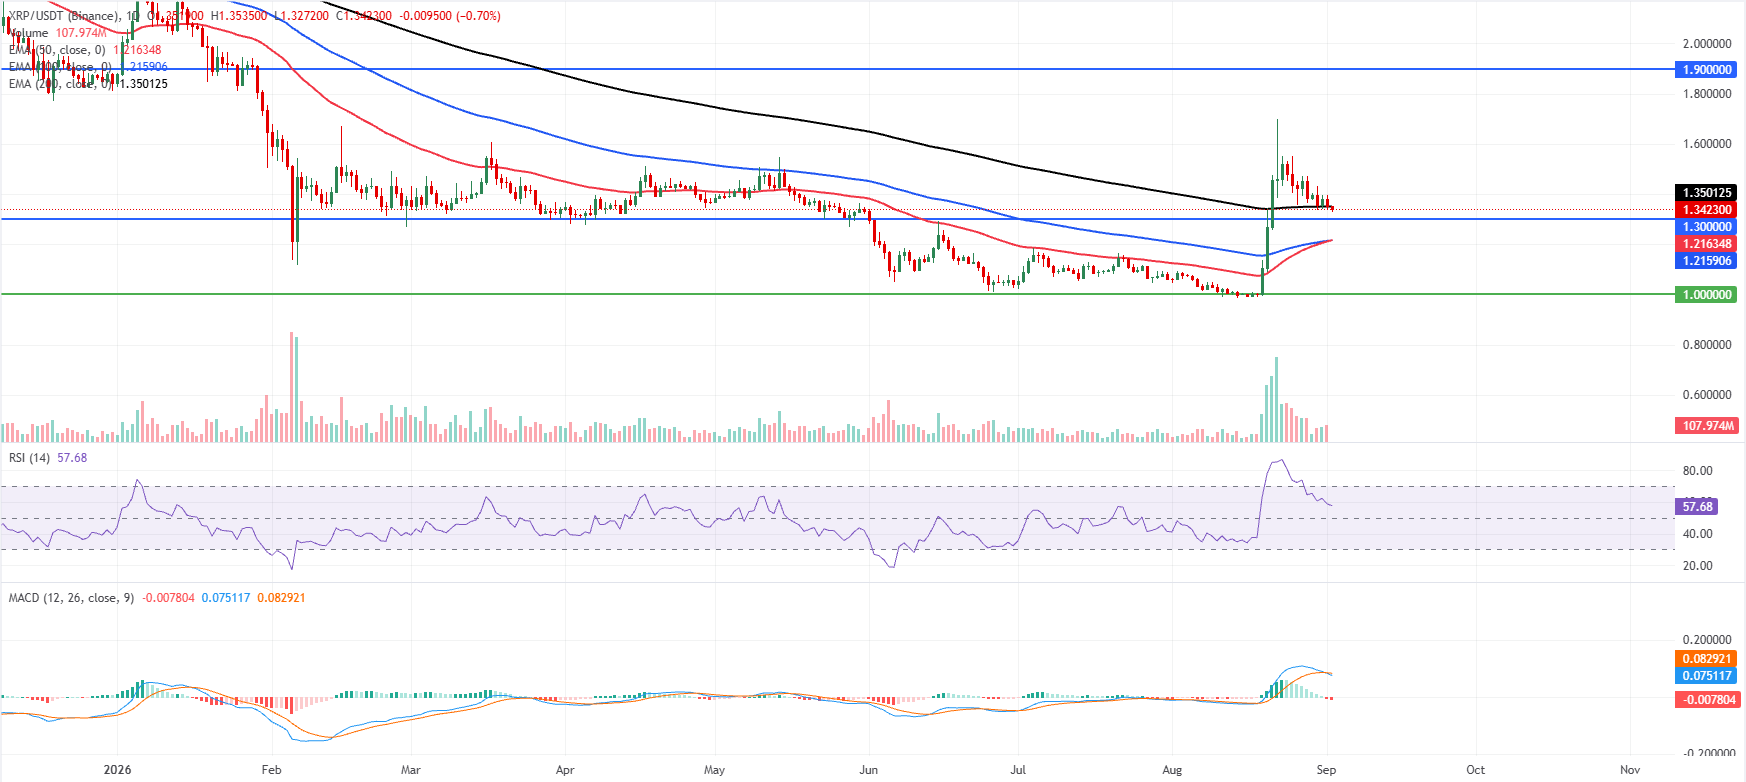
XRP price trades at $1.342 on Wednesday, consolidating just under the 200-day EMA at $1.350, leaving the broader bias neutral as it holds above the clustered 50-day and 100-day EMAs around $1.216 but has yet to reclaim its longer-term trend barrier.
The RSI at 57 shows mildly positive but not overbought momentum, while the MACD has slipped slightly negative, hinting at waning upside pressure after the recent surge.
On the topside, immediate resistance is defined by the 200-day EMA at $1.350; a daily close above this level would expose the next notable cap at the horizontal resistance near $1.900.
On the downside, initial demand is seen at the horizontal support around $1.300, with stronger structural support emerging from the 50-day EMA at $1.216 and the 100-day EMA at $1.215; a loss of these levels could trigger a deeper pullback toward the psychological and historical floor near $1.000.
(The technical analysis of this story was written with the help of an AI tool. Know more.)
Cryptocurrency metrics FAQs
The developer or creator of each cryptocurrency decides on the total number of tokens that can be minted or issued. Only a certain number of these assets can be minted by mining, staking or other mechanisms. This is defined by the algorithm of the underlying blockchain technology. On the other hand, circulating supply can also be decreased via actions such as burning tokens, or mistakenly sending assets to addresses of other incompatible blockchains.
Market capitalization is the result of multiplying the circulating supply of a certain asset by the asset’s current market value.
Trading volume refers to the total number of tokens for a specific asset that has been transacted or exchanged between buyers and sellers within set trading hours, for example, 24 hours. It is used to gauge market sentiment, this metric combines all volumes on centralized exchanges and decentralized exchanges. Increasing trading volume often denotes the demand for a certain asset as more people are buying and selling the cryptocurrency.
Funding rates are a concept designed to encourage traders to take positions and ensure perpetual contract prices match spot markets. It defines a mechanism by exchanges to ensure that future prices and index prices periodic payments regularly converge. When the funding rate is positive, the price of the perpetual contract is higher than the mark price. This means traders who are bullish and have opened long positions pay traders who are in short positions. On the other hand, a negative funding rate means perpetual prices are below the mark price, and hence traders with short positions pay traders who have opened long positions.
추천 기사


