


Dogecoin Price Forecast: DOGE nears yearly low as risk appetite fades
- Dogecoin extends losses on Thursday, approaching its yearly low at $0.069.
- Escalating US-Iran tensions and renewed Houthi threats have dampened risk appetite, weighing on speculative assets such as meme coins.
- Weakening derivatives metrics show cautious trader sentiment, signaling a deeper correction in DOGE.
Dogecoin (DOGE) extends its decline on Thursday, approaching its yearly low at $0.069 as bearish sentiment continues to weigh on the meme coin. Escalating US-Iran conflict and fresh Houthi threats have dampened risk appetite, weighing on speculative assets such as DOGE. Weakening derivatives metrics and a deteriorating technical outlook suggest a deeper correction if DOGE slips below $0.069.
Renewed geopolitical tensions dampen risk appetite
The US military said it completed the 11th night of strikes on Iran early Wednesday, targeting aircraft hangars and drone storage sites. Iran, on the other hand, continued attacks across the Gulf, targeting US military assets in Bahrain, Kuwait and Jordan.
Adding to this, Iran said that its forces struck two Oil tankers as they attempted to transit through the Strait of Hormuz. Furthermore, Yemen’s Iran-aligned Houthis targeted two Saudi Oil tankers in the Red Sea, opening a new front in the war and adding to fears of further disruption of energy flows.
On Thursday, US President Donald Trump warned the US would target Iranian infrastructure, including bridges and power plants, if attacks on vessels in the Strait of Hormuz continued.
These renewed uncertainty has pushed Oil prices sharply higher this week, weighing on risk sentiment and reigniting inflation concerns. The shift has prompted traders to reassess the Federal Reserve’s (Fed) policy outlook.
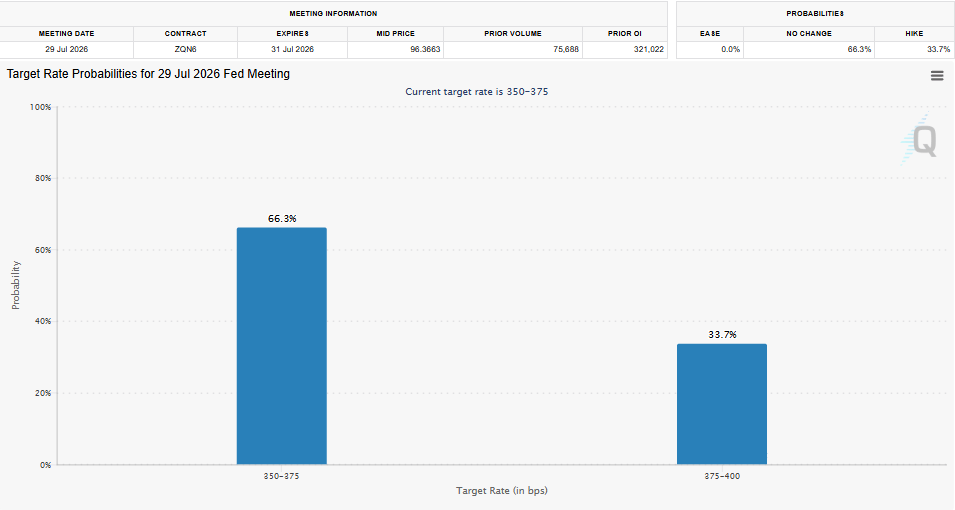
The CME FedWatch Tool chart below shows the probability of a July rate hike rising to 33.7% from around 25% a day earlier and the 12% seen a week ago. This change reflects expectations that the Fed could maintain a more hawkish stance, weighing on risk assets such as Bitcoin and exerting even greater pressure on highly speculative assets like meme coins.
Derivatives data shows bearish bias
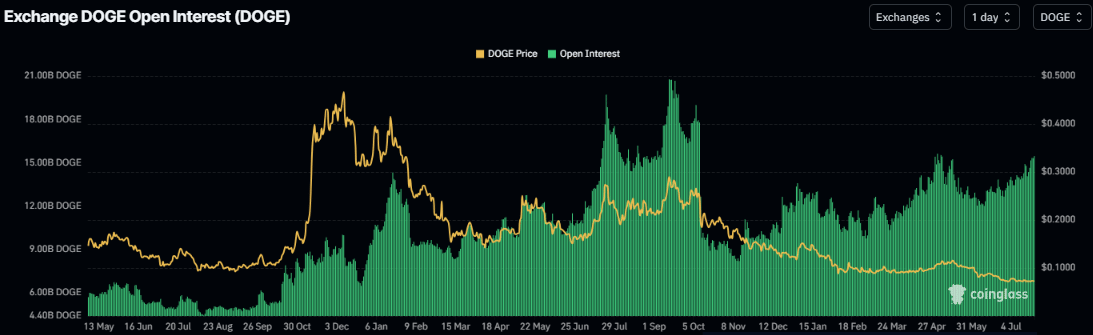
Dogecoin’s derivatives metrics show weakening conditions. Coinglass’s Open Interest (OI) across exchanges chart for DOGE has been rising since mid-June, with outstanding contracts reaching 15.44 billion DOGE coins on Thursday. The increase in OI alongside falling prices suggests that new short positions are entering the market, signaling a bearish outlook and raising the risk of further correction in DOGE.
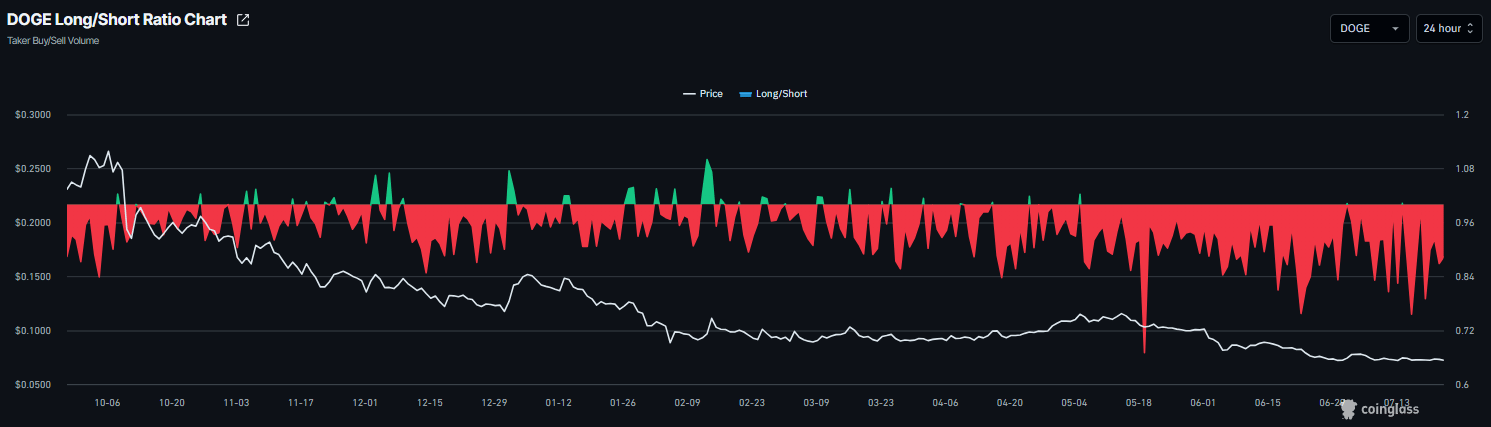
The bearish thesis strengthened as the long-to-short ratio for the meme coin remained below 1, reading 0.88 on Thursday, nearing the lowest level over a month. A ratio below one, indicates that traders are betting on the asset price to fall.
Dogecoin Price Forecast: Heading towards the yearly low
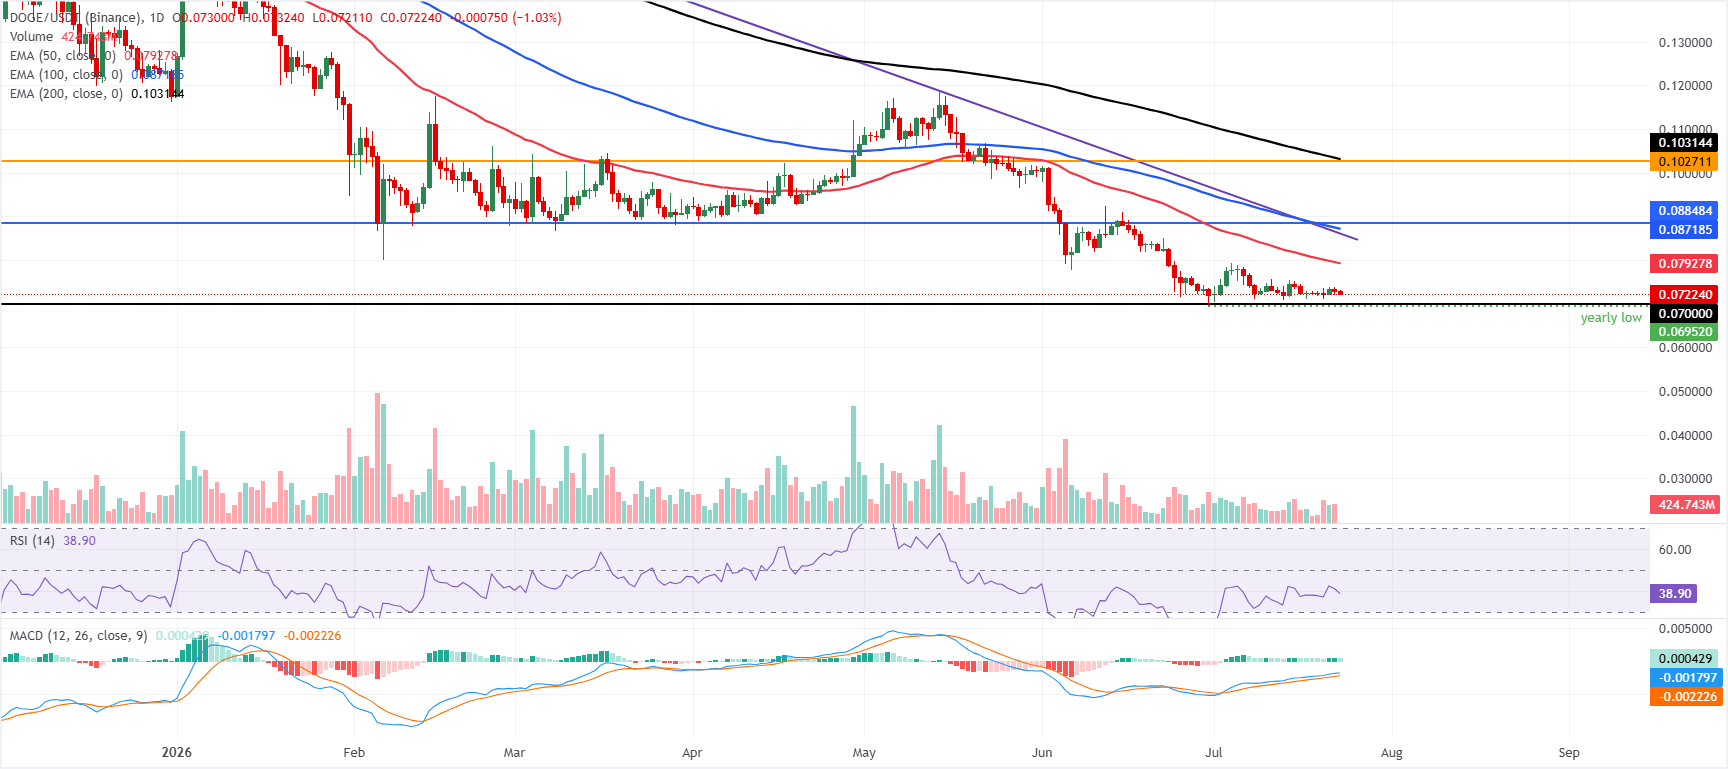
Dogecoin trades at $0.072 on Thursday, maintaining a bearish near-term posture as it remains well below the 50-day, 100-day, and 200-day Exponential Moving Averages (EMAs), clustered between roughly $0.079 and $0.103.
The meme coin continues to trade under the downward resistance trend line, whose break price at $0.085 reinforces the overhead supply, while the Relative Strength Index (RSI) on the daily chart around 38 stays in mildly bearish territory and the Moving Average Convergence Divergence (MACD) indicator hovers just above the zero line with a flat profile, hinting at weak momentum rather than a decisive reversal.
On the topside, initial resistance is seen at the 50-day EMA at $0.079, followed by the downtrend break level at $0.085 and the 100-day EMA at $0.087, with a nearby horizontal cap at $0.088 adding to the barrier zone. Higher up, a prior horizontal ceiling at $0.102 and the 200-day EMA at $0.103 mark a broader structural hurdle for any sustained recovery.
On the downside, the yearly low at $0.069 provides immediate support; a close below it suggests deeper losses toward the key psychological level of $0.065.
(The technical analysis of this story was written with the help of an AI tool. Know more.)
추천 기사


